Introduction
This is a report for the insert benchmark with 400M docs and 20 client(s). It is generated by scripts (bash, awk, sed) and Tufte might not be impressed. An overview of the insert benchmark is here and a short update is here. Below, by DBMS, I mean DBMS+version.config. An example is my8020.c10b40 where my means MySQL, 8020 is version 8.0.20 and c10b40 is the name for the configuration file.
The test server is a c2-standard-60 from GCP with 30 cores, hyperthreading disabled, 240G RAM and 3T from XFS and SW RAID 0 striped over 8 local NVMe drives. The benchmark was run with 20 clients and there were 1 or 2 connections per client (1 for queries, 1 for inserts). The benchmark loads 400M rows without secondary indexes, creates secondary indexes, loads another 400M rows then does 3 read+write tests for one hour each that do queries as fast as possible with 100, 500 and then 1000 writes/second/client concurrent with the queries. Each read-write test runs for 1800 seconds. The test was configured to use one table. The database fits in the OS page cache but not the DBMS buffer pool. Clients and the DBMS share one server. The per-database configs are in the per-database subdirectories here.
The tested DBMS are:
- pg147_def.cx7_gcp_c2s60_4g - Postgres 14.7, the cx7_gcp_c2s60_4g config and a default build that used -O2
- pg147_o3_native_lto.cx7_gcp_c2s60_4g - Postgres 14.7, the cx7_gcp_c2s60_4g config and a build that uses -O3 -march=native -mtune=native -flto (link-time optimization)
Contents
- Summary
- l.i0: load without secondary indexes
- l.x: create secondary indexes
- l.i1: continue load after secondary indexes created
- q100.1: range queries with 100 insert/s per client
- q500.1: range queries with 500 insert/s per client
- q1000.1: range queries with 1000 insert/s per client
Summary
The numbers are inserts/s for l.i0 and l.i1, indexed docs (or rows) /s for l.x and queries/s for q*.2. The values are the average rate over the entire test for inserts (IPS) and queries (QPS). The range of values for IPS and QPS is split into 3 parts: bottom 25%, middle 50%, top 25%. Values in the bottom 25% have a red background, values in the top 25% have a green background and values in the middle have no color. A gray background is used for values that can be ignored because the DBMS did not sustain the target insert rate. Red backgrounds are not used when the minimum value is within 80% of the max value.
| dbms | l.i0 | l.x | l.i1 | q100.1 | q500.1 | q1000.1 |
|---|---|---|---|---|---|---|
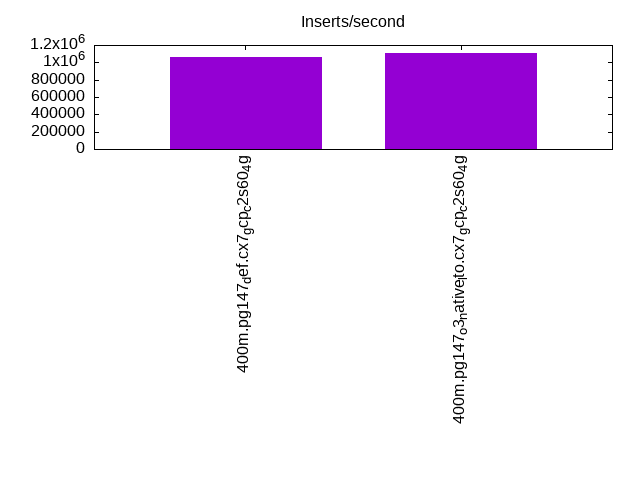
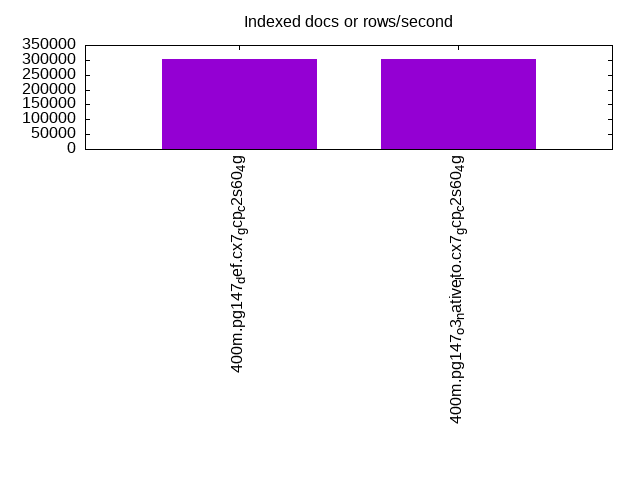
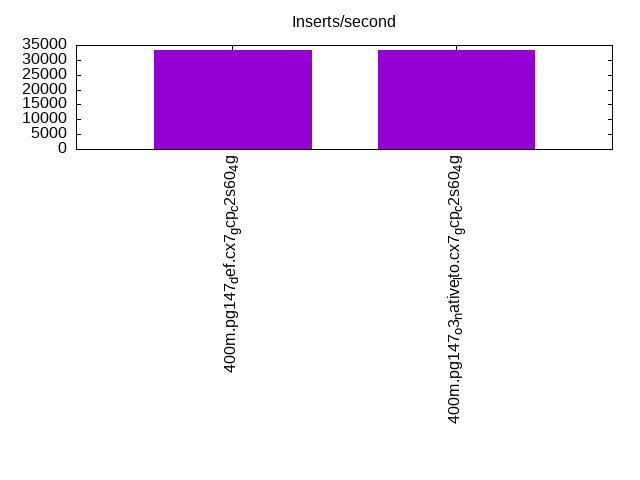
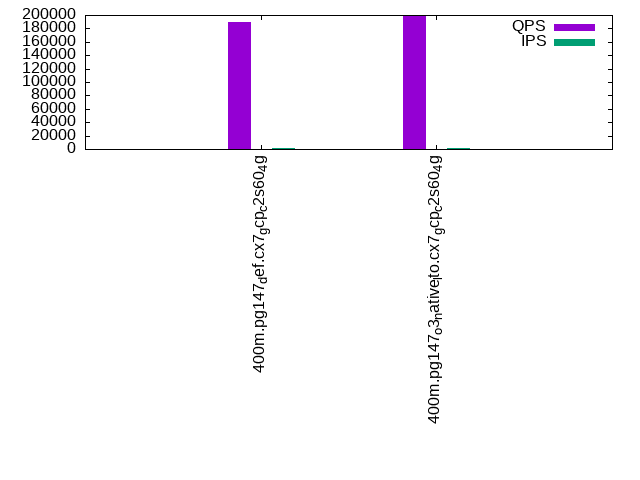
| 400m.pg147_def.cx7_gcp_c2s60_4g | 1063830 | 302877 | 33200 | 189076 | 190828 | 217548 |
| 400m.pg147_o3_native_lto.cx7_gcp_c2s60_4g | 1108033 | 302648 | 33428 | 199166 | 200818 | 232711 |
This lists the average rate of inserts/s for the tests that do inserts concurrent with queries. For such tests the query rate is listed in the table above. The read+write tests are setup so that the insert rate should match the target rate every second. Cells that are not at least 95% of the target have a red background to indicate a failure to satisfy the target.
| dbms | q100.1 | q500.1 | q1000.1 |
|---|---|---|---|
| pg147_def.cx7_gcp_c2s60_4g | 1976 | 9885 | 19661 |
| pg147_o3_native_lto.cx7_gcp_c2s60_4g | 1976 | 9885 | 19694 |
| target | 2000 | 10000 | 20000 |
l.i0
l.i0: load without secondary indexes. Graphs for performance per 1-second interval are here.
Average throughput:
Insert response time histogram: each cell has the percentage of responses that take <= the time in the header and max is the max response time in seconds. For the max column values in the top 25% of the range have a red background and in the bottom 25% of the range have a green background. The red background is not used when the min value is within 80% of the max value.
| dbms | 256us | 1ms | 4ms | 16ms | 64ms | 256ms | 1s | 4s | 16s | gt | max |
|---|---|---|---|---|---|---|---|---|---|---|---|
| pg147_def.cx7_gcp_c2s60_4g | 16.575 | 80.380 | 2.986 | 0.017 | 0.021 | 0.021 | 0.834 | ||||
| pg147_o3_native_lto.cx7_gcp_c2s60_4g | 26.313 | 70.766 | 2.854 | 0.024 | 0.024 | 0.018 | 0.756 |
Performance metrics for the DBMS listed above. Some are normalized by throughput, others are not. Legend for results is here.
ips	qps	rps	rmbps	wps	wmbps	rpq	rkbpq	wpi	wkbpi	csps	cpups	cspq	cpupq	dbgb1	dbgb2	rss	maxop	p50	p99	tag
1063830	0	130	3.6	2086.8	448.8	0.000	0.003	0.002	0.432	298079	57.4	0.280	16	43.0	112.7	NA	0.834	59434	9289	400m.pg147_def.cx7_gcp_c2s60_4g
1108033	0	206	4.4	2265.0	469.1	0.000	0.004	0.002	0.433	313624	57.1	0.283	15	43.0	112.4	NA	0.756	62041	8990	400m.pg147_o3_native_lto.cx7_gcp_c2s60_4g
l.x
l.x: create secondary indexes.
Average throughput:
Performance metrics for the DBMS listed above. Some are normalized by throughput, others are not. Legend for results is here.
ips	qps	rps	rmbps	wps	wmbps	rpq	rkbpq	wpi	wkbpi	csps	cpups	cspq	cpupq	dbgb1	dbgb2	rss	maxop	p50	p99	tag
302877	0	1940	41.3	456.8	110.4	0.006	0.140	0.002	0.373	1762	3.3	0.006	3	78.3	161.7	0.0	0.002	NA	NA	400m.pg147_def.cx7_gcp_c2s60_4g
302648	0	2093	41.7	478.4	110.0	0.007	0.141	0.002	0.372	1833	3.4	0.006	3	78.3	162.6	0.0	0.002	NA	NA	400m.pg147_o3_native_lto.cx7_gcp_c2s60_4g
l.i1
l.i1: continue load after secondary indexes created. Graphs for performance per 1-second interval are here.
Average throughput:
Insert response time histogram: each cell has the percentage of responses that take <= the time in the header and max is the max response time in seconds. For the max column values in the top 25% of the range have a red background and in the bottom 25% of the range have a green background. The red background is not used when the min value is within 80% of the max value.
| dbms | 256us | 1ms | 4ms | 16ms | 64ms | 256ms | 1s | 4s | 16s | gt | max |
|---|---|---|---|---|---|---|---|---|---|---|---|
| pg147_def.cx7_gcp_c2s60_4g | 0.046 | 5.741 | 88.746 | 5.464 | 0.002 | 0.623 | |||||
| pg147_o3_native_lto.cx7_gcp_c2s60_4g | 0.056 | 5.848 | 88.743 | 5.351 | 0.002 | 0.430 |
Performance metrics for the DBMS listed above. Some are normalized by throughput, others are not. Legend for results is here.
ips	qps	rps	rmbps	wps	wmbps	rpq	rkbpq	wpi	wkbpi	csps	cpups	cspq	cpupq	dbgb1	dbgb2	rss	maxop	p50	p99	tag
33200	0	71917	664.8	60456.4	579.9	2.166	20.504	1.821	17.884	128363	12.8	3.866	116	170.2	252.8	0.0	0.623	1698	700	400m.pg147_def.cx7_gcp_c2s60_4g
33428	0	71455	661.7	60900.2	583.5	2.138	20.270	1.822	17.874	129296	12.5	3.868	112	170.2	251.4	0.0	0.430	1698	749	400m.pg147_o3_native_lto.cx7_gcp_c2s60_4g
q100.1
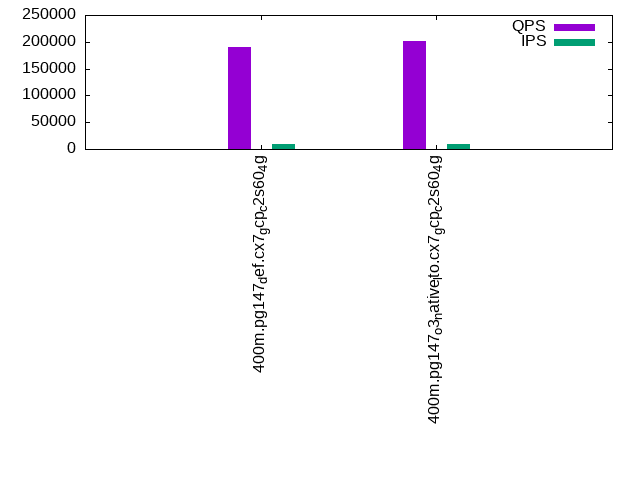
q100.1: range queries with 100 insert/s per client. Graphs for performance per 1-second interval are here.
Average throughput:
Query response time histogram: each cell has the percentage of responses that take <= the time in the header and max is the max response time in seconds. For max values in the top 25% of the range have a red background and in the bottom 25% of the range have a green background. The red background is not used when the min value is within 80% of the max value.
| dbms | 256us | 1ms | 4ms | 16ms | 64ms | 256ms | 1s | 4s | 16s | gt | max |
|---|---|---|---|---|---|---|---|---|---|---|---|
| pg147_def.cx7_gcp_c2s60_4g | 99.905 | 0.092 | 0.002 | 0.001 | nonzero | 0.037 | |||||
| pg147_o3_native_lto.cx7_gcp_c2s60_4g | 99.926 | 0.071 | 0.002 | 0.001 | nonzero | 0.029 |
Insert response time histogram: each cell has the percentage of responses that take <= the time in the header and max is the max response time in seconds. For max values in the top 25% of the range have a red background and in the bottom 25% of the range have a green background. The red background is not used when the min value is within 80% of the max value.
| dbms | 256us | 1ms | 4ms | 16ms | 64ms | 256ms | 1s | 4s | 16s | gt | max |
|---|---|---|---|---|---|---|---|---|---|---|---|
| pg147_def.cx7_gcp_c2s60_4g | 0.544 | 99.449 | 0.007 | 0.375 | |||||||
| pg147_o3_native_lto.cx7_gcp_c2s60_4g | 0.696 | 99.207 | 0.097 | 0.252 |
Performance metrics for the DBMS listed above. Some are normalized by throughput, others are not. Legend for results is here.
ips	qps	rps	rmbps	wps	wmbps	rpq	rkbpq	wpi	wkbpi	csps	cpups	cspq	cpupq	dbgb1	dbgb2	rss	maxop	p50	p99	tag
1976	189076	3847	39.3	4134.2	51.8	0.020	0.213	2.092	26.840	677004	63.2	3.581	100	171.1	232.6	0.0	0.037	9461	9050	400m.pg147_def.cx7_gcp_c2s60_4g
1976	199166	3752	38.3	4123.0	50.7	0.019	0.197	2.087	26.268	711014	62.6	3.570	94	171.1	232.3	0.0	0.029	9925	9541	400m.pg147_o3_native_lto.cx7_gcp_c2s60_4g
q500.1
q500.1: range queries with 500 insert/s per client. Graphs for performance per 1-second interval are here.
Average throughput:
Query response time histogram: each cell has the percentage of responses that take <= the time in the header and max is the max response time in seconds. For max values in the top 25% of the range have a red background and in the bottom 25% of the range have a green background. The red background is not used when the min value is within 80% of the max value.
| dbms | 256us | 1ms | 4ms | 16ms | 64ms | 256ms | 1s | 4s | 16s | gt | max |
|---|---|---|---|---|---|---|---|---|---|---|---|
| pg147_def.cx7_gcp_c2s60_4g | 99.643 | 0.345 | 0.012 | 0.001 | nonzero | 0.029 | |||||
| pg147_o3_native_lto.cx7_gcp_c2s60_4g | 99.703 | 0.285 | 0.011 | 0.001 | nonzero | 0.028 |
Insert response time histogram: each cell has the percentage of responses that take <= the time in the header and max is the max response time in seconds. For max values in the top 25% of the range have a red background and in the bottom 25% of the range have a green background. The red background is not used when the min value is within 80% of the max value.
| dbms | 256us | 1ms | 4ms | 16ms | 64ms | 256ms | 1s | 4s | 16s | gt | max |
|---|---|---|---|---|---|---|---|---|---|---|---|
| pg147_def.cx7_gcp_c2s60_4g | 0.584 | 99.401 | 0.015 | 0.108 | |||||||
| pg147_o3_native_lto.cx7_gcp_c2s60_4g | 0.838 | 99.131 | 0.029 | 0.002 | 0.272 |
Performance metrics for the DBMS listed above. Some are normalized by throughput, others are not. Legend for results is here.
ips	qps	rps	rmbps	wps	wmbps	rpq	rkbpq	wpi	wkbpi	csps	cpups	cspq	cpupq	dbgb1	dbgb2	rss	maxop	p50	p99	tag
9885	190828	17705	184.2	19533.1	208.6	0.093	0.988	1.976	21.613	662907	65.7	3.474	103	176.0	232.1	0.0	0.029	9477	8902	400m.pg147_def.cx7_gcp_c2s60_4g
9885	200818	17715	184.1	19528.4	208.1	0.088	0.939	1.976	21.558	695673	65.4	3.464	98	176.0	229.6	0.0	0.028	9989	9334	400m.pg147_o3_native_lto.cx7_gcp_c2s60_4g
q1000.1
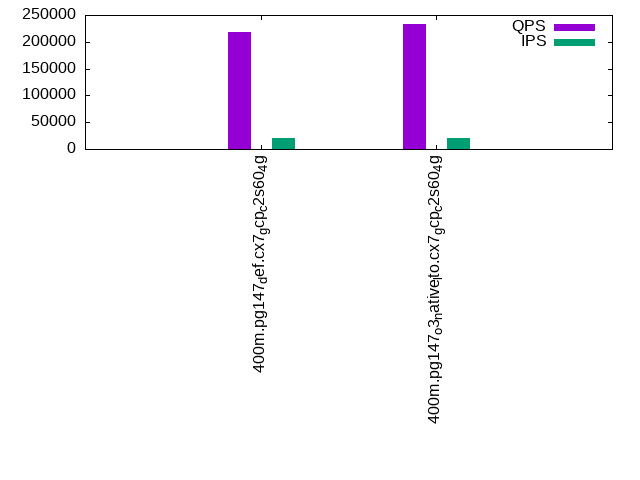
q1000.1: range queries with 1000 insert/s per client. Graphs for performance per 1-second interval are here.
Average throughput:
Query response time histogram: each cell has the percentage of responses that take <= the time in the header and max is the max response time in seconds. For max values in the top 25% of the range have a red background and in the bottom 25% of the range have a green background. The red background is not used when the min value is within 80% of the max value.
| dbms | 256us | 1ms | 4ms | 16ms | 64ms | 256ms | 1s | 4s | 16s | gt | max |
|---|---|---|---|---|---|---|---|---|---|---|---|
| pg147_def.cx7_gcp_c2s60_4g | 99.432 | 0.547 | 0.020 | 0.001 | nonzero | 0.035 | |||||
| pg147_o3_native_lto.cx7_gcp_c2s60_4g | 99.512 | 0.469 | 0.018 | 0.001 | nonzero | nonzero | 0.071 |
Insert response time histogram: each cell has the percentage of responses that take <= the time in the header and max is the max response time in seconds. For max values in the top 25% of the range have a red background and in the bottom 25% of the range have a green background. The red background is not used when the min value is within 80% of the max value.
| dbms | 256us | 1ms | 4ms | 16ms | 64ms | 256ms | 1s | 4s | 16s | gt | max |
|---|---|---|---|---|---|---|---|---|---|---|---|
| pg147_def.cx7_gcp_c2s60_4g | 1.637 | 93.228 | 5.131 | 0.003 | 0.589 | ||||||
| pg147_o3_native_lto.cx7_gcp_c2s60_4g | 1.926 | 92.982 | 5.093 | nonzero | 0.262 |
Performance metrics for the DBMS listed above. Some are normalized by throughput, others are not. Legend for results is here.
ips	qps	rps	rmbps	wps	wmbps	rpq	rkbpq	wpi	wkbpi	csps	cpups	cspq	cpupq	dbgb1	dbgb2	rss	maxop	p50	p99	tag
19661	217548	37955	384.4	37263.8	391.6	0.174	1.809	1.895	20.397	676672	69.7	3.110	96	189.4	261.2	0.0	0.035	10804	8186	400m.pg147_def.cx7_gcp_c2s60_4g
19694	232711	38338	387.6	37374.9	392.0	0.165	1.705	1.898	20.380	718097	69.7	3.086	90	189.4	261.3	0.0	0.071	11427	8420	400m.pg147_o3_native_lto.cx7_gcp_c2s60_4g
l.i0
l.i0: load without secondary indexes
Performance metrics for all DBMS, not just the ones listed above. Some are normalized by throughput, others are not. Legend for results is here.
ips	qps	rps	rmbps	wps	wmbps	rpq	rkbpq	wpi	wkbpi	csps	cpups	cspq	cpupq	dbgb1	dbgb2	rss	maxop	p50	p99	tag
1063830	0	130	3.6	2086.8	448.8	0.000	0.003	0.002	0.432	298079	57.4	0.280	16	43.0	112.7	NA	0.834	59434	9289	400m.pg147_def.cx7_gcp_c2s60_4g
1108033	0	206	4.4	2265.0	469.1	0.000	0.004	0.002	0.433	313624	57.1	0.283	15	43.0	112.4	NA	0.756	62041	8990	400m.pg147_o3_native_lto.cx7_gcp_c2s60_4g
l.x
l.x: create secondary indexes
Performance metrics for all DBMS, not just the ones listed above. Some are normalized by throughput, others are not. Legend for results is here.
ips	qps	rps	rmbps	wps	wmbps	rpq	rkbpq	wpi	wkbpi	csps	cpups	cspq	cpupq	dbgb1	dbgb2	rss	maxop	p50	p99	tag
302877	0	1940	41.3	456.8	110.4	0.006	0.140	0.002	0.373	1762	3.3	0.006	3	78.3	161.7	0.0	0.002	NA	NA	400m.pg147_def.cx7_gcp_c2s60_4g
302648	0	2093	41.7	478.4	110.0	0.007	0.141	0.002	0.372	1833	3.4	0.006	3	78.3	162.6	0.0	0.002	NA	NA	400m.pg147_o3_native_lto.cx7_gcp_c2s60_4g
l.i1
l.i1: continue load after secondary indexes created
Performance metrics for all DBMS, not just the ones listed above. Some are normalized by throughput, others are not. Legend for results is here.
ips	qps	rps	rmbps	wps	wmbps	rpq	rkbpq	wpi	wkbpi	csps	cpups	cspq	cpupq	dbgb1	dbgb2	rss	maxop	p50	p99	tag
33200	0	71917	664.8	60456.4	579.9	2.166	20.504	1.821	17.884	128363	12.8	3.866	116	170.2	252.8	0.0	0.623	1698	700	400m.pg147_def.cx7_gcp_c2s60_4g
33428	0	71455	661.7	60900.2	583.5	2.138	20.270	1.822	17.874	129296	12.5	3.868	112	170.2	251.4	0.0	0.430	1698	749	400m.pg147_o3_native_lto.cx7_gcp_c2s60_4g
q100.1
q100.1: range queries with 100 insert/s per client
Performance metrics for all DBMS, not just the ones listed above. Some are normalized by throughput, others are not. Legend for results is here.
ips	qps	rps	rmbps	wps	wmbps	rpq	rkbpq	wpi	wkbpi	csps	cpups	cspq	cpupq	dbgb1	dbgb2	rss	maxop	p50	p99	tag
1976	189076	3847	39.3	4134.2	51.8	0.020	0.213	2.092	26.840	677004	63.2	3.581	100	171.1	232.6	0.0	0.037	9461	9050	400m.pg147_def.cx7_gcp_c2s60_4g
1976	199166	3752	38.3	4123.0	50.7	0.019	0.197	2.087	26.268	711014	62.6	3.570	94	171.1	232.3	0.0	0.029	9925	9541	400m.pg147_o3_native_lto.cx7_gcp_c2s60_4g
q500.1
q500.1: range queries with 500 insert/s per client
Performance metrics for all DBMS, not just the ones listed above. Some are normalized by throughput, others are not. Legend for results is here.
ips	qps	rps	rmbps	wps	wmbps	rpq	rkbpq	wpi	wkbpi	csps	cpups	cspq	cpupq	dbgb1	dbgb2	rss	maxop	p50	p99	tag
9885	190828	17705	184.2	19533.1	208.6	0.093	0.988	1.976	21.613	662907	65.7	3.474	103	176.0	232.1	0.0	0.029	9477	8902	400m.pg147_def.cx7_gcp_c2s60_4g
9885	200818	17715	184.1	19528.4	208.1	0.088	0.939	1.976	21.558	695673	65.4	3.464	98	176.0	229.6	0.0	0.028	9989	9334	400m.pg147_o3_native_lto.cx7_gcp_c2s60_4g
q1000.1
q1000.1: range queries with 1000 insert/s per client
Performance metrics for all DBMS, not just the ones listed above. Some are normalized by throughput, others are not. Legend for results is here.
ips	qps	rps	rmbps	wps	wmbps	rpq	rkbpq	wpi	wkbpi	csps	cpups	cspq	cpupq	dbgb1	dbgb2	rss	maxop	p50	p99	tag
19661	217548	37955	384.4	37263.8	391.6	0.174	1.809	1.895	20.397	676672	69.7	3.110	96	189.4	261.2	0.0	0.035	10804	8186	400m.pg147_def.cx7_gcp_c2s60_4g
19694	232711	38338	387.6	37374.9	392.0	0.165	1.705	1.898	20.380	718097	69.7	3.086	90	189.4	261.3	0.0	0.071	11427	8420	400m.pg147_o3_native_lto.cx7_gcp_c2s60_4g
l.i0
- l.i0: load without secondary indexes
- Legend for results is here.
- Each entry lists the percentage of responses that fit in that bucket (slower than max time for previous bucket, faster than min time for next bucket).
Insert response time histogram
256us	1ms	4ms	16ms	64ms	256ms	1s	4s	16s	gt	max	tag
0.000	16.575	80.380	2.986	0.017	0.021	0.021	0.000	0.000	0.000	0.834	pg147_def.cx7_gcp_c2s60_4g
0.000	26.313	70.766	2.854	0.024	0.024	0.018	0.000	0.000	0.000	0.756	pg147_o3_native_lto.cx7_gcp_c2s60_4g
l.x
- l.x: create secondary indexes
- Legend for results is here.
- Each entry lists the percentage of responses that fit in that bucket (slower than max time for previous bucket, faster than min time for next bucket).
TODO - determine whether there is data for create index response time
l.i1
- l.i1: continue load after secondary indexes created
- Legend for results is here.
- Each entry lists the percentage of responses that fit in that bucket (slower than max time for previous bucket, faster than min time for next bucket).
Insert response time histogram
256us	1ms	4ms	16ms	64ms	256ms	1s	4s	16s	gt	max	tag
0.000	0.000	0.046	5.741	88.746	5.464	0.002	0.000	0.000	0.000	0.623	pg147_def.cx7_gcp_c2s60_4g
0.000	0.000	0.056	5.848	88.743	5.351	0.002	0.000	0.000	0.000	0.430	pg147_o3_native_lto.cx7_gcp_c2s60_4g
q100.1
- q100.1: range queries with 100 insert/s per client
- Legend for results is here.
- Each entry lists the percentage of responses that fit in that bucket (slower than max time for previous bucket, faster than min time for next bucket).
Query response time histogram
256us	1ms	4ms	16ms	64ms	256ms	1s	4s	16s	gt	max	tag
99.905	0.092	0.002	0.001	nonzero	0.000	0.000	0.000	0.000	0.000	0.037	pg147_def.cx7_gcp_c2s60_4g
99.926	0.071	0.002	0.001	nonzero	0.000	0.000	0.000	0.000	0.000	0.029	pg147_o3_native_lto.cx7_gcp_c2s60_4g
Insert response time histogram
256us	1ms	4ms	16ms	64ms	256ms	1s	4s	16s	gt	max	tag
0.000	0.000	0.000	0.544	99.449	0.000	0.007	0.000	0.000	0.000	0.375	pg147_def.cx7_gcp_c2s60_4g
0.000	0.000	0.000	0.696	99.207	0.097	0.000	0.000	0.000	0.000	0.252	pg147_o3_native_lto.cx7_gcp_c2s60_4g
q500.1
- q500.1: range queries with 500 insert/s per client
- Legend for results is here.
- Each entry lists the percentage of responses that fit in that bucket (slower than max time for previous bucket, faster than min time for next bucket).
Query response time histogram
256us	1ms	4ms	16ms	64ms	256ms	1s	4s	16s	gt	max	tag
99.643	0.345	0.012	0.001	nonzero	0.000	0.000	0.000	0.000	0.000	0.029	pg147_def.cx7_gcp_c2s60_4g
99.703	0.285	0.011	0.001	nonzero	0.000	0.000	0.000	0.000	0.000	0.028	pg147_o3_native_lto.cx7_gcp_c2s60_4g
Insert response time histogram
256us	1ms	4ms	16ms	64ms	256ms	1s	4s	16s	gt	max	tag
0.000	0.000	0.000	0.584	99.401	0.015	0.000	0.000	0.000	0.000	0.108	pg147_def.cx7_gcp_c2s60_4g
0.000	0.000	0.000	0.838	99.131	0.029	0.002	0.000	0.000	0.000	0.272	pg147_o3_native_lto.cx7_gcp_c2s60_4g
q1000.1
- q1000.1: range queries with 1000 insert/s per client
- Legend for results is here.
- Each entry lists the percentage of responses that fit in that bucket (slower than max time for previous bucket, faster than min time for next bucket).
Query response time histogram
256us	1ms	4ms	16ms	64ms	256ms	1s	4s	16s	gt	max	tag
99.432	0.547	0.020	0.001	nonzero	0.000	0.000	0.000	0.000	0.000	0.035	pg147_def.cx7_gcp_c2s60_4g
99.512	0.469	0.018	0.001	nonzero	nonzero	0.000	0.000	0.000	0.000	0.071	pg147_o3_native_lto.cx7_gcp_c2s60_4g
Insert response time histogram
256us	1ms	4ms	16ms	64ms	256ms	1s	4s	16s	gt	max	tag
0.000	0.000	0.000	1.637	93.228	5.131	0.003	0.000	0.000	0.000	0.589	pg147_def.cx7_gcp_c2s60_4g
0.000	0.000	0.000	1.926	92.982	5.093	nonzero	0.000	0.000	0.000	0.262	pg147_o3_native_lto.cx7_gcp_c2s60_4g