Introduction
This is a report for the insert benchmark with 400M docs and 20 client(s). It is generated by scripts (bash, awk, sed) and Tufte might not be impressed. An overview of the insert benchmark is here and a short update is here. Below, by DBMS, I mean DBMS+version.config. An example is my8020.c10b40 where my means MySQL, 8020 is version 8.0.20 and c10b40 is the name for the configuration file.
The test server is a c2-standard-60 from GCP with 30 cores, hyperthreading disabled, 240G RAM and 3T from XFS and SW RAID 0 striped over 8 local NVMe drives. The benchmark was run with 20 clients and there were 1 or 2 connections per client (1 for queries, 1 for inserts). The benchmark loads 400M rows without secondary indexes, creates secondary indexes, loads another 400M rows then does 3 read+write tests for one hour each that do queries as fast as possible with 100, 500 and then 1000 writes/second/client concurrent with the queries. Each read-write test runs for 1800 seconds. The test was configured to use a table per client. The database is cached by the storage engine and the only IO is for writes. Clients and the DBMS share one server. The per-database configs are in the per-database subdirectories here.
The tested DBMS are:
- pg147_def.cx7_gcp_c2s60 - Postgres 14.7, the cx7_gcp_c2s60 config and a default build that used -O2
- pg147_o3_native_lto.cx7_gcp_c2s60 - Postgres 14.7, the cx7_gcp_c2s60 config and a build that uses -O3 -march=native -mtune=native -flto (link-time optimization)
Contents
- Summary
- l.i0: load without secondary indexes
- l.x: create secondary indexes
- l.i1: continue load after secondary indexes created
- q100.1: range queries with 100 insert/s per client
- q500.1: range queries with 500 insert/s per client
- q1000.1: range queries with 1000 insert/s per client
Summary
The numbers are inserts/s for l.i0 and l.i1, indexed docs (or rows) /s for l.x and queries/s for q*.2. The values are the average rate over the entire test for inserts (IPS) and queries (QPS). The range of values for IPS and QPS is split into 3 parts: bottom 25%, middle 50%, top 25%. Values in the bottom 25% have a red background, values in the top 25% have a green background and values in the middle have no color. A gray background is used for values that can be ignored because the DBMS did not sustain the target insert rate. Red backgrounds are not used when the minimum value is within 80% of the max value.
| dbms | l.i0 | l.x | l.i1 | q100.1 | q500.1 | q1000.1 |
|---|---|---|---|---|---|---|
| 400m.pg147_def.cx7_gcp_c2s60 | 1337793 | 2721769 | 403226 | 192638 | 194477 | 197417 |
| 400m.pg147_o3_native_lto.cx7_gcp_c2s60 | 1393728 | 2721769 | 413223 | 199384 | 201572 | 205260 |
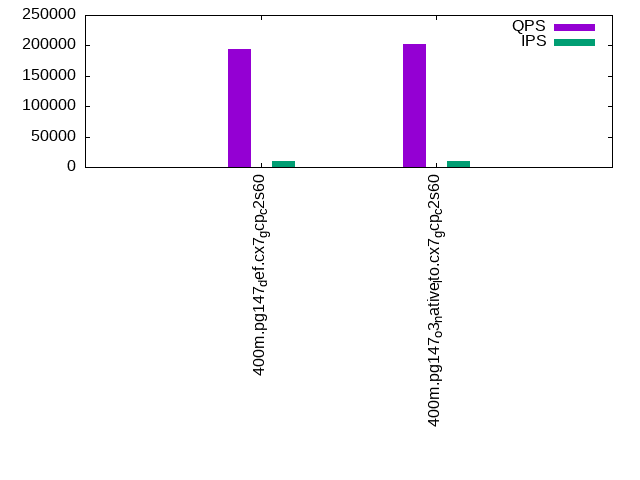
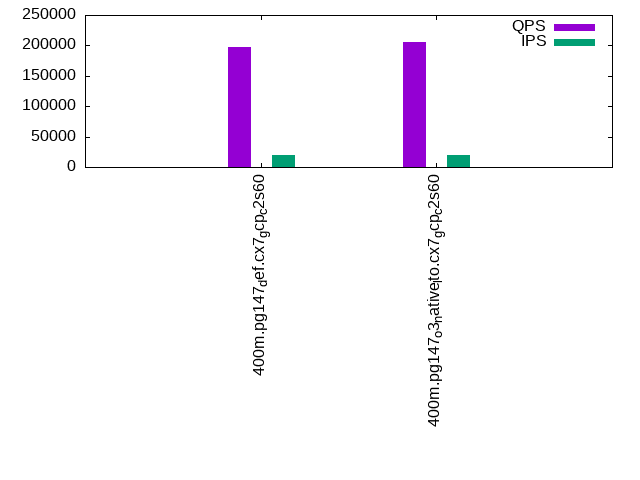
This lists the average rate of inserts/s for the tests that do inserts concurrent with queries. For such tests the query rate is listed in the table above. The read+write tests are setup so that the insert rate should match the target rate every second. Cells that are not at least 95% of the target have a red background to indicate a failure to satisfy the target.
| dbms | q100.1 | q500.1 | q1000.1 |
|---|---|---|---|
| pg147_def.cx7_gcp_c2s60 | 1976 | 9885 | 19769 |
| pg147_o3_native_lto.cx7_gcp_c2s60 | 1976 | 9885 | 19769 |
| target | 2000 | 10000 | 20000 |
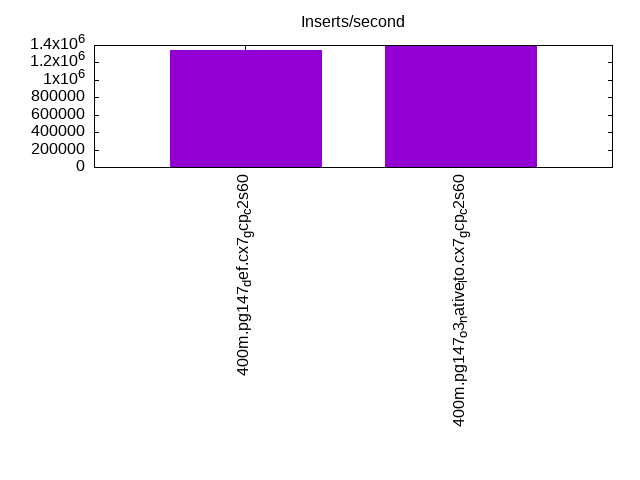
l.i0
l.i0: load without secondary indexes. Graphs for performance per 1-second interval are here.
Average throughput:
Insert response time histogram: each cell has the percentage of responses that take <= the time in the header and max is the max response time in seconds. For the max column values in the top 25% of the range have a red background and in the bottom 25% of the range have a green background. The red background is not used when the min value is within 80% of the max value.
| dbms | 256us | 1ms | 4ms | 16ms | 64ms | 256ms | 1s | 4s | 16s | gt | max |
|---|---|---|---|---|---|---|---|---|---|---|---|
| pg147_def.cx7_gcp_c2s60 | 57.410 | 41.608 | 0.939 | 0.009 | 0.019 | 0.014 | 0.001 | 1.072 | |||
| pg147_o3_native_lto.cx7_gcp_c2s60 | 58.688 | 40.467 | 0.793 | 0.018 | 0.020 | 0.014 | 0.765 |
Performance metrics for the DBMS listed above. Some are normalized by throughput, others are not. Legend for results is here.
ips	qps	rps	rmbps	wps	wmbps	rpq	rkbpq	wpi	wkbpi	csps	cpups	cspq	cpupq	dbgb1	dbgb2	rss	maxop	p50	p99	tag
1337793	0	0	0.0	1741.9	442.7	0.000	0.000	0.001	0.339	225996	59.5	0.169	13	38.3	103.4	NA	1.072	76117	9490	400m.pg147_def.cx7_gcp_c2s60
1393728	0	0	0.0	1837.9	462.7	0.000	0.000	0.001	0.340	242816	59.7	0.174	13	38.3	103.4	NA	0.765	78315	9689	400m.pg147_o3_native_lto.cx7_gcp_c2s60
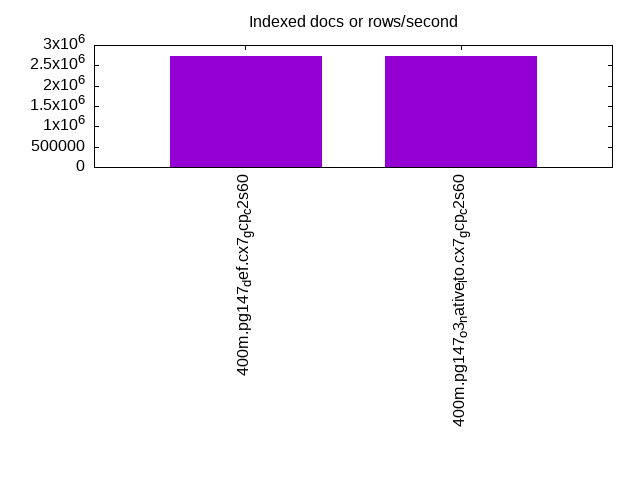
l.x
l.x: create secondary indexes.
Average throughput:
Performance metrics for the DBMS listed above. Some are normalized by throughput, others are not. Legend for results is here.
ips	qps	rps	rmbps	wps	wmbps	rpq	rkbpq	wpi	wkbpi	csps	cpups	cspq	cpupq	dbgb1	dbgb2	rss	maxop	p50	p99	tag
2721769	0	9809	103.5	3270.8	826.3	0.004	0.039	0.001	0.311	106770	26.8	0.039	3	73.5	171.7	0.0	0.181	NA	NA	400m.pg147_def.cx7_gcp_c2s60
2721769	0	5266	95.7	3202.6	801.5	0.002	0.036	0.001	0.302	106331	26.7	0.039	3	73.5	170.7	0.0	0.249	NA	NA	400m.pg147_o3_native_lto.cx7_gcp_c2s60
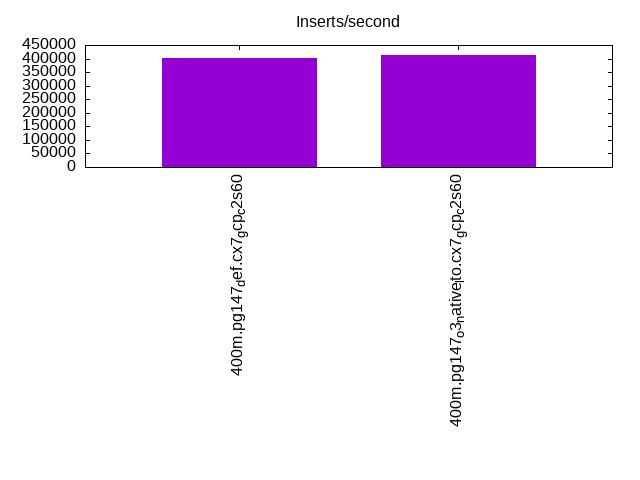
l.i1
l.i1: continue load after secondary indexes created. Graphs for performance per 1-second interval are here.
Average throughput:
Insert response time histogram: each cell has the percentage of responses that take <= the time in the header and max is the max response time in seconds. For the max column values in the top 25% of the range have a red background and in the bottom 25% of the range have a green background. The red background is not used when the min value is within 80% of the max value.
| dbms | 256us | 1ms | 4ms | 16ms | 64ms | 256ms | 1s | 4s | 16s | gt | max |
|---|---|---|---|---|---|---|---|---|---|---|---|
| pg147_def.cx7_gcp_c2s60 | 95.876 | 2.726 | 1.359 | 0.025 | 0.014 | 0.793 | |||||
| pg147_o3_native_lto.cx7_gcp_c2s60 | 0.003 | 96.045 | 2.557 | 1.354 | 0.029 | 0.012 | nonzero | 1.058 |
Performance metrics for the DBMS listed above. Some are normalized by throughput, others are not. Legend for results is here.
ips	qps	rps	rmbps	wps	wmbps	rpq	rkbpq	wpi	wkbpi	csps	cpups	cspq	cpupq	dbgb1	dbgb2	rss	maxop	p50	p99	tag
403226	0	5408	40.8	3378.2	520.4	0.013	0.104	0.008	1.322	300791	52.2	0.746	39	163.3	354.1	NA	0.793	25631	1749	400m.pg147_def.cx7_gcp_c2s60
413223	0	5169	46.3	3193.8	527.4	0.013	0.115	0.008	1.307	305777	51.6	0.740	37	163.3	354.9	0.0	1.058	26332	1798	400m.pg147_o3_native_lto.cx7_gcp_c2s60
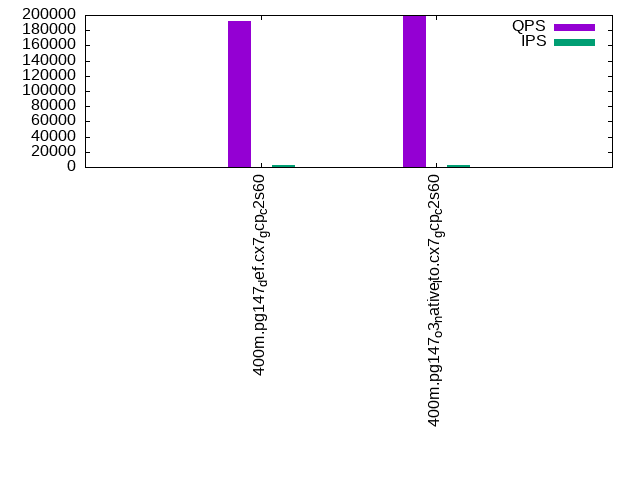
q100.1
q100.1: range queries with 100 insert/s per client. Graphs for performance per 1-second interval are here.
Average throughput:
Query response time histogram: each cell has the percentage of responses that take <= the time in the header and max is the max response time in seconds. For max values in the top 25% of the range have a red background and in the bottom 25% of the range have a green background. The red background is not used when the min value is within 80% of the max value.
| dbms | 256us | 1ms | 4ms | 16ms | 64ms | 256ms | 1s | 4s | 16s | gt | max |
|---|---|---|---|---|---|---|---|---|---|---|---|
| pg147_def.cx7_gcp_c2s60 | 99.973 | 0.020 | 0.006 | 0.001 | nonzero | 0.024 | |||||
| pg147_o3_native_lto.cx7_gcp_c2s60 | 99.976 | 0.017 | 0.006 | 0.001 | nonzero | 0.034 |
Insert response time histogram: each cell has the percentage of responses that take <= the time in the header and max is the max response time in seconds. For max values in the top 25% of the range have a red background and in the bottom 25% of the range have a green background. The red background is not used when the min value is within 80% of the max value.
| dbms | 256us | 1ms | 4ms | 16ms | 64ms | 256ms | 1s | 4s | 16s | gt | max |
|---|---|---|---|---|---|---|---|---|---|---|---|
| pg147_def.cx7_gcp_c2s60 | 97.910 | 1.831 | 0.260 | 0.040 | |||||||
| pg147_o3_native_lto.cx7_gcp_c2s60 | 95.801 | 3.460 | 0.729 | 0.010 | 0.080 |
Performance metrics for the DBMS listed above. Some are normalized by throughput, others are not. Legend for results is here.
ips	qps	rps	rmbps	wps	wmbps	rpq	rkbpq	wpi	wkbpi	csps	cpups	cspq	cpupq	dbgb1	dbgb2	rss	maxop	p50	p99	tag
1976	192638	0	0.0	3523.7	83.8	0.000	0.000	1.783	43.406	687254	63.1	3.568	98	163.9	311.9	0.0	0.024	9478	9174	400m.pg147_def.cx7_gcp_c2s60
1976	199384	0	0.0	3561.0	85.1	0.000	0.000	1.802	44.107	710578	62.6	3.564	94	163.9	323.4	0.0	0.034	9909	9509	400m.pg147_o3_native_lto.cx7_gcp_c2s60
q500.1
q500.1: range queries with 500 insert/s per client. Graphs for performance per 1-second interval are here.
Average throughput:
Query response time histogram: each cell has the percentage of responses that take <= the time in the header and max is the max response time in seconds. For max values in the top 25% of the range have a red background and in the bottom 25% of the range have a green background. The red background is not used when the min value is within 80% of the max value.
| dbms | 256us | 1ms | 4ms | 16ms | 64ms | 256ms | 1s | 4s | 16s | gt | max |
|---|---|---|---|---|---|---|---|---|---|---|---|
| pg147_def.cx7_gcp_c2s60 | 99.910 | 0.057 | 0.029 | 0.004 | nonzero | 0.057 | |||||
| pg147_o3_native_lto.cx7_gcp_c2s60 | 99.915 | 0.053 | 0.028 | 0.004 | nonzero | 0.059 |
Insert response time histogram: each cell has the percentage of responses that take <= the time in the header and max is the max response time in seconds. For max values in the top 25% of the range have a red background and in the bottom 25% of the range have a green background. The red background is not used when the min value is within 80% of the max value.
| dbms | 256us | 1ms | 4ms | 16ms | 64ms | 256ms | 1s | 4s | 16s | gt | max |
|---|---|---|---|---|---|---|---|---|---|---|---|
| pg147_def.cx7_gcp_c2s60 | 45.647 | 24.976 | 28.163 | 1.214 | 0.184 | ||||||
| pg147_o3_native_lto.cx7_gcp_c2s60 | 44.914 | 24.447 | 29.331 | 1.308 | 0.207 |
Performance metrics for the DBMS listed above. Some are normalized by throughput, others are not. Legend for results is here.
ips	qps	rps	rmbps	wps	wmbps	rpq	rkbpq	wpi	wkbpi	csps	cpups	cspq	cpupq	dbgb1	dbgb2	rss	maxop	p50	p99	tag
9885	194477	0	0.0	6144.0	193.7	0.000	0.000	0.622	20.063	679485	63.7	3.494	98	167.5	269.8	0.0	0.057	9561	9078	400m.pg147_def.cx7_gcp_c2s60
9885	201572	0	0.0	6390.1	196.8	0.000	0.000	0.646	20.389	705063	63.7	3.498	95	167.4	271.7	0.0	0.059	9989	9446	400m.pg147_o3_native_lto.cx7_gcp_c2s60
q1000.1
q1000.1: range queries with 1000 insert/s per client. Graphs for performance per 1-second interval are here.
Average throughput:
Query response time histogram: each cell has the percentage of responses that take <= the time in the header and max is the max response time in seconds. For max values in the top 25% of the range have a red background and in the bottom 25% of the range have a green background. The red background is not used when the min value is within 80% of the max value.
| dbms | 256us | 1ms | 4ms | 16ms | 64ms | 256ms | 1s | 4s | 16s | gt | max |
|---|---|---|---|---|---|---|---|---|---|---|---|
| pg147_def.cx7_gcp_c2s60 | 99.851 | 0.098 | 0.042 | 0.008 | 0.001 | nonzero | 0.088 | ||||
| pg147_o3_native_lto.cx7_gcp_c2s60 | 99.860 | 0.092 | 0.041 | 0.007 | nonzero | nonzero | 0.086 |
Insert response time histogram: each cell has the percentage of responses that take <= the time in the header and max is the max response time in seconds. For max values in the top 25% of the range have a red background and in the bottom 25% of the range have a green background. The red background is not used when the min value is within 80% of the max value.
| dbms | 256us | 1ms | 4ms | 16ms | 64ms | 256ms | 1s | 4s | 16s | gt | max |
|---|---|---|---|---|---|---|---|---|---|---|---|
| pg147_def.cx7_gcp_c2s60 | 57.846 | 21.955 | 19.271 | 0.928 | 0.249 | ||||||
| pg147_o3_native_lto.cx7_gcp_c2s60 | 58.709 | 21.450 | 18.923 | 0.918 | 0.218 |
Performance metrics for the DBMS listed above. Some are normalized by throughput, others are not. Legend for results is here.
ips	qps	rps	rmbps	wps	wmbps	rpq	rkbpq	wpi	wkbpi	csps	cpups	cspq	cpupq	dbgb1	dbgb2	rss	maxop	p50	p99	tag
19769	197417	0	0.0	6345.8	270.4	0.000	0.000	0.321	14.009	669807	65.2	3.393	99	179.6	279.1	0.0	0.088	9813	8966	400m.pg147_def.cx7_gcp_c2s60
19769	205260	0	0.0	6299.3	265.5	0.000	0.000	0.319	13.751	697236	64.9	3.397	95	179.6	280.4	0.0	0.086	10216	9398	400m.pg147_o3_native_lto.cx7_gcp_c2s60
l.i0
l.i0: load without secondary indexes
Performance metrics for all DBMS, not just the ones listed above. Some are normalized by throughput, others are not. Legend for results is here.
ips	qps	rps	rmbps	wps	wmbps	rpq	rkbpq	wpi	wkbpi	csps	cpups	cspq	cpupq	dbgb1	dbgb2	rss	maxop	p50	p99	tag
1337793	0	0	0.0	1741.9	442.7	0.000	0.000	0.001	0.339	225996	59.5	0.169	13	38.3	103.4	NA	1.072	76117	9490	400m.pg147_def.cx7_gcp_c2s60
1393728	0	0	0.0	1837.9	462.7	0.000	0.000	0.001	0.340	242816	59.7	0.174	13	38.3	103.4	NA	0.765	78315	9689	400m.pg147_o3_native_lto.cx7_gcp_c2s60
l.x
l.x: create secondary indexes
Performance metrics for all DBMS, not just the ones listed above. Some are normalized by throughput, others are not. Legend for results is here.
ips	qps	rps	rmbps	wps	wmbps	rpq	rkbpq	wpi	wkbpi	csps	cpups	cspq	cpupq	dbgb1	dbgb2	rss	maxop	p50	p99	tag
2721769	0	9809	103.5	3270.8	826.3	0.004	0.039	0.001	0.311	106770	26.8	0.039	3	73.5	171.7	0.0	0.181	NA	NA	400m.pg147_def.cx7_gcp_c2s60
2721769	0	5266	95.7	3202.6	801.5	0.002	0.036	0.001	0.302	106331	26.7	0.039	3	73.5	170.7	0.0	0.249	NA	NA	400m.pg147_o3_native_lto.cx7_gcp_c2s60
l.i1
l.i1: continue load after secondary indexes created
Performance metrics for all DBMS, not just the ones listed above. Some are normalized by throughput, others are not. Legend for results is here.
ips	qps	rps	rmbps	wps	wmbps	rpq	rkbpq	wpi	wkbpi	csps	cpups	cspq	cpupq	dbgb1	dbgb2	rss	maxop	p50	p99	tag
403226	0	5408	40.8	3378.2	520.4	0.013	0.104	0.008	1.322	300791	52.2	0.746	39	163.3	354.1	NA	0.793	25631	1749	400m.pg147_def.cx7_gcp_c2s60
413223	0	5169	46.3	3193.8	527.4	0.013	0.115	0.008	1.307	305777	51.6	0.740	37	163.3	354.9	0.0	1.058	26332	1798	400m.pg147_o3_native_lto.cx7_gcp_c2s60
q100.1
q100.1: range queries with 100 insert/s per client
Performance metrics for all DBMS, not just the ones listed above. Some are normalized by throughput, others are not. Legend for results is here.
ips	qps	rps	rmbps	wps	wmbps	rpq	rkbpq	wpi	wkbpi	csps	cpups	cspq	cpupq	dbgb1	dbgb2	rss	maxop	p50	p99	tag
1976	192638	0	0.0	3523.7	83.8	0.000	0.000	1.783	43.406	687254	63.1	3.568	98	163.9	311.9	0.0	0.024	9478	9174	400m.pg147_def.cx7_gcp_c2s60
1976	199384	0	0.0	3561.0	85.1	0.000	0.000	1.802	44.107	710578	62.6	3.564	94	163.9	323.4	0.0	0.034	9909	9509	400m.pg147_o3_native_lto.cx7_gcp_c2s60
q500.1
q500.1: range queries with 500 insert/s per client
Performance metrics for all DBMS, not just the ones listed above. Some are normalized by throughput, others are not. Legend for results is here.
ips	qps	rps	rmbps	wps	wmbps	rpq	rkbpq	wpi	wkbpi	csps	cpups	cspq	cpupq	dbgb1	dbgb2	rss	maxop	p50	p99	tag
9885	194477	0	0.0	6144.0	193.7	0.000	0.000	0.622	20.063	679485	63.7	3.494	98	167.5	269.8	0.0	0.057	9561	9078	400m.pg147_def.cx7_gcp_c2s60
9885	201572	0	0.0	6390.1	196.8	0.000	0.000	0.646	20.389	705063	63.7	3.498	95	167.4	271.7	0.0	0.059	9989	9446	400m.pg147_o3_native_lto.cx7_gcp_c2s60
q1000.1
q1000.1: range queries with 1000 insert/s per client
Performance metrics for all DBMS, not just the ones listed above. Some are normalized by throughput, others are not. Legend for results is here.
ips	qps	rps	rmbps	wps	wmbps	rpq	rkbpq	wpi	wkbpi	csps	cpups	cspq	cpupq	dbgb1	dbgb2	rss	maxop	p50	p99	tag
19769	197417	0	0.0	6345.8	270.4	0.000	0.000	0.321	14.009	669807	65.2	3.393	99	179.6	279.1	0.0	0.088	9813	8966	400m.pg147_def.cx7_gcp_c2s60
19769	205260	0	0.0	6299.3	265.5	0.000	0.000	0.319	13.751	697236	64.9	3.397	95	179.6	280.4	0.0	0.086	10216	9398	400m.pg147_o3_native_lto.cx7_gcp_c2s60
l.i0
- l.i0: load without secondary indexes
- Legend for results is here.
- Each entry lists the percentage of responses that fit in that bucket (slower than max time for previous bucket, faster than min time for next bucket).
Insert response time histogram
256us	1ms	4ms	16ms	64ms	256ms	1s	4s	16s	gt	max	tag
0.000	57.410	41.608	0.939	0.009	0.019	0.014	0.001	0.000	0.000	1.072	pg147_def.cx7_gcp_c2s60
0.000	58.688	40.467	0.793	0.018	0.020	0.014	0.000	0.000	0.000	0.765	pg147_o3_native_lto.cx7_gcp_c2s60
l.x
- l.x: create secondary indexes
- Legend for results is here.
- Each entry lists the percentage of responses that fit in that bucket (slower than max time for previous bucket, faster than min time for next bucket).
TODO - determine whether there is data for create index response time
l.i1
- l.i1: continue load after secondary indexes created
- Legend for results is here.
- Each entry lists the percentage of responses that fit in that bucket (slower than max time for previous bucket, faster than min time for next bucket).
Insert response time histogram
256us	1ms	4ms	16ms	64ms	256ms	1s	4s	16s	gt	max	tag
0.000	0.000	95.876	2.726	1.359	0.025	0.014	0.000	0.000	0.000	0.793	pg147_def.cx7_gcp_c2s60
0.000	0.003	96.045	2.557	1.354	0.029	0.012	nonzero	0.000	0.000	1.058	pg147_o3_native_lto.cx7_gcp_c2s60
q100.1
- q100.1: range queries with 100 insert/s per client
- Legend for results is here.
- Each entry lists the percentage of responses that fit in that bucket (slower than max time for previous bucket, faster than min time for next bucket).
Query response time histogram
256us	1ms	4ms	16ms	64ms	256ms	1s	4s	16s	gt	max	tag
99.973	0.020	0.006	0.001	nonzero	0.000	0.000	0.000	0.000	0.000	0.024	pg147_def.cx7_gcp_c2s60
99.976	0.017	0.006	0.001	nonzero	0.000	0.000	0.000	0.000	0.000	0.034	pg147_o3_native_lto.cx7_gcp_c2s60
Insert response time histogram
256us	1ms	4ms	16ms	64ms	256ms	1s	4s	16s	gt	max	tag
0.000	0.000	97.910	1.831	0.260	0.000	0.000	0.000	0.000	0.000	0.040	pg147_def.cx7_gcp_c2s60
0.000	0.000	95.801	3.460	0.729	0.010	0.000	0.000	0.000	0.000	0.080	pg147_o3_native_lto.cx7_gcp_c2s60
q500.1
- q500.1: range queries with 500 insert/s per client
- Legend for results is here.
- Each entry lists the percentage of responses that fit in that bucket (slower than max time for previous bucket, faster than min time for next bucket).
Query response time histogram
256us	1ms	4ms	16ms	64ms	256ms	1s	4s	16s	gt	max	tag
99.910	0.057	0.029	0.004	nonzero	0.000	0.000	0.000	0.000	0.000	0.057	pg147_def.cx7_gcp_c2s60
99.915	0.053	0.028	0.004	nonzero	0.000	0.000	0.000	0.000	0.000	0.059	pg147_o3_native_lto.cx7_gcp_c2s60
Insert response time histogram
256us	1ms	4ms	16ms	64ms	256ms	1s	4s	16s	gt	max	tag
0.000	0.000	45.647	24.976	28.163	1.214	0.000	0.000	0.000	0.000	0.184	pg147_def.cx7_gcp_c2s60
0.000	0.000	44.914	24.447	29.331	1.308	0.000	0.000	0.000	0.000	0.207	pg147_o3_native_lto.cx7_gcp_c2s60
q1000.1
- q1000.1: range queries with 1000 insert/s per client
- Legend for results is here.
- Each entry lists the percentage of responses that fit in that bucket (slower than max time for previous bucket, faster than min time for next bucket).
Query response time histogram
256us	1ms	4ms	16ms	64ms	256ms	1s	4s	16s	gt	max	tag
99.851	0.098	0.042	0.008	0.001	nonzero	0.000	0.000	0.000	0.000	0.088	pg147_def.cx7_gcp_c2s60
99.860	0.092	0.041	0.007	nonzero	nonzero	0.000	0.000	0.000	0.000	0.086	pg147_o3_native_lto.cx7_gcp_c2s60
Insert response time histogram
256us	1ms	4ms	16ms	64ms	256ms	1s	4s	16s	gt	max	tag
0.000	0.000	57.846	21.955	19.271	0.928	0.000	0.000	0.000	0.000	0.249	pg147_def.cx7_gcp_c2s60
0.000	0.000	58.709	21.450	18.923	0.918	0.000	0.000	0.000	0.000	0.218	pg147_o3_native_lto.cx7_gcp_c2s60