Introduction
This is a report for the insert benchmark with 400M docs and 20 client(s). It is generated by scripts (bash, awk, sed) and Tufte might not be impressed. An overview of the insert benchmark is here and a short update is here. Below, by DBMS, I mean DBMS+version.config. An example is my8020.c10b40 where my means MySQL, 8020 is version 8.0.20 and c10b40 is the name for the configuration file.
The test server is a c2-standard-60 from GCP with 30 cores, hyperthreading disabled, 240G RAM and 3T from XFS and SW RAID 0 striped over 8 local NVMe drives. The benchmark was run with 20 clients and there were 1 or 2 connections per client (1 for queries, 1 for inserts). The benchmark loads 400M rows without secondary indexes, creates secondary indexes, loads another 400M rows then does 3 read+write tests for one hour each that do queries as fast as possible with 100, 500 and then 1000 writes/second/client concurrent with the queries. Each read-write test runs for 1800 seconds. The test was configured to use a table per client. The database fits in the OS page cache but not the DBMS buffer pool. Clients and the DBMS share one server. The per-database configs are in the per-database subdirectories here.
The tested DBMS are:
- pg147_def.cx7_gcp_c2s60_4g - Postgres 14.7, the cx7_gcp_c2s60_4g config and a default build that used -O2
- pg147_o3_native_lto.cx7_gcp_c2s60_4g - Postgres 14.7, the cx7_gcp_c2s60_4g config and a build that uses -O3 -march=native -mtune=native -flto (link-time optimization)
Contents
- Summary
- l.i0: load without secondary indexes
- l.x: create secondary indexes
- l.i1: continue load after secondary indexes created
- q100.1: range queries with 100 insert/s per client
- q500.1: range queries with 500 insert/s per client
- q1000.1: range queries with 1000 insert/s per client
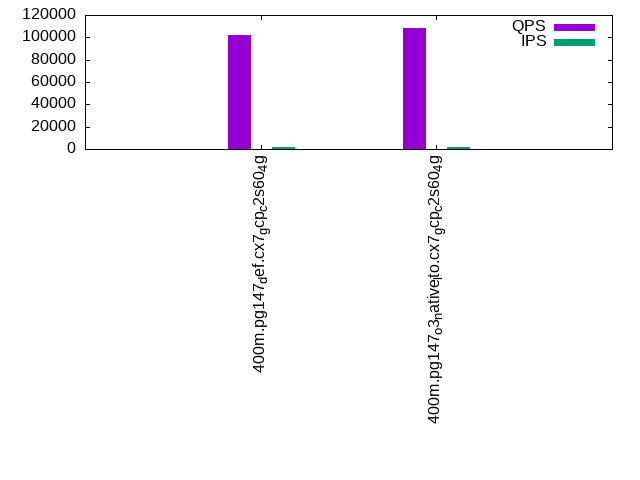
Summary
The numbers are inserts/s for l.i0 and l.i1, indexed docs (or rows) /s for l.x and queries/s for q*.2. The values are the average rate over the entire test for inserts (IPS) and queries (QPS). The range of values for IPS and QPS is split into 3 parts: bottom 25%, middle 50%, top 25%. Values in the bottom 25% have a red background, values in the top 25% have a green background and values in the middle have no color. A gray background is used for values that can be ignored because the DBMS did not sustain the target insert rate. Red backgrounds are not used when the minimum value is within 80% of the max value.
| dbms | l.i0 | l.x | l.i1 | q100.1 | q500.1 | q1000.1 |
|---|---|---|---|---|---|---|
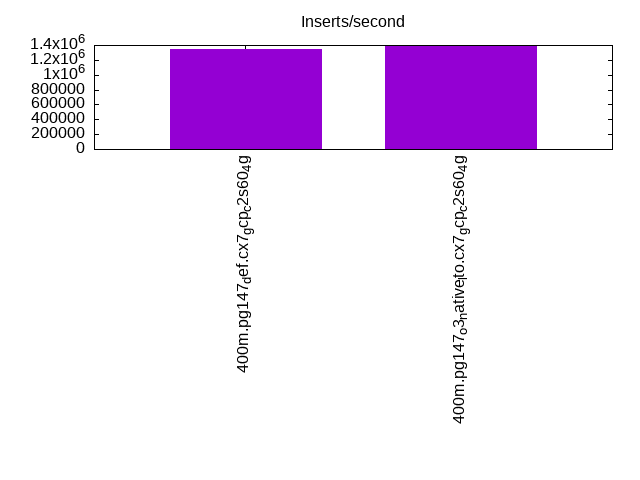
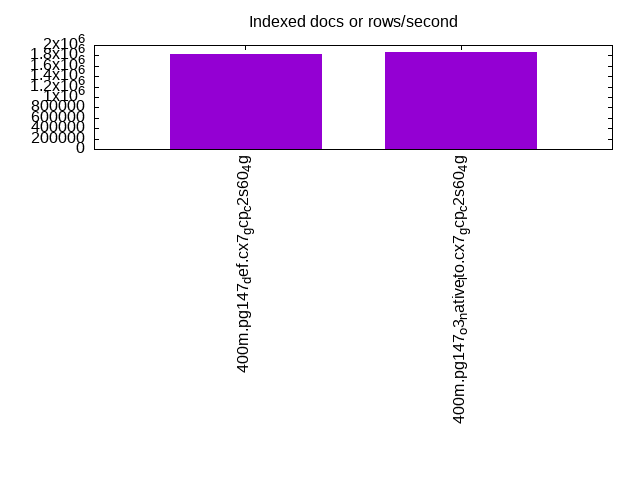
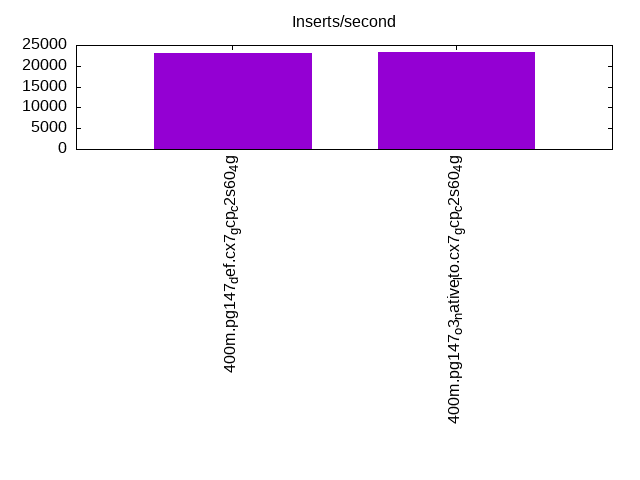
| 400m.pg147_def.cx7_gcp_c2s60_4g | 1351351 | 1835321 | 23135 | 101923 | 75633 | 51512 |
| 400m.pg147_o3_native_lto.cx7_gcp_c2s60_4g | 1393728 | 1860930 | 23214 | 108297 | 77509 | 52387 |
This lists the average rate of inserts/s for the tests that do inserts concurrent with queries. For such tests the query rate is listed in the table above. The read+write tests are setup so that the insert rate should match the target rate every second. Cells that are not at least 95% of the target have a red background to indicate a failure to satisfy the target.
| dbms | q100.1 | q500.1 | q1000.1 |
|---|---|---|---|
| pg147_def.cx7_gcp_c2s60_4g | 1976 | 9885 | 18063 |
| pg147_o3_native_lto.cx7_gcp_c2s60_4g | 1976 | 9885 | 18063 |
| target | 2000 | 10000 | 20000 |
l.i0
l.i0: load without secondary indexes. Graphs for performance per 1-second interval are here.
Average throughput:
Insert response time histogram: each cell has the percentage of responses that take <= the time in the header and max is the max response time in seconds. For the max column values in the top 25% of the range have a red background and in the bottom 25% of the range have a green background. The red background is not used when the min value is within 80% of the max value.
| dbms | 256us | 1ms | 4ms | 16ms | 64ms | 256ms | 1s | 4s | 16s | gt | max |
|---|---|---|---|---|---|---|---|---|---|---|---|
| pg147_def.cx7_gcp_c2s60_4g | 61.250 | 37.566 | 1.109 | 0.037 | 0.027 | 0.011 | 0.001 | 1.102 | |||
| pg147_o3_native_lto.cx7_gcp_c2s60_4g | 61.614 | 37.404 | 0.905 | 0.034 | 0.029 | 0.013 | 0.001 | 1.310 |
Performance metrics for the DBMS listed above. Some are normalized by throughput, others are not. Legend for results is here.
ips	qps	rps	rmbps	wps	wmbps	rpq	rkbpq	wpi	wkbpi	csps	cpups	cspq	cpupq	dbgb1	dbgb2	rss	maxop	p50	p99	tag
1351351	0	551	8.7	9449.0	568.9	0.000	0.007	0.007	0.431	207204	59.9	0.153	13	38.3	103.2	NA	1.102	76815	7591	400m.pg147_def.cx7_gcp_c2s60_4g
1393728	0	674	7.4	9816.2	593.3	0.000	0.005	0.007	0.436	227440	59.1	0.163	13	38.3	103.2	NA	1.310	79411	8890	400m.pg147_o3_native_lto.cx7_gcp_c2s60_4g
l.x
l.x: create secondary indexes.
Average throughput:
Performance metrics for the DBMS listed above. Some are normalized by throughput, others are not. Legend for results is here.
ips	qps	rps	rmbps	wps	wmbps	rpq	rkbpq	wpi	wkbpi	csps	cpups	cspq	cpupq	dbgb1	dbgb2	rss	maxop	p50	p99	tag
1835321	0	12458	268.8	5920.4	763.9	0.007	0.150	0.003	0.426	115729	20.7	0.063	3	73.5	193.4	NA	0.321	NA	NA	400m.pg147_def.cx7_gcp_c2s60_4g
1860930	0	7108	260.8	5843.4	763.5	0.004	0.143	0.003	0.420	116025	20.5	0.062	3	73.5	190.9	NA	0.387	NA	NA	400m.pg147_o3_native_lto.cx7_gcp_c2s60_4g
l.i1
l.i1: continue load after secondary indexes created. Graphs for performance per 1-second interval are here.
Average throughput:
Insert response time histogram: each cell has the percentage of responses that take <= the time in the header and max is the max response time in seconds. For the max column values in the top 25% of the range have a red background and in the bottom 25% of the range have a green background. The red background is not used when the min value is within 80% of the max value.
| dbms | 256us | 1ms | 4ms | 16ms | 64ms | 256ms | 1s | 4s | 16s | gt | max |
|---|---|---|---|---|---|---|---|---|---|---|---|
| pg147_def.cx7_gcp_c2s60_4g | 0.012 | 88.458 | 11.526 | 0.004 | 0.415 | ||||||
| pg147_o3_native_lto.cx7_gcp_c2s60_4g | 0.016 | 88.550 | 11.430 | 0.004 | 0.411 |
Performance metrics for the DBMS listed above. Some are normalized by throughput, others are not. Legend for results is here.
ips	qps	rps	rmbps	wps	wmbps	rpq	rkbpq	wpi	wkbpi	csps	cpups	cspq	cpupq	dbgb1	dbgb2	rss	maxop	p50	p99	tag
23135	0	70070	722.2	62760.9	598.9	3.029	31.967	2.713	26.510	131992	12.2	5.705	158	163.3	258.5	0.0	0.415	1199	599	400m.pg147_def.cx7_gcp_c2s60_4g
23214	0	70190	722.2	63026.9	600.5	3.024	31.857	2.715	26.488	132756	11.9	5.719	154	163.3	259.4	0.0	0.411	1199	599	400m.pg147_o3_native_lto.cx7_gcp_c2s60_4g
q100.1
q100.1: range queries with 100 insert/s per client. Graphs for performance per 1-second interval are here.
Average throughput:
Query response time histogram: each cell has the percentage of responses that take <= the time in the header and max is the max response time in seconds. For max values in the top 25% of the range have a red background and in the bottom 25% of the range have a green background. The red background is not used when the min value is within 80% of the max value.
| dbms | 256us | 1ms | 4ms | 16ms | 64ms | 256ms | 1s | 4s | 16s | gt | max |
|---|---|---|---|---|---|---|---|---|---|---|---|
| pg147_def.cx7_gcp_c2s60_4g | 67.172 | 32.581 | 0.242 | 0.005 | nonzero | nonzero | 0.212 | ||||
| pg147_o3_native_lto.cx7_gcp_c2s60_4g | 69.633 | 30.132 | 0.230 | 0.005 | nonzero | nonzero | 0.234 |
Insert response time histogram: each cell has the percentage of responses that take <= the time in the header and max is the max response time in seconds. For max values in the top 25% of the range have a red background and in the bottom 25% of the range have a green background. The red background is not used when the min value is within 80% of the max value.
| dbms | 256us | 1ms | 4ms | 16ms | 64ms | 256ms | 1s | 4s | 16s | gt | max |
|---|---|---|---|---|---|---|---|---|---|---|---|
| pg147_def.cx7_gcp_c2s60_4g | 0.015 | 99.860 | 0.096 | 0.029 | 0.734 | ||||||
| pg147_o3_native_lto.cx7_gcp_c2s60_4g | 0.015 | 99.858 | 0.106 | 0.021 | 0.376 |
Performance metrics for the DBMS listed above. Some are normalized by throughput, others are not. Legend for results is here.
ips	qps	rps	rmbps	wps	wmbps	rpq	rkbpq	wpi	wkbpi	csps	cpups	cspq	cpupq	dbgb1	dbgb2	rss	maxop	p50	p99	tag
1976	101923	86278	758.9	6342.0	71.7	0.847	7.625	3.210	37.154	474329	37.7	4.654	111	163.9	235.8	0.0	0.212	5085	4523	400m.pg147_def.cx7_gcp_c2s60_4g
1976	108297	81146	788.0	6348.6	72.6	0.749	7.451	3.213	37.613	497635	38.1	4.595	106	163.9	234.6	0.0	0.234	5527	4765	400m.pg147_o3_native_lto.cx7_gcp_c2s60_4g
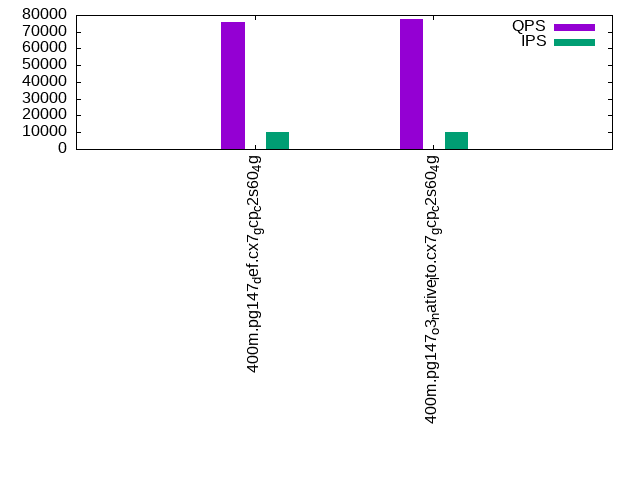
q500.1
q500.1: range queries with 500 insert/s per client. Graphs for performance per 1-second interval are here.
Average throughput:
Query response time histogram: each cell has the percentage of responses that take <= the time in the header and max is the max response time in seconds. For max values in the top 25% of the range have a red background and in the bottom 25% of the range have a green background. The red background is not used when the min value is within 80% of the max value.
| dbms | 256us | 1ms | 4ms | 16ms | 64ms | 256ms | 1s | 4s | 16s | gt | max |
|---|---|---|---|---|---|---|---|---|---|---|---|
| pg147_def.cx7_gcp_c2s60_4g | 59.981 | 38.421 | 1.464 | 0.128 | 0.006 | nonzero | 0.223 | ||||
| pg147_o3_native_lto.cx7_gcp_c2s60_4g | 60.789 | 37.633 | 1.446 | 0.126 | 0.006 | nonzero | 0.128 |
Insert response time histogram: each cell has the percentage of responses that take <= the time in the header and max is the max response time in seconds. For max values in the top 25% of the range have a red background and in the bottom 25% of the range have a green background. The red background is not used when the min value is within 80% of the max value.
| dbms | 256us | 1ms | 4ms | 16ms | 64ms | 256ms | 1s | 4s | 16s | gt | max |
|---|---|---|---|---|---|---|---|---|---|---|---|
| pg147_def.cx7_gcp_c2s60_4g | 0.008 | 92.164 | 7.823 | 0.005 | 0.274 | ||||||
| pg147_o3_native_lto.cx7_gcp_c2s60_4g | 0.004 | 92.297 | 7.698 | nonzero | 0.272 |
Performance metrics for the DBMS listed above. Some are normalized by throughput, others are not. Legend for results is here.
ips	qps	rps	rmbps	wps	wmbps	rpq	rkbpq	wpi	wkbpi	csps	cpups	cspq	cpupq	dbgb1	dbgb2	rss	maxop	p50	p99	tag
9885	75633	94344	884.7	29317.4	307.4	1.247	11.978	2.966	31.848	411905	36.5	5.446	145	167.5	236.7	0.0	0.223	3996	1982	400m.pg147_def.cx7_gcp_c2s60_4g
9885	77509	96098	909.0	29212.7	306.7	1.240	12.010	2.955	31.776	420603	35.7	5.427	138	167.4	236.7	NA	0.128	4123	1935	400m.pg147_o3_native_lto.cx7_gcp_c2s60_4g
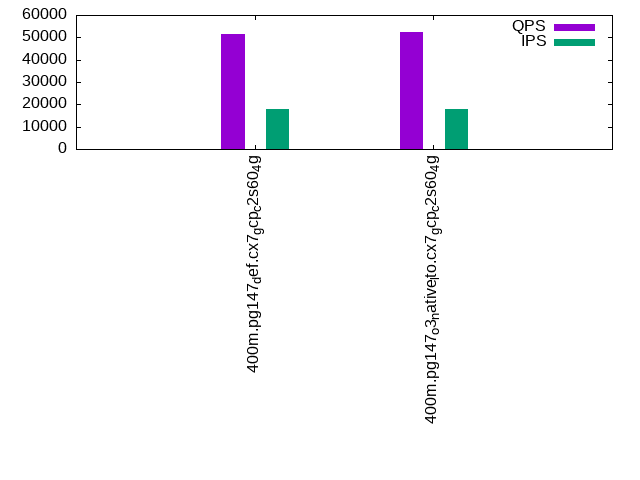
q1000.1
q1000.1: range queries with 1000 insert/s per client. Graphs for performance per 1-second interval are here.
Average throughput:
Query response time histogram: each cell has the percentage of responses that take <= the time in the header and max is the max response time in seconds. For max values in the top 25% of the range have a red background and in the bottom 25% of the range have a green background. The red background is not used when the min value is within 80% of the max value.
| dbms | 256us | 1ms | 4ms | 16ms | 64ms | 256ms | 1s | 4s | 16s | gt | max |
|---|---|---|---|---|---|---|---|---|---|---|---|
| pg147_def.cx7_gcp_c2s60_4g | 53.443 | 42.066 | 3.875 | 0.577 | 0.040 | nonzero | 0.158 | ||||
| pg147_o3_native_lto.cx7_gcp_c2s60_4g | 53.491 | 42.089 | 3.816 | 0.565 | 0.038 | nonzero | 0.100 |
Insert response time histogram: each cell has the percentage of responses that take <= the time in the header and max is the max response time in seconds. For max values in the top 25% of the range have a red background and in the bottom 25% of the range have a green background. The red background is not used when the min value is within 80% of the max value.
| dbms | 256us | 1ms | 4ms | 16ms | 64ms | 256ms | 1s | 4s | 16s | gt | max |
|---|---|---|---|---|---|---|---|---|---|---|---|
| pg147_def.cx7_gcp_c2s60_4g | 0.002 | 82.866 | 17.132 | 0.001 | 0.270 | ||||||
| pg147_o3_native_lto.cx7_gcp_c2s60_4g | 0.002 | 82.686 | 17.312 | 0.001 | 0.277 |
Performance metrics for the DBMS listed above. Some are normalized by throughput, others are not. Legend for results is here.
ips	qps	rps	rmbps	wps	wmbps	rpq	rkbpq	wpi	wkbpi	csps	cpups	cspq	cpupq	dbgb1	dbgb2	rss	maxop	p50	p99	tag
18063	51512	96898	946.9	51666.2	531.0	1.881	18.824	2.860	30.100	362525	36.4	7.038	212	179.6	272.1	0.0	0.158	2701	1422	400m.pg147_def.cx7_gcp_c2s60_4g
18063	52387	98852	961.4	51571.5	527.9	1.887	18.792	2.855	29.925	367587	35.6	7.017	204	179.6	272.2	0.0	0.100	2734	1423	400m.pg147_o3_native_lto.cx7_gcp_c2s60_4g
l.i0
l.i0: load without secondary indexes
Performance metrics for all DBMS, not just the ones listed above. Some are normalized by throughput, others are not. Legend for results is here.
ips	qps	rps	rmbps	wps	wmbps	rpq	rkbpq	wpi	wkbpi	csps	cpups	cspq	cpupq	dbgb1	dbgb2	rss	maxop	p50	p99	tag
1351351	0	551	8.7	9449.0	568.9	0.000	0.007	0.007	0.431	207204	59.9	0.153	13	38.3	103.2	NA	1.102	76815	7591	400m.pg147_def.cx7_gcp_c2s60_4g
1393728	0	674	7.4	9816.2	593.3	0.000	0.005	0.007	0.436	227440	59.1	0.163	13	38.3	103.2	NA	1.310	79411	8890	400m.pg147_o3_native_lto.cx7_gcp_c2s60_4g
l.x
l.x: create secondary indexes
Performance metrics for all DBMS, not just the ones listed above. Some are normalized by throughput, others are not. Legend for results is here.
ips	qps	rps	rmbps	wps	wmbps	rpq	rkbpq	wpi	wkbpi	csps	cpups	cspq	cpupq	dbgb1	dbgb2	rss	maxop	p50	p99	tag
1835321	0	12458	268.8	5920.4	763.9	0.007	0.150	0.003	0.426	115729	20.7	0.063	3	73.5	193.4	NA	0.321	NA	NA	400m.pg147_def.cx7_gcp_c2s60_4g
1860930	0	7108	260.8	5843.4	763.5	0.004	0.143	0.003	0.420	116025	20.5	0.062	3	73.5	190.9	NA	0.387	NA	NA	400m.pg147_o3_native_lto.cx7_gcp_c2s60_4g
l.i1
l.i1: continue load after secondary indexes created
Performance metrics for all DBMS, not just the ones listed above. Some are normalized by throughput, others are not. Legend for results is here.
ips	qps	rps	rmbps	wps	wmbps	rpq	rkbpq	wpi	wkbpi	csps	cpups	cspq	cpupq	dbgb1	dbgb2	rss	maxop	p50	p99	tag
23135	0	70070	722.2	62760.9	598.9	3.029	31.967	2.713	26.510	131992	12.2	5.705	158	163.3	258.5	0.0	0.415	1199	599	400m.pg147_def.cx7_gcp_c2s60_4g
23214	0	70190	722.2	63026.9	600.5	3.024	31.857	2.715	26.488	132756	11.9	5.719	154	163.3	259.4	0.0	0.411	1199	599	400m.pg147_o3_native_lto.cx7_gcp_c2s60_4g
q100.1
q100.1: range queries with 100 insert/s per client
Performance metrics for all DBMS, not just the ones listed above. Some are normalized by throughput, others are not. Legend for results is here.
ips	qps	rps	rmbps	wps	wmbps	rpq	rkbpq	wpi	wkbpi	csps	cpups	cspq	cpupq	dbgb1	dbgb2	rss	maxop	p50	p99	tag
1976	101923	86278	758.9	6342.0	71.7	0.847	7.625	3.210	37.154	474329	37.7	4.654	111	163.9	235.8	0.0	0.212	5085	4523	400m.pg147_def.cx7_gcp_c2s60_4g
1976	108297	81146	788.0	6348.6	72.6	0.749	7.451	3.213	37.613	497635	38.1	4.595	106	163.9	234.6	0.0	0.234	5527	4765	400m.pg147_o3_native_lto.cx7_gcp_c2s60_4g
q500.1
q500.1: range queries with 500 insert/s per client
Performance metrics for all DBMS, not just the ones listed above. Some are normalized by throughput, others are not. Legend for results is here.
ips	qps	rps	rmbps	wps	wmbps	rpq	rkbpq	wpi	wkbpi	csps	cpups	cspq	cpupq	dbgb1	dbgb2	rss	maxop	p50	p99	tag
9885	75633	94344	884.7	29317.4	307.4	1.247	11.978	2.966	31.848	411905	36.5	5.446	145	167.5	236.7	0.0	0.223	3996	1982	400m.pg147_def.cx7_gcp_c2s60_4g
9885	77509	96098	909.0	29212.7	306.7	1.240	12.010	2.955	31.776	420603	35.7	5.427	138	167.4	236.7	NA	0.128	4123	1935	400m.pg147_o3_native_lto.cx7_gcp_c2s60_4g
q1000.1
q1000.1: range queries with 1000 insert/s per client
Performance metrics for all DBMS, not just the ones listed above. Some are normalized by throughput, others are not. Legend for results is here.
ips	qps	rps	rmbps	wps	wmbps	rpq	rkbpq	wpi	wkbpi	csps	cpups	cspq	cpupq	dbgb1	dbgb2	rss	maxop	p50	p99	tag
18063	51512	96898	946.9	51666.2	531.0	1.881	18.824	2.860	30.100	362525	36.4	7.038	212	179.6	272.1	0.0	0.158	2701	1422	400m.pg147_def.cx7_gcp_c2s60_4g
18063	52387	98852	961.4	51571.5	527.9	1.887	18.792	2.855	29.925	367587	35.6	7.017	204	179.6	272.2	0.0	0.100	2734	1423	400m.pg147_o3_native_lto.cx7_gcp_c2s60_4g
l.i0
- l.i0: load without secondary indexes
- Legend for results is here.
- Each entry lists the percentage of responses that fit in that bucket (slower than max time for previous bucket, faster than min time for next bucket).
Insert response time histogram
256us	1ms	4ms	16ms	64ms	256ms	1s	4s	16s	gt	max	tag
0.000	61.250	37.566	1.109	0.037	0.027	0.011	0.001	0.000	0.000	1.102	pg147_def.cx7_gcp_c2s60_4g
0.000	61.614	37.404	0.905	0.034	0.029	0.013	0.001	0.000	0.000	1.310	pg147_o3_native_lto.cx7_gcp_c2s60_4g
l.x
- l.x: create secondary indexes
- Legend for results is here.
- Each entry lists the percentage of responses that fit in that bucket (slower than max time for previous bucket, faster than min time for next bucket).
TODO - determine whether there is data for create index response time
l.i1
- l.i1: continue load after secondary indexes created
- Legend for results is here.
- Each entry lists the percentage of responses that fit in that bucket (slower than max time for previous bucket, faster than min time for next bucket).
Insert response time histogram
256us	1ms	4ms	16ms	64ms	256ms	1s	4s	16s	gt	max	tag
0.000	0.000	0.000	0.012	88.458	11.526	0.004	0.000	0.000	0.000	0.415	pg147_def.cx7_gcp_c2s60_4g
0.000	0.000	0.000	0.016	88.550	11.430	0.004	0.000	0.000	0.000	0.411	pg147_o3_native_lto.cx7_gcp_c2s60_4g
q100.1
- q100.1: range queries with 100 insert/s per client
- Legend for results is here.
- Each entry lists the percentage of responses that fit in that bucket (slower than max time for previous bucket, faster than min time for next bucket).
Query response time histogram
256us	1ms	4ms	16ms	64ms	256ms	1s	4s	16s	gt	max	tag
67.172	32.581	0.242	0.005	nonzero	nonzero	0.000	0.000	0.000	0.000	0.212	pg147_def.cx7_gcp_c2s60_4g
69.633	30.132	0.230	0.005	nonzero	nonzero	0.000	0.000	0.000	0.000	0.234	pg147_o3_native_lto.cx7_gcp_c2s60_4g
Insert response time histogram
256us	1ms	4ms	16ms	64ms	256ms	1s	4s	16s	gt	max	tag
0.000	0.000	0.000	0.015	99.860	0.096	0.029	0.000	0.000	0.000	0.734	pg147_def.cx7_gcp_c2s60_4g
0.000	0.000	0.000	0.015	99.858	0.106	0.021	0.000	0.000	0.000	0.376	pg147_o3_native_lto.cx7_gcp_c2s60_4g
q500.1
- q500.1: range queries with 500 insert/s per client
- Legend for results is here.
- Each entry lists the percentage of responses that fit in that bucket (slower than max time for previous bucket, faster than min time for next bucket).
Query response time histogram
256us	1ms	4ms	16ms	64ms	256ms	1s	4s	16s	gt	max	tag
59.981	38.421	1.464	0.128	0.006	nonzero	0.000	0.000	0.000	0.000	0.223	pg147_def.cx7_gcp_c2s60_4g
60.789	37.633	1.446	0.126	0.006	nonzero	0.000	0.000	0.000	0.000	0.128	pg147_o3_native_lto.cx7_gcp_c2s60_4g
Insert response time histogram
256us	1ms	4ms	16ms	64ms	256ms	1s	4s	16s	gt	max	tag
0.000	0.000	0.000	0.008	92.164	7.823	0.005	0.000	0.000	0.000	0.274	pg147_def.cx7_gcp_c2s60_4g
0.000	0.000	0.000	0.004	92.297	7.698	nonzero	0.000	0.000	0.000	0.272	pg147_o3_native_lto.cx7_gcp_c2s60_4g
q1000.1
- q1000.1: range queries with 1000 insert/s per client
- Legend for results is here.
- Each entry lists the percentage of responses that fit in that bucket (slower than max time for previous bucket, faster than min time for next bucket).
Query response time histogram
256us	1ms	4ms	16ms	64ms	256ms	1s	4s	16s	gt	max	tag
53.443	42.066	3.875	0.577	0.040	nonzero	0.000	0.000	0.000	0.000	0.158	pg147_def.cx7_gcp_c2s60_4g
53.491	42.089	3.816	0.565	0.038	nonzero	0.000	0.000	0.000	0.000	0.100	pg147_o3_native_lto.cx7_gcp_c2s60_4g
Insert response time histogram
256us	1ms	4ms	16ms	64ms	256ms	1s	4s	16s	gt	max	tag
0.000	0.000	0.000	0.002	82.866	17.132	0.001	0.000	0.000	0.000	0.270	pg147_def.cx7_gcp_c2s60_4g
0.000	0.000	0.000	0.002	82.686	17.312	0.001	0.000	0.000	0.000	0.277	pg147_o3_native_lto.cx7_gcp_c2s60_4g