Introduction
This is a report for the insert benchmark with 400M docs and 20 client(s). It is generated by scripts (bash, awk, sed) and Tufte might not be impressed. An overview of the insert benchmark is here and a short update is here. Below, by DBMS, I mean DBMS+version.config. An example is my8020.c10b40 where my means MySQL, 8020 is version 8.0.20 and c10b40 is the name for the configuration file.
The test server is a c2-standard-60 from GCP with 30 cores, hyperthreading disabled, 240G RAM and 3T from XFS and SW RAID 0 striped over 8 local NVMe drives. The benchmark was run with 20 clients and there were 1 or 2 connections per client (1 for queries, 1 for inserts). The benchmark loads 400M rows without secondary indexes, creates secondary indexes, loads another 400M rows then does 3 read+write tests for one hour each that do queries as fast as possible with 100, 500 and then 1000 writes/second/client concurrent with the queries. Each read-write test runs for 1800 seconds. The test was configured to use one table. The database is cached by the storage engine and the only IO is for writes. Clients and the DBMS share one server. The per-database configs are in the per-database subdirectories here.
The tested DBMS are:
- pg1310_def.cx7_gcp_c2s60 - Postgres 13.10, the cx7_gcp_c2s60 config and a default build that used -O2
- pg1310_o3_native_lto.cx7_gcp_c2s60 - Postgres 13.10, the cx7_gcp_c2s60 config and a build that uses -O3 -march=native -mtune=native -flto (link-time optimization)
Contents
- Summary
- l.i0: load without secondary indexes
- l.x: create secondary indexes
- l.i1: continue load after secondary indexes created
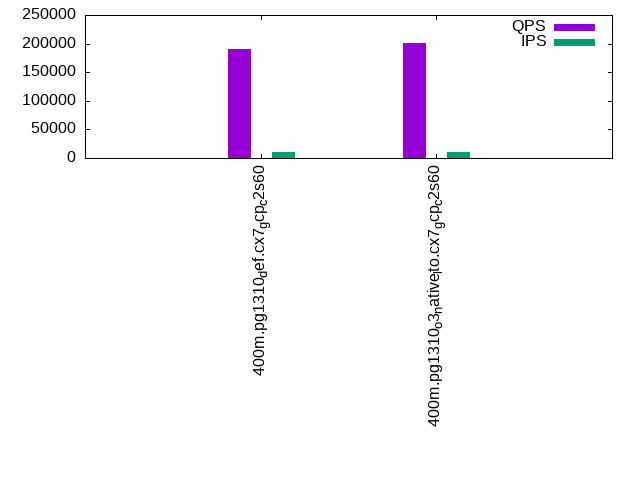
- q100.1: range queries with 100 insert/s per client
- q500.1: range queries with 500 insert/s per client
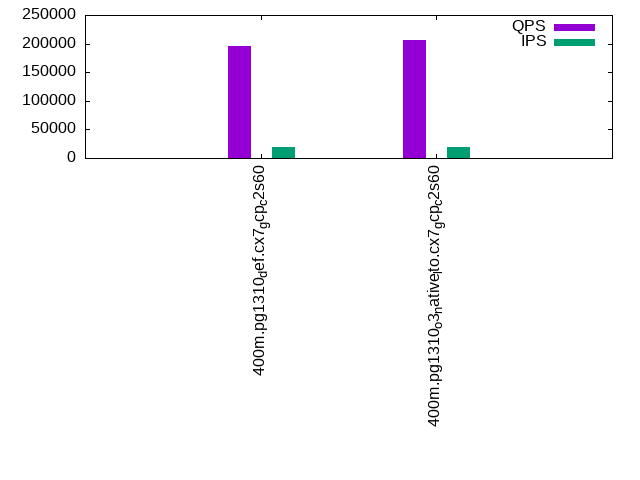
- q1000.1: range queries with 1000 insert/s per client
Summary
The numbers are inserts/s for l.i0 and l.i1, indexed docs (or rows) /s for l.x and queries/s for q*.2. The values are the average rate over the entire test for inserts (IPS) and queries (QPS). The range of values for IPS and QPS is split into 3 parts: bottom 25%, middle 50%, top 25%. Values in the bottom 25% have a red background, values in the top 25% have a green background and values in the middle have no color. A gray background is used for values that can be ignored because the DBMS did not sustain the target insert rate. Red backgrounds are not used when the minimum value is within 80% of the max value.
| dbms | l.i0 | l.x | l.i1 | q100.1 | q500.1 | q1000.1 |
|---|---|---|---|---|---|---|
| 400m.pg1310_def.cx7_gcp_c2s60 | 1086956 | 335654 | 384986 | 189859 | 191269 | 196494 |
| 400m.pg1310_o3_native_lto.cx7_gcp_c2s60 | 1101928 | 338208 | 388350 | 199219 | 201186 | 205778 |
This lists the average rate of inserts/s for the tests that do inserts concurrent with queries. For such tests the query rate is listed in the table above. The read+write tests are setup so that the insert rate should match the target rate every second. Cells that are not at least 95% of the target have a red background to indicate a failure to satisfy the target.
| dbms | q100.1 | q500.1 | q1000.1 |
|---|---|---|---|
| pg1310_def.cx7_gcp_c2s60 | 1976 | 9885 | 19769 |
| pg1310_o3_native_lto.cx7_gcp_c2s60 | 1976 | 9885 | 19769 |
| target | 2000 | 10000 | 20000 |
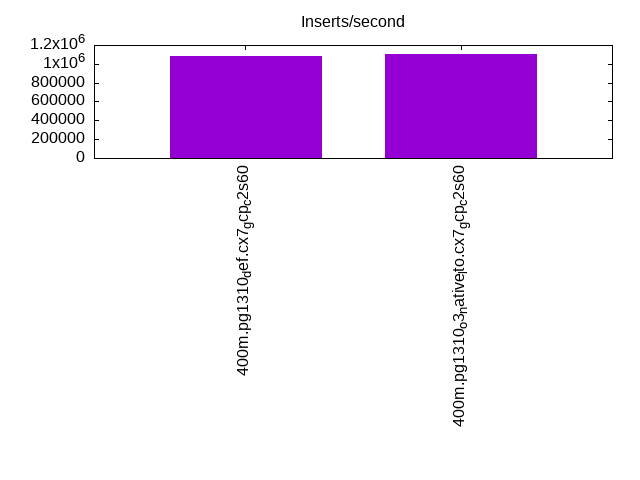
l.i0
l.i0: load without secondary indexes. Graphs for performance per 1-second interval are here.
Average throughput:
Insert response time histogram: each cell has the percentage of responses that take <= the time in the header and max is the max response time in seconds. For the max column values in the top 25% of the range have a red background and in the bottom 25% of the range have a green background. The red background is not used when the min value is within 80% of the max value.
| dbms | 256us | 1ms | 4ms | 16ms | 64ms | 256ms | 1s | 4s | 16s | gt | max |
|---|---|---|---|---|---|---|---|---|---|---|---|
| pg1310_def.cx7_gcp_c2s60 | 21.060 | 75.421 | 3.454 | 0.024 | 0.029 | 0.012 | 0.956 | ||||
| pg1310_o3_native_lto.cx7_gcp_c2s60 | 26.135 | 70.323 | 3.484 | 0.019 | 0.023 | 0.016 | nonzero | 1.290 |
Performance metrics for the DBMS listed above. Some are normalized by throughput, others are not. Legend for results is here.
ips	qps	rps	rmbps	wps	wmbps	rpq	rkbpq	wpi	wkbpi	csps	cpups	cspq	cpupq	dbgb1	dbgb2	rss	maxop	p50	p99	tag
1086956	0	0	0.0	1711.3	420.6	0.000	0.000	0.002	0.396	300202	57.9	0.276	16	43.0	115.7	NA	0.956	60834	8094	400m.pg1310_def.cx7_gcp_c2s60
1101928	0	0	0.0	1726.0	422.9	0.000	0.000	0.002	0.393	324734	57.2	0.295	16	43.0	114.9	NA	1.290	61563	8091	400m.pg1310_o3_native_lto.cx7_gcp_c2s60
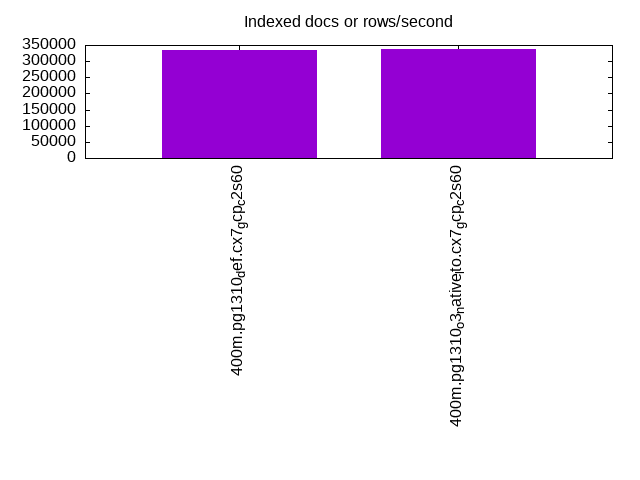
l.x
l.x: create secondary indexes.
Average throughput:
Performance metrics for the DBMS listed above. Some are normalized by throughput, others are not. Legend for results is here.
ips	qps	rps	rmbps	wps	wmbps	rpq	rkbpq	wpi	wkbpi	csps	cpups	cspq	cpupq	dbgb1	dbgb2	rss	maxop	p50	p99	tag
335654	0	1103	15.2	391.1	95.2	0.003	0.046	0.001	0.291	757	3.3	0.002	3	78.3	151.6	0.0	0.019	NA	NA	400m.pg1310_def.cx7_gcp_c2s60
338208	0	890	16.2	395.3	93.3	0.003	0.049	0.001	0.282	802	3.3	0.002	3	78.3	150.8	0.0	0.013	NA	NA	400m.pg1310_o3_native_lto.cx7_gcp_c2s60
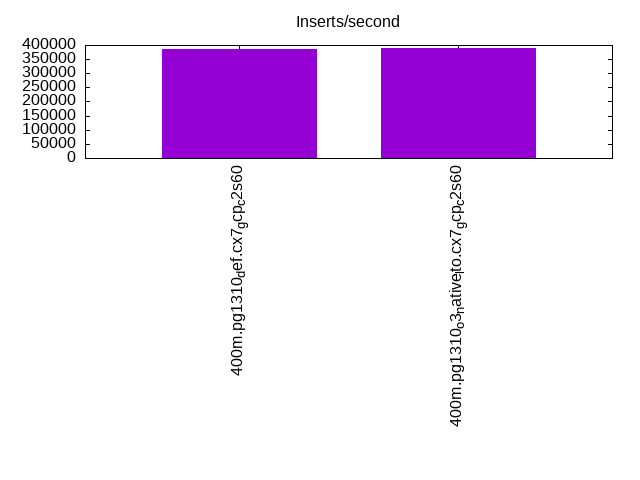
l.i1
l.i1: continue load after secondary indexes created. Graphs for performance per 1-second interval are here.
Average throughput:
Insert response time histogram: each cell has the percentage of responses that take <= the time in the header and max is the max response time in seconds. For the max column values in the top 25% of the range have a red background and in the bottom 25% of the range have a green background. The red background is not used when the min value is within 80% of the max value.
| dbms | 256us | 1ms | 4ms | 16ms | 64ms | 256ms | 1s | 4s | 16s | gt | max |
|---|---|---|---|---|---|---|---|---|---|---|---|
| pg1310_def.cx7_gcp_c2s60 | 94.314 | 4.602 | 1.039 | 0.032 | 0.012 | nonzero | 1.016 | ||||
| pg1310_o3_native_lto.cx7_gcp_c2s60 | 94.303 | 4.575 | 1.079 | 0.027 | 0.017 | 0.775 |
Performance metrics for the DBMS listed above. Some are normalized by throughput, others are not. Legend for results is here.
ips	qps	rps	rmbps	wps	wmbps	rpq	rkbpq	wpi	wkbpi	csps	cpups	cspq	cpupq	dbgb1	dbgb2	rss	maxop	p50	p99	tag
384986	0	2978	26.8	2460.9	420.8	0.008	0.071	0.006	1.119	271361	53.1	0.705	41	170.2	312.6	NA	1.016	23684	1799	400m.pg1310_def.cx7_gcp_c2s60
388350	0	2910	27.0	2535.3	440.4	0.007	0.071	0.007	1.161	285834	52.1	0.736	40	170.2	317.5	NA	0.775	24269	1399	400m.pg1310_o3_native_lto.cx7_gcp_c2s60
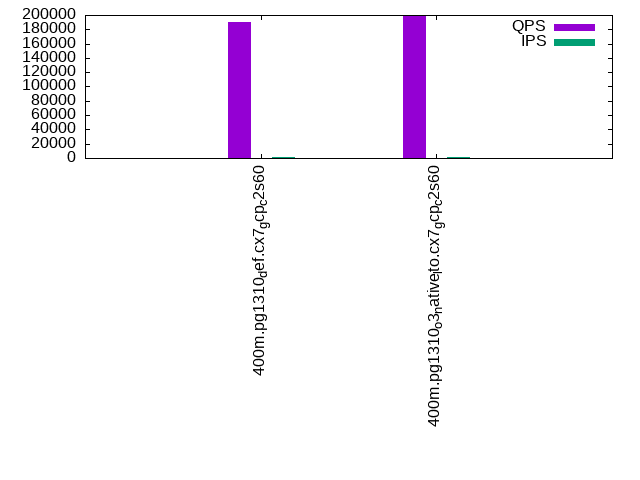
q100.1
q100.1: range queries with 100 insert/s per client. Graphs for performance per 1-second interval are here.
Average throughput:
Query response time histogram: each cell has the percentage of responses that take <= the time in the header and max is the max response time in seconds. For max values in the top 25% of the range have a red background and in the bottom 25% of the range have a green background. The red background is not used when the min value is within 80% of the max value.
| dbms | 256us | 1ms | 4ms | 16ms | 64ms | 256ms | 1s | 4s | 16s | gt | max |
|---|---|---|---|---|---|---|---|---|---|---|---|
| pg1310_def.cx7_gcp_c2s60 | 99.972 | 0.022 | 0.006 | 0.001 | nonzero | 0.024 | |||||
| pg1310_o3_native_lto.cx7_gcp_c2s60 | 99.977 | 0.016 | 0.006 | 0.001 | nonzero | 0.024 |
Insert response time histogram: each cell has the percentage of responses that take <= the time in the header and max is the max response time in seconds. For max values in the top 25% of the range have a red background and in the bottom 25% of the range have a green background. The red background is not used when the min value is within 80% of the max value.
| dbms | 256us | 1ms | 4ms | 16ms | 64ms | 256ms | 1s | 4s | 16s | gt | max |
|---|---|---|---|---|---|---|---|---|---|---|---|
| pg1310_def.cx7_gcp_c2s60 | 97.821 | 1.599 | 0.568 | 0.013 | 0.100 | ||||||
| pg1310_o3_native_lto.cx7_gcp_c2s60 | 97.158 | 2.371 | 0.468 | 0.003 | 0.118 |
Performance metrics for the DBMS listed above. Some are normalized by throughput, others are not. Legend for results is here.
ips	qps	rps	rmbps	wps	wmbps	rpq	rkbpq	wpi	wkbpi	csps	cpups	cspq	cpupq	dbgb1	dbgb2	rss	maxop	p50	p99	tag
1976	189859	0	0.0	2579.9	72.7	0.000	0.000	1.306	37.698	677437	62.8	3.568	99	171.1	272.0	0.0	0.024	9382	9046	400m.pg1310_def.cx7_gcp_c2s60
1976	199219	0	0.0	2578.1	72.6	0.000	0.000	1.305	37.645	709285	62.8	3.560	95	171.1	275.6	0.0	0.024	9898	9530	400m.pg1310_o3_native_lto.cx7_gcp_c2s60
q500.1
q500.1: range queries with 500 insert/s per client. Graphs for performance per 1-second interval are here.
Average throughput:
Query response time histogram: each cell has the percentage of responses that take <= the time in the header and max is the max response time in seconds. For max values in the top 25% of the range have a red background and in the bottom 25% of the range have a green background. The red background is not used when the min value is within 80% of the max value.
| dbms | 256us | 1ms | 4ms | 16ms | 64ms | 256ms | 1s | 4s | 16s | gt | max |
|---|---|---|---|---|---|---|---|---|---|---|---|
| pg1310_def.cx7_gcp_c2s60 | 99.912 | 0.058 | 0.027 | 0.003 | nonzero | 0.033 | |||||
| pg1310_o3_native_lto.cx7_gcp_c2s60 | 99.920 | 0.052 | 0.026 | 0.003 | nonzero | nonzero | 0.072 |
Insert response time histogram: each cell has the percentage of responses that take <= the time in the header and max is the max response time in seconds. For max values in the top 25% of the range have a red background and in the bottom 25% of the range have a green background. The red background is not used when the min value is within 80% of the max value.
| dbms | 256us | 1ms | 4ms | 16ms | 64ms | 256ms | 1s | 4s | 16s | gt | max |
|---|---|---|---|---|---|---|---|---|---|---|---|
| pg1310_def.cx7_gcp_c2s60 | 52.667 | 27.996 | 19.036 | 0.299 | 0.002 | 0.290 | |||||
| pg1310_o3_native_lto.cx7_gcp_c2s60 | 52.274 | 28.005 | 19.395 | 0.325 | 0.166 |
Performance metrics for the DBMS listed above. Some are normalized by throughput, others are not. Legend for results is here.
ips	qps	rps	rmbps	wps	wmbps	rpq	rkbpq	wpi	wkbpi	csps	cpups	cspq	cpupq	dbgb1	dbgb2	rss	maxop	p50	p99	tag
9885	191269	0	0.0	4597.6	149.5	0.000	0.000	0.465	15.488	669164	63.9	3.499	100	176.0	242.4	0.0	0.033	9482	9078	400m.pg1310_def.cx7_gcp_c2s60
9885	201186	0	0.0	4691.4	151.6	0.000	0.000	0.475	15.703	701820	63.7	3.488	95	176.0	243.7	0.0	0.072	9989	9498	400m.pg1310_o3_native_lto.cx7_gcp_c2s60
q1000.1
q1000.1: range queries with 1000 insert/s per client. Graphs for performance per 1-second interval are here.
Average throughput:
Query response time histogram: each cell has the percentage of responses that take <= the time in the header and max is the max response time in seconds. For max values in the top 25% of the range have a red background and in the bottom 25% of the range have a green background. The red background is not used when the min value is within 80% of the max value.
| dbms | 256us | 1ms | 4ms | 16ms | 64ms | 256ms | 1s | 4s | 16s | gt | max |
|---|---|---|---|---|---|---|---|---|---|---|---|
| pg1310_def.cx7_gcp_c2s60 | 99.862 | 0.096 | 0.037 | 0.004 | nonzero | 0.042 | |||||
| pg1310_o3_native_lto.cx7_gcp_c2s60 | 99.871 | 0.089 | 0.036 | 0.004 | nonzero | 0.053 |
Insert response time histogram: each cell has the percentage of responses that take <= the time in the header and max is the max response time in seconds. For max values in the top 25% of the range have a red background and in the bottom 25% of the range have a green background. The red background is not used when the min value is within 80% of the max value.
| dbms | 256us | 1ms | 4ms | 16ms | 64ms | 256ms | 1s | 4s | 16s | gt | max |
|---|---|---|---|---|---|---|---|---|---|---|---|
| pg1310_def.cx7_gcp_c2s60 | 61.718 | 25.673 | 12.288 | 0.321 | 0.217 | ||||||
| pg1310_o3_native_lto.cx7_gcp_c2s60 | 62.085 | 25.567 | 12.043 | 0.304 | 0.221 |
Performance metrics for the DBMS listed above. Some are normalized by throughput, others are not. Legend for results is here.
ips	qps	rps	rmbps	wps	wmbps	rpq	rkbpq	wpi	wkbpi	csps	cpups	cspq	cpupq	dbgb1	dbgb2	rss	maxop	p50	p99	tag
19769	196494	0	0.0	4433.1	213.5	0.000	0.000	0.224	11.057	661228	65.4	3.365	100	189.4	252.0	0.0	0.042	9749	9110	400m.pg1310_def.cx7_gcp_c2s60
19769	205778	0	0.0	4370.8	209.3	0.000	0.000	0.221	10.839	692687	65.3	3.366	95	189.4	252.7	0.0	0.053	10168	9513	400m.pg1310_o3_native_lto.cx7_gcp_c2s60
l.i0
l.i0: load without secondary indexes
Performance metrics for all DBMS, not just the ones listed above. Some are normalized by throughput, others are not. Legend for results is here.
ips	qps	rps	rmbps	wps	wmbps	rpq	rkbpq	wpi	wkbpi	csps	cpups	cspq	cpupq	dbgb1	dbgb2	rss	maxop	p50	p99	tag
1086956	0	0	0.0	1711.3	420.6	0.000	0.000	0.002	0.396	300202	57.9	0.276	16	43.0	115.7	NA	0.956	60834	8094	400m.pg1310_def.cx7_gcp_c2s60
1101928	0	0	0.0	1726.0	422.9	0.000	0.000	0.002	0.393	324734	57.2	0.295	16	43.0	114.9	NA	1.290	61563	8091	400m.pg1310_o3_native_lto.cx7_gcp_c2s60
l.x
l.x: create secondary indexes
Performance metrics for all DBMS, not just the ones listed above. Some are normalized by throughput, others are not. Legend for results is here.
ips	qps	rps	rmbps	wps	wmbps	rpq	rkbpq	wpi	wkbpi	csps	cpups	cspq	cpupq	dbgb1	dbgb2	rss	maxop	p50	p99	tag
335654	0	1103	15.2	391.1	95.2	0.003	0.046	0.001	0.291	757	3.3	0.002	3	78.3	151.6	0.0	0.019	NA	NA	400m.pg1310_def.cx7_gcp_c2s60
338208	0	890	16.2	395.3	93.3	0.003	0.049	0.001	0.282	802	3.3	0.002	3	78.3	150.8	0.0	0.013	NA	NA	400m.pg1310_o3_native_lto.cx7_gcp_c2s60
l.i1
l.i1: continue load after secondary indexes created
Performance metrics for all DBMS, not just the ones listed above. Some are normalized by throughput, others are not. Legend for results is here.
ips	qps	rps	rmbps	wps	wmbps	rpq	rkbpq	wpi	wkbpi	csps	cpups	cspq	cpupq	dbgb1	dbgb2	rss	maxop	p50	p99	tag
384986	0	2978	26.8	2460.9	420.8	0.008	0.071	0.006	1.119	271361	53.1	0.705	41	170.2	312.6	NA	1.016	23684	1799	400m.pg1310_def.cx7_gcp_c2s60
388350	0	2910	27.0	2535.3	440.4	0.007	0.071	0.007	1.161	285834	52.1	0.736	40	170.2	317.5	NA	0.775	24269	1399	400m.pg1310_o3_native_lto.cx7_gcp_c2s60
q100.1
q100.1: range queries with 100 insert/s per client
Performance metrics for all DBMS, not just the ones listed above. Some are normalized by throughput, others are not. Legend for results is here.
ips	qps	rps	rmbps	wps	wmbps	rpq	rkbpq	wpi	wkbpi	csps	cpups	cspq	cpupq	dbgb1	dbgb2	rss	maxop	p50	p99	tag
1976	189859	0	0.0	2579.9	72.7	0.000	0.000	1.306	37.698	677437	62.8	3.568	99	171.1	272.0	0.0	0.024	9382	9046	400m.pg1310_def.cx7_gcp_c2s60
1976	199219	0	0.0	2578.1	72.6	0.000	0.000	1.305	37.645	709285	62.8	3.560	95	171.1	275.6	0.0	0.024	9898	9530	400m.pg1310_o3_native_lto.cx7_gcp_c2s60
q500.1
q500.1: range queries with 500 insert/s per client
Performance metrics for all DBMS, not just the ones listed above. Some are normalized by throughput, others are not. Legend for results is here.
ips	qps	rps	rmbps	wps	wmbps	rpq	rkbpq	wpi	wkbpi	csps	cpups	cspq	cpupq	dbgb1	dbgb2	rss	maxop	p50	p99	tag
9885	191269	0	0.0	4597.6	149.5	0.000	0.000	0.465	15.488	669164	63.9	3.499	100	176.0	242.4	0.0	0.033	9482	9078	400m.pg1310_def.cx7_gcp_c2s60
9885	201186	0	0.0	4691.4	151.6	0.000	0.000	0.475	15.703	701820	63.7	3.488	95	176.0	243.7	0.0	0.072	9989	9498	400m.pg1310_o3_native_lto.cx7_gcp_c2s60
q1000.1
q1000.1: range queries with 1000 insert/s per client
Performance metrics for all DBMS, not just the ones listed above. Some are normalized by throughput, others are not. Legend for results is here.
ips	qps	rps	rmbps	wps	wmbps	rpq	rkbpq	wpi	wkbpi	csps	cpups	cspq	cpupq	dbgb1	dbgb2	rss	maxop	p50	p99	tag
19769	196494	0	0.0	4433.1	213.5	0.000	0.000	0.224	11.057	661228	65.4	3.365	100	189.4	252.0	0.0	0.042	9749	9110	400m.pg1310_def.cx7_gcp_c2s60
19769	205778	0	0.0	4370.8	209.3	0.000	0.000	0.221	10.839	692687	65.3	3.366	95	189.4	252.7	0.0	0.053	10168	9513	400m.pg1310_o3_native_lto.cx7_gcp_c2s60
l.i0
- l.i0: load without secondary indexes
- Legend for results is here.
- Each entry lists the percentage of responses that fit in that bucket (slower than max time for previous bucket, faster than min time for next bucket).
Insert response time histogram
256us	1ms	4ms	16ms	64ms	256ms	1s	4s	16s	gt	max	tag
0.000	21.060	75.421	3.454	0.024	0.029	0.012	0.000	0.000	0.000	0.956	pg1310_def.cx7_gcp_c2s60
0.000	26.135	70.323	3.484	0.019	0.023	0.016	nonzero	0.000	0.000	1.290	pg1310_o3_native_lto.cx7_gcp_c2s60
l.x
- l.x: create secondary indexes
- Legend for results is here.
- Each entry lists the percentage of responses that fit in that bucket (slower than max time for previous bucket, faster than min time for next bucket).
TODO - determine whether there is data for create index response time
l.i1
- l.i1: continue load after secondary indexes created
- Legend for results is here.
- Each entry lists the percentage of responses that fit in that bucket (slower than max time for previous bucket, faster than min time for next bucket).
Insert response time histogram
256us	1ms	4ms	16ms	64ms	256ms	1s	4s	16s	gt	max	tag
0.000	0.000	94.314	4.602	1.039	0.032	0.012	nonzero	0.000	0.000	1.016	pg1310_def.cx7_gcp_c2s60
0.000	0.000	94.303	4.575	1.079	0.027	0.017	0.000	0.000	0.000	0.775	pg1310_o3_native_lto.cx7_gcp_c2s60
q100.1
- q100.1: range queries with 100 insert/s per client
- Legend for results is here.
- Each entry lists the percentage of responses that fit in that bucket (slower than max time for previous bucket, faster than min time for next bucket).
Query response time histogram
256us	1ms	4ms	16ms	64ms	256ms	1s	4s	16s	gt	max	tag
99.972	0.022	0.006	0.001	nonzero	0.000	0.000	0.000	0.000	0.000	0.024	pg1310_def.cx7_gcp_c2s60
99.977	0.016	0.006	0.001	nonzero	0.000	0.000	0.000	0.000	0.000	0.024	pg1310_o3_native_lto.cx7_gcp_c2s60
Insert response time histogram
256us	1ms	4ms	16ms	64ms	256ms	1s	4s	16s	gt	max	tag
0.000	0.000	97.821	1.599	0.568	0.013	0.000	0.000	0.000	0.000	0.100	pg1310_def.cx7_gcp_c2s60
0.000	0.000	97.158	2.371	0.468	0.003	0.000	0.000	0.000	0.000	0.118	pg1310_o3_native_lto.cx7_gcp_c2s60
q500.1
- q500.1: range queries with 500 insert/s per client
- Legend for results is here.
- Each entry lists the percentage of responses that fit in that bucket (slower than max time for previous bucket, faster than min time for next bucket).
Query response time histogram
256us	1ms	4ms	16ms	64ms	256ms	1s	4s	16s	gt	max	tag
99.912	0.058	0.027	0.003	nonzero	0.000	0.000	0.000	0.000	0.000	0.033	pg1310_def.cx7_gcp_c2s60
99.920	0.052	0.026	0.003	nonzero	nonzero	0.000	0.000	0.000	0.000	0.072	pg1310_o3_native_lto.cx7_gcp_c2s60
Insert response time histogram
256us	1ms	4ms	16ms	64ms	256ms	1s	4s	16s	gt	max	tag
0.000	0.000	52.667	27.996	19.036	0.299	0.002	0.000	0.000	0.000	0.290	pg1310_def.cx7_gcp_c2s60
0.000	0.000	52.274	28.005	19.395	0.325	0.000	0.000	0.000	0.000	0.166	pg1310_o3_native_lto.cx7_gcp_c2s60
q1000.1
- q1000.1: range queries with 1000 insert/s per client
- Legend for results is here.
- Each entry lists the percentage of responses that fit in that bucket (slower than max time for previous bucket, faster than min time for next bucket).
Query response time histogram
256us	1ms	4ms	16ms	64ms	256ms	1s	4s	16s	gt	max	tag
99.862	0.096	0.037	0.004	nonzero	0.000	0.000	0.000	0.000	0.000	0.042	pg1310_def.cx7_gcp_c2s60
99.871	0.089	0.036	0.004	nonzero	0.000	0.000	0.000	0.000	0.000	0.053	pg1310_o3_native_lto.cx7_gcp_c2s60
Insert response time histogram
256us	1ms	4ms	16ms	64ms	256ms	1s	4s	16s	gt	max	tag
0.000	0.000	61.718	25.673	12.288	0.321	0.000	0.000	0.000	0.000	0.217	pg1310_def.cx7_gcp_c2s60
0.000	0.000	62.085	25.567	12.043	0.304	0.000	0.000	0.000	0.000	0.221	pg1310_o3_native_lto.cx7_gcp_c2s60