Introduction
This is a report for the insert benchmark with 400M docs and 20 client(s). It is generated by scripts (bash, awk, sed) and Tufte might not be impressed. An overview of the insert benchmark is here and a short update is here. Below, by DBMS, I mean DBMS+version.config. An example is my8020.c10b40 where my means MySQL, 8020 is version 8.0.20 and c10b40 is the name for the configuration file.
The test server is a c2-standard-60 from GCP with 30 cores, hyperthreading disabled, 240G RAM and 3T from XFS and SW RAID 0 striped over 8 local NVMe drives. The benchmark was run with 20 clients and there were 1 or 2 connections per client (1 for queries, 1 for inserts). The benchmark loads 400M rows without secondary indexes, creates secondary indexes, loads another 400M rows then does 3 read+write tests for one hour each that do queries as fast as possible with 100, 500 and then 1000 writes/second/client concurrent with the queries. Each read-write test runs for 1800 seconds. The test was configured to use one table. The database fits in the OS page cache but not the DBMS buffer pool. Clients and the DBMS share one server. The per-database configs are in the per-database subdirectories here.
The tested DBMS are:
- pg1310_def.cx7_gcp_c2s60_4g - Postgres 13.10, the cx7_gcp_c2s60_4g config and a default build that used -O2
- pg1310_o3_native_lto.cx7_gcp_c2s60_4g - Postgres 13.10, the cx7_gcp_c2s60_4g config and a build that uses -O3 -march=native -mtune=native -flto (link-time optimization)
Contents
- Summary
- l.i0: load without secondary indexes
- l.x: create secondary indexes
- l.i1: continue load after secondary indexes created
- q100.1: range queries with 100 insert/s per client
- q500.1: range queries with 500 insert/s per client
- q1000.1: range queries with 1000 insert/s per client
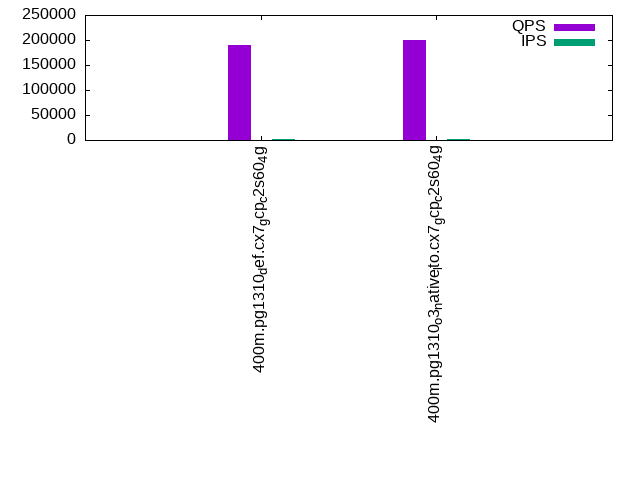
Summary
The numbers are inserts/s for l.i0 and l.i1, indexed docs (or rows) /s for l.x and queries/s for q*.2. The values are the average rate over the entire test for inserts (IPS) and queries (QPS). The range of values for IPS and QPS is split into 3 parts: bottom 25%, middle 50%, top 25%. Values in the bottom 25% have a red background, values in the top 25% have a green background and values in the middle have no color. A gray background is used for values that can be ignored because the DBMS did not sustain the target insert rate. Red backgrounds are not used when the minimum value is within 80% of the max value.
| dbms | l.i0 | l.x | l.i1 | q100.1 | q500.1 | q1000.1 |
|---|---|---|---|---|---|---|
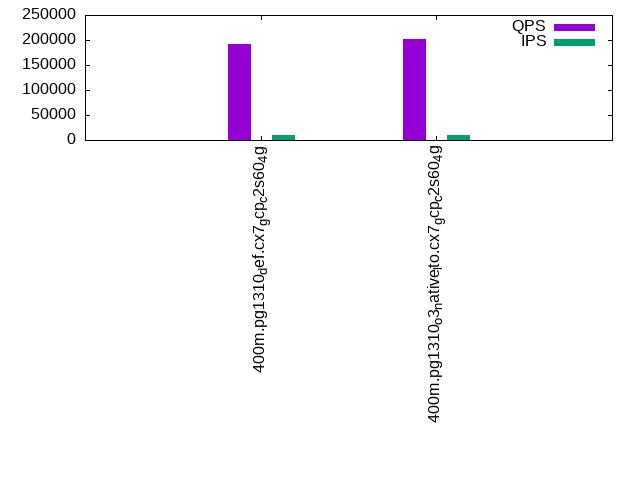
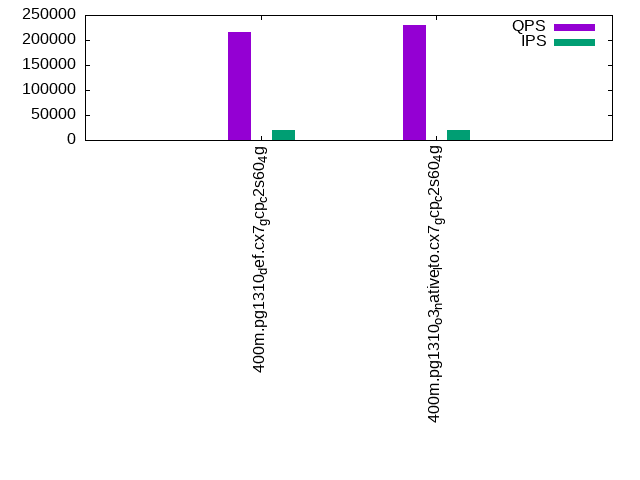
| 400m.pg1310_def.cx7_gcp_c2s60_4g | 1092896 | 303796 | 33350 | 189230 | 192301 | 215653 |
| 400m.pg1310_o3_native_lto.cx7_gcp_c2s60_4g | 1101928 | 308243 | 33667 | 200022 | 202718 | 229618 |
This lists the average rate of inserts/s for the tests that do inserts concurrent with queries. For such tests the query rate is listed in the table above. The read+write tests are setup so that the insert rate should match the target rate every second. Cells that are not at least 95% of the target have a red background to indicate a failure to satisfy the target.
| dbms | q100.1 | q500.1 | q1000.1 |
|---|---|---|---|
| pg1310_def.cx7_gcp_c2s60_4g | 1976 | 9885 | 19651 |
| pg1310_o3_native_lto.cx7_gcp_c2s60_4g | 1976 | 9885 | 19672 |
| target | 2000 | 10000 | 20000 |
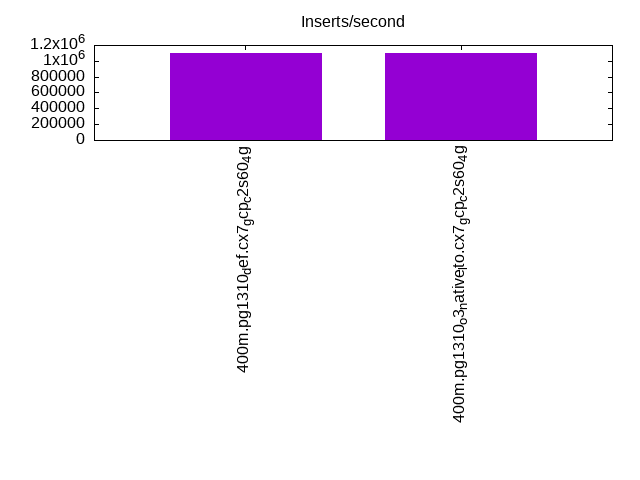
l.i0
l.i0: load without secondary indexes. Graphs for performance per 1-second interval are here.
Average throughput:
Insert response time histogram: each cell has the percentage of responses that take <= the time in the header and max is the max response time in seconds. For the max column values in the top 25% of the range have a red background and in the bottom 25% of the range have a green background. The red background is not used when the min value is within 80% of the max value.
| dbms | 256us | 1ms | 4ms | 16ms | 64ms | 256ms | 1s | 4s | 16s | gt | max |
|---|---|---|---|---|---|---|---|---|---|---|---|
| pg1310_def.cx7_gcp_c2s60_4g | 23.405 | 73.424 | 3.100 | 0.027 | 0.029 | 0.014 | 0.001 | 1.169 | |||
| pg1310_o3_native_lto.cx7_gcp_c2s60_4g | 28.161 | 68.546 | 3.218 | 0.029 | 0.031 | 0.014 | 0.001 | 1.307 |
Performance metrics for the DBMS listed above. Some are normalized by throughput, others are not. Legend for results is here.
ips	qps	rps	rmbps	wps	wmbps	rpq	rkbpq	wpi	wkbpi	csps	cpups	cspq	cpupq	dbgb1	dbgb2	rss	maxop	p50	p99	tag
1092896	0	189	3.7	2134.8	456.6	0.000	0.003	0.002	0.428	297047	57.5	0.272	16	43.0	112.5	NA	1.169	60962	3896	400m.pg1310_def.cx7_gcp_c2s60_4g
1101928	0	132	3.8	2161.3	466.1	0.000	0.004	0.002	0.433	330578	56.9	0.300	15	43.0	112.5	0.0	1.307	61632	10793	400m.pg1310_o3_native_lto.cx7_gcp_c2s60_4g
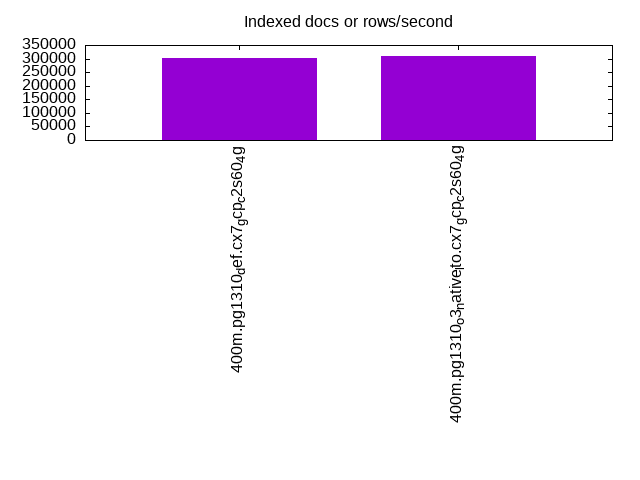
l.x
l.x: create secondary indexes.
Average throughput:
Performance metrics for the DBMS listed above. Some are normalized by throughput, others are not. Legend for results is here.
ips	qps	rps	rmbps	wps	wmbps	rpq	rkbpq	wpi	wkbpi	csps	cpups	cspq	cpupq	dbgb1	dbgb2	rss	maxop	p50	p99	tag
303796	0	1520	43.7	466.9	104.5	0.005	0.147	0.002	0.352	1745	3.4	0.006	3	78.3	147.3	0.0	0.002	NA	NA	400m.pg1310_def.cx7_gcp_c2s60_4g
308243	0	1726	42.0	439.0	103.9	0.006	0.139	0.001	0.345	1903	3.4	0.006	3	78.3	147.7	0.0	0.002	NA	NA	400m.pg1310_o3_native_lto.cx7_gcp_c2s60_4g
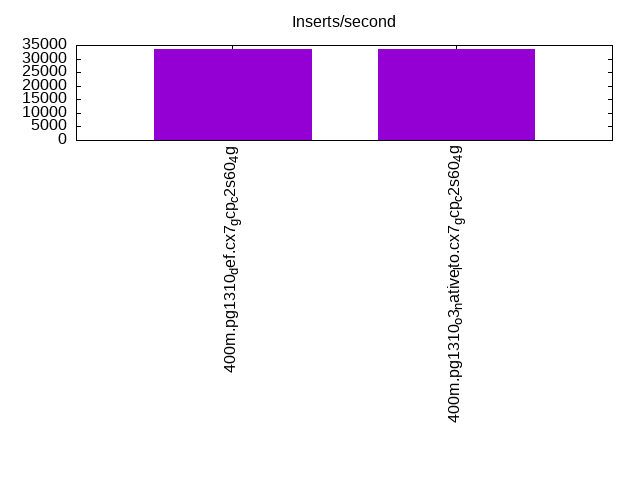
l.i1
l.i1: continue load after secondary indexes created. Graphs for performance per 1-second interval are here.
Average throughput:
Insert response time histogram: each cell has the percentage of responses that take <= the time in the header and max is the max response time in seconds. For the max column values in the top 25% of the range have a red background and in the bottom 25% of the range have a green background. The red background is not used when the min value is within 80% of the max value.
| dbms | 256us | 1ms | 4ms | 16ms | 64ms | 256ms | 1s | 4s | 16s | gt | max |
|---|---|---|---|---|---|---|---|---|---|---|---|
| pg1310_def.cx7_gcp_c2s60_4g | 0.081 | 5.977 | 88.479 | 5.462 | 0.001 | 0.329 | |||||
| pg1310_o3_native_lto.cx7_gcp_c2s60_4g | 0.209 | 6.256 | 88.214 | 5.320 | 0.001 | 0.650 |
Performance metrics for the DBMS listed above. Some are normalized by throughput, others are not. Legend for results is here.
ips	qps	rps	rmbps	wps	wmbps	rpq	rkbpq	wpi	wkbpi	csps	cpups	cspq	cpupq	dbgb1	dbgb2	rss	maxop	p50	p99	tag
33350	0	70838	655.1	60775.1	591.0	2.124	20.114	1.822	18.147	129685	12.8	3.889	115	170.2	239.4	0.0	0.329	1698	749	400m.pg1310_def.cx7_gcp_c2s60_4g
33667	0	70250	656.6	61298.0	596.1	2.087	19.972	1.821	18.131	130376	12.6	3.872	112	170.2	241.6	0.0	0.650	1698	749	400m.pg1310_o3_native_lto.cx7_gcp_c2s60_4g
q100.1
q100.1: range queries with 100 insert/s per client. Graphs for performance per 1-second interval are here.
Average throughput:
Query response time histogram: each cell has the percentage of responses that take <= the time in the header and max is the max response time in seconds. For max values in the top 25% of the range have a red background and in the bottom 25% of the range have a green background. The red background is not used when the min value is within 80% of the max value.
| dbms | 256us | 1ms | 4ms | 16ms | 64ms | 256ms | 1s | 4s | 16s | gt | max |
|---|---|---|---|---|---|---|---|---|---|---|---|
| pg1310_def.cx7_gcp_c2s60_4g | 99.907 | 0.090 | 0.002 | 0.001 | nonzero | 0.027 | |||||
| pg1310_o3_native_lto.cx7_gcp_c2s60_4g | 99.927 | 0.070 | 0.002 | 0.001 | nonzero | nonzero | 0.230 |
Insert response time histogram: each cell has the percentage of responses that take <= the time in the header and max is the max response time in seconds. For max values in the top 25% of the range have a red background and in the bottom 25% of the range have a green background. The red background is not used when the min value is within 80% of the max value.
| dbms | 256us | 1ms | 4ms | 16ms | 64ms | 256ms | 1s | 4s | 16s | gt | max |
|---|---|---|---|---|---|---|---|---|---|---|---|
| pg1310_def.cx7_gcp_c2s60_4g | 0.485 | 99.464 | 0.026 | 0.025 | 0.636 | ||||||
| pg1310_o3_native_lto.cx7_gcp_c2s60_4g | 0.572 | 99.251 | 0.111 | 0.065 | 0.426 |
Performance metrics for the DBMS listed above. Some are normalized by throughput, others are not. Legend for results is here.
ips	qps	rps	rmbps	wps	wmbps	rpq	rkbpq	wpi	wkbpi	csps	cpups	cspq	cpupq	dbgb1	dbgb2	rss	maxop	p50	p99	tag
1976	189230	3984	39.6	4114.7	52.0	0.021	0.214	2.083	26.940	676219	63.0	3.574	100	171.1	217.2	0.0	0.027	9386	9018	400m.pg1310_def.cx7_gcp_c2s60_4g
1976	200022	4026	40.0	4149.8	51.4	0.020	0.205	2.100	26.616	711185	62.7	3.556	94	171.1	219.8	0.0	0.230	9946	9494	400m.pg1310_o3_native_lto.cx7_gcp_c2s60_4g
q500.1
q500.1: range queries with 500 insert/s per client. Graphs for performance per 1-second interval are here.
Average throughput:
Query response time histogram: each cell has the percentage of responses that take <= the time in the header and max is the max response time in seconds. For max values in the top 25% of the range have a red background and in the bottom 25% of the range have a green background. The red background is not used when the min value is within 80% of the max value.
| dbms | 256us | 1ms | 4ms | 16ms | 64ms | 256ms | 1s | 4s | 16s | gt | max |
|---|---|---|---|---|---|---|---|---|---|---|---|
| pg1310_def.cx7_gcp_c2s60_4g | 99.651 | 0.337 | 0.011 | 0.001 | nonzero | 0.027 | |||||
| pg1310_o3_native_lto.cx7_gcp_c2s60_4g | 99.694 | 0.294 | 0.011 | 0.001 | nonzero | 0.028 |
Insert response time histogram: each cell has the percentage of responses that take <= the time in the header and max is the max response time in seconds. For max values in the top 25% of the range have a red background and in the bottom 25% of the range have a green background. The red background is not used when the min value is within 80% of the max value.
| dbms | 256us | 1ms | 4ms | 16ms | 64ms | 256ms | 1s | 4s | 16s | gt | max |
|---|---|---|---|---|---|---|---|---|---|---|---|
| pg1310_def.cx7_gcp_c2s60_4g | 0.531 | 99.457 | 0.013 | 0.148 | |||||||
| pg1310_o3_native_lto.cx7_gcp_c2s60_4g | 0.563 | 99.417 | 0.020 | 0.152 |
Performance metrics for the DBMS listed above. Some are normalized by throughput, others are not. Legend for results is here.
ips	qps	rps	rmbps	wps	wmbps	rpq	rkbpq	wpi	wkbpi	csps	cpups	cspq	cpupq	dbgb1	dbgb2	rss	maxop	p50	p99	tag
9885	192301	18450	186.8	19535.4	208.6	0.096	0.994	1.976	21.613	665046	65.6	3.458	102	176.0	219.6	0.0	0.027	9525	8906	400m.pg1310_def.cx7_gcp_c2s60_4g
9885	202718	18271	186.2	19566.9	209.7	0.090	0.940	1.980	21.721	697248	65.6	3.439	97	176.0	220.0	0.0	0.028	10053	9381	400m.pg1310_o3_native_lto.cx7_gcp_c2s60_4g
q1000.1
q1000.1: range queries with 1000 insert/s per client. Graphs for performance per 1-second interval are here.
Average throughput:
Query response time histogram: each cell has the percentage of responses that take <= the time in the header and max is the max response time in seconds. For max values in the top 25% of the range have a red background and in the bottom 25% of the range have a green background. The red background is not used when the min value is within 80% of the max value.
| dbms | 256us | 1ms | 4ms | 16ms | 64ms | 256ms | 1s | 4s | 16s | gt | max |
|---|---|---|---|---|---|---|---|---|---|---|---|
| pg1310_def.cx7_gcp_c2s60_4g | 99.425 | 0.553 | 0.021 | 0.001 | nonzero | 0.043 | |||||
| pg1310_o3_native_lto.cx7_gcp_c2s60_4g | 99.480 | 0.500 | 0.019 | 0.001 | nonzero | 0.036 |
Insert response time histogram: each cell has the percentage of responses that take <= the time in the header and max is the max response time in seconds. For max values in the top 25% of the range have a red background and in the bottom 25% of the range have a green background. The red background is not used when the min value is within 80% of the max value.
| dbms | 256us | 1ms | 4ms | 16ms | 64ms | 256ms | 1s | 4s | 16s | gt | max |
|---|---|---|---|---|---|---|---|---|---|---|---|
| pg1310_def.cx7_gcp_c2s60_4g | 1.869 | 92.868 | 5.259 | 0.003 | 0.583 | ||||||
| pg1310_o3_native_lto.cx7_gcp_c2s60_4g | 1.965 | 92.903 | 5.131 | 0.001 | 0.506 |
Performance metrics for the DBMS listed above. Some are normalized by throughput, others are not. Legend for results is here.
ips	qps	rps	rmbps	wps	wmbps	rpq	rkbpq	wpi	wkbpi	csps	cpups	cspq	cpupq	dbgb1	dbgb2	rss	maxop	p50	p99	tag
19651	215653	37663	381.7	37319.1	401.4	0.175	1.812	1.899	20.919	673174	69.7	3.122	97	189.4	249.8	0.0	0.043	10692	8039	400m.pg1310_def.cx7_gcp_c2s60_4g
19672	229618	38012	384.4	37321.3	400.0	0.166	1.714	1.897	20.822	711809	69.6	3.100	91	189.4	249.9	0.0	0.036	11400	8346	400m.pg1310_o3_native_lto.cx7_gcp_c2s60_4g
l.i0
l.i0: load without secondary indexes
Performance metrics for all DBMS, not just the ones listed above. Some are normalized by throughput, others are not. Legend for results is here.
ips	qps	rps	rmbps	wps	wmbps	rpq	rkbpq	wpi	wkbpi	csps	cpups	cspq	cpupq	dbgb1	dbgb2	rss	maxop	p50	p99	tag
1092896	0	189	3.7	2134.8	456.6	0.000	0.003	0.002	0.428	297047	57.5	0.272	16	43.0	112.5	NA	1.169	60962	3896	400m.pg1310_def.cx7_gcp_c2s60_4g
1101928	0	132	3.8	2161.3	466.1	0.000	0.004	0.002	0.433	330578	56.9	0.300	15	43.0	112.5	0.0	1.307	61632	10793	400m.pg1310_o3_native_lto.cx7_gcp_c2s60_4g
l.x
l.x: create secondary indexes
Performance metrics for all DBMS, not just the ones listed above. Some are normalized by throughput, others are not. Legend for results is here.
ips	qps	rps	rmbps	wps	wmbps	rpq	rkbpq	wpi	wkbpi	csps	cpups	cspq	cpupq	dbgb1	dbgb2	rss	maxop	p50	p99	tag
303796	0	1520	43.7	466.9	104.5	0.005	0.147	0.002	0.352	1745	3.4	0.006	3	78.3	147.3	0.0	0.002	NA	NA	400m.pg1310_def.cx7_gcp_c2s60_4g
308243	0	1726	42.0	439.0	103.9	0.006	0.139	0.001	0.345	1903	3.4	0.006	3	78.3	147.7	0.0	0.002	NA	NA	400m.pg1310_o3_native_lto.cx7_gcp_c2s60_4g
l.i1
l.i1: continue load after secondary indexes created
Performance metrics for all DBMS, not just the ones listed above. Some are normalized by throughput, others are not. Legend for results is here.
ips	qps	rps	rmbps	wps	wmbps	rpq	rkbpq	wpi	wkbpi	csps	cpups	cspq	cpupq	dbgb1	dbgb2	rss	maxop	p50	p99	tag
33350	0	70838	655.1	60775.1	591.0	2.124	20.114	1.822	18.147	129685	12.8	3.889	115	170.2	239.4	0.0	0.329	1698	749	400m.pg1310_def.cx7_gcp_c2s60_4g
33667	0	70250	656.6	61298.0	596.1	2.087	19.972	1.821	18.131	130376	12.6	3.872	112	170.2	241.6	0.0	0.650	1698	749	400m.pg1310_o3_native_lto.cx7_gcp_c2s60_4g
q100.1
q100.1: range queries with 100 insert/s per client
Performance metrics for all DBMS, not just the ones listed above. Some are normalized by throughput, others are not. Legend for results is here.
ips	qps	rps	rmbps	wps	wmbps	rpq	rkbpq	wpi	wkbpi	csps	cpups	cspq	cpupq	dbgb1	dbgb2	rss	maxop	p50	p99	tag
1976	189230	3984	39.6	4114.7	52.0	0.021	0.214	2.083	26.940	676219	63.0	3.574	100	171.1	217.2	0.0	0.027	9386	9018	400m.pg1310_def.cx7_gcp_c2s60_4g
1976	200022	4026	40.0	4149.8	51.4	0.020	0.205	2.100	26.616	711185	62.7	3.556	94	171.1	219.8	0.0	0.230	9946	9494	400m.pg1310_o3_native_lto.cx7_gcp_c2s60_4g
q500.1
q500.1: range queries with 500 insert/s per client
Performance metrics for all DBMS, not just the ones listed above. Some are normalized by throughput, others are not. Legend for results is here.
ips	qps	rps	rmbps	wps	wmbps	rpq	rkbpq	wpi	wkbpi	csps	cpups	cspq	cpupq	dbgb1	dbgb2	rss	maxop	p50	p99	tag
9885	192301	18450	186.8	19535.4	208.6	0.096	0.994	1.976	21.613	665046	65.6	3.458	102	176.0	219.6	0.0	0.027	9525	8906	400m.pg1310_def.cx7_gcp_c2s60_4g
9885	202718	18271	186.2	19566.9	209.7	0.090	0.940	1.980	21.721	697248	65.6	3.439	97	176.0	220.0	0.0	0.028	10053	9381	400m.pg1310_o3_native_lto.cx7_gcp_c2s60_4g
q1000.1
q1000.1: range queries with 1000 insert/s per client
Performance metrics for all DBMS, not just the ones listed above. Some are normalized by throughput, others are not. Legend for results is here.
ips	qps	rps	rmbps	wps	wmbps	rpq	rkbpq	wpi	wkbpi	csps	cpups	cspq	cpupq	dbgb1	dbgb2	rss	maxop	p50	p99	tag
19651	215653	37663	381.7	37319.1	401.4	0.175	1.812	1.899	20.919	673174	69.7	3.122	97	189.4	249.8	0.0	0.043	10692	8039	400m.pg1310_def.cx7_gcp_c2s60_4g
19672	229618	38012	384.4	37321.3	400.0	0.166	1.714	1.897	20.822	711809	69.6	3.100	91	189.4	249.9	0.0	0.036	11400	8346	400m.pg1310_o3_native_lto.cx7_gcp_c2s60_4g
l.i0
- l.i0: load without secondary indexes
- Legend for results is here.
- Each entry lists the percentage of responses that fit in that bucket (slower than max time for previous bucket, faster than min time for next bucket).
Insert response time histogram
256us	1ms	4ms	16ms	64ms	256ms	1s	4s	16s	gt	max	tag
0.000	23.405	73.424	3.100	0.027	0.029	0.014	0.001	0.000	0.000	1.169	pg1310_def.cx7_gcp_c2s60_4g
0.000	28.161	68.546	3.218	0.029	0.031	0.014	0.001	0.000	0.000	1.307	pg1310_o3_native_lto.cx7_gcp_c2s60_4g
l.x
- l.x: create secondary indexes
- Legend for results is here.
- Each entry lists the percentage of responses that fit in that bucket (slower than max time for previous bucket, faster than min time for next bucket).
TODO - determine whether there is data for create index response time
l.i1
- l.i1: continue load after secondary indexes created
- Legend for results is here.
- Each entry lists the percentage of responses that fit in that bucket (slower than max time for previous bucket, faster than min time for next bucket).
Insert response time histogram
256us	1ms	4ms	16ms	64ms	256ms	1s	4s	16s	gt	max	tag
0.000	0.000	0.081	5.977	88.479	5.462	0.001	0.000	0.000	0.000	0.329	pg1310_def.cx7_gcp_c2s60_4g
0.000	0.000	0.209	6.256	88.214	5.320	0.001	0.000	0.000	0.000	0.650	pg1310_o3_native_lto.cx7_gcp_c2s60_4g
q100.1
- q100.1: range queries with 100 insert/s per client
- Legend for results is here.
- Each entry lists the percentage of responses that fit in that bucket (slower than max time for previous bucket, faster than min time for next bucket).
Query response time histogram
256us	1ms	4ms	16ms	64ms	256ms	1s	4s	16s	gt	max	tag
99.907	0.090	0.002	0.001	nonzero	0.000	0.000	0.000	0.000	0.000	0.027	pg1310_def.cx7_gcp_c2s60_4g
99.927	0.070	0.002	0.001	nonzero	nonzero	0.000	0.000	0.000	0.000	0.230	pg1310_o3_native_lto.cx7_gcp_c2s60_4g
Insert response time histogram
256us	1ms	4ms	16ms	64ms	256ms	1s	4s	16s	gt	max	tag
0.000	0.000	0.000	0.485	99.464	0.026	0.025	0.000	0.000	0.000	0.636	pg1310_def.cx7_gcp_c2s60_4g
0.000	0.000	0.000	0.572	99.251	0.111	0.065	0.000	0.000	0.000	0.426	pg1310_o3_native_lto.cx7_gcp_c2s60_4g
q500.1
- q500.1: range queries with 500 insert/s per client
- Legend for results is here.
- Each entry lists the percentage of responses that fit in that bucket (slower than max time for previous bucket, faster than min time for next bucket).
Query response time histogram
256us	1ms	4ms	16ms	64ms	256ms	1s	4s	16s	gt	max	tag
99.651	0.337	0.011	0.001	nonzero	0.000	0.000	0.000	0.000	0.000	0.027	pg1310_def.cx7_gcp_c2s60_4g
99.694	0.294	0.011	0.001	nonzero	0.000	0.000	0.000	0.000	0.000	0.028	pg1310_o3_native_lto.cx7_gcp_c2s60_4g
Insert response time histogram
256us	1ms	4ms	16ms	64ms	256ms	1s	4s	16s	gt	max	tag
0.000	0.000	0.000	0.531	99.457	0.013	0.000	0.000	0.000	0.000	0.148	pg1310_def.cx7_gcp_c2s60_4g
0.000	0.000	0.000	0.563	99.417	0.020	0.000	0.000	0.000	0.000	0.152	pg1310_o3_native_lto.cx7_gcp_c2s60_4g
q1000.1
- q1000.1: range queries with 1000 insert/s per client
- Legend for results is here.
- Each entry lists the percentage of responses that fit in that bucket (slower than max time for previous bucket, faster than min time for next bucket).
Query response time histogram
256us	1ms	4ms	16ms	64ms	256ms	1s	4s	16s	gt	max	tag
99.425	0.553	0.021	0.001	nonzero	0.000	0.000	0.000	0.000	0.000	0.043	pg1310_def.cx7_gcp_c2s60_4g
99.480	0.500	0.019	0.001	nonzero	0.000	0.000	0.000	0.000	0.000	0.036	pg1310_o3_native_lto.cx7_gcp_c2s60_4g
Insert response time histogram
256us	1ms	4ms	16ms	64ms	256ms	1s	4s	16s	gt	max	tag
0.000	0.000	0.000	1.869	92.868	5.259	0.003	0.000	0.000	0.000	0.583	pg1310_def.cx7_gcp_c2s60_4g
0.000	0.000	0.000	1.965	92.903	5.131	0.001	0.000	0.000	0.000	0.506	pg1310_o3_native_lto.cx7_gcp_c2s60_4g