Introduction
This is a report for the insert benchmark with 400M docs and 20 client(s). It is generated by scripts (bash, awk, sed) and Tufte might not be impressed. An overview of the insert benchmark is here and a short update is here. Below, by DBMS, I mean DBMS+version.config. An example is my8020.c10b40 where my means MySQL, 8020 is version 8.0.20 and c10b40 is the name for the configuration file.
The test server is a c2-standard-60 from GCP with 30 cores, hyperthreading disabled, 240G RAM and 3T from XFS and SW RAID 0 striped over 8 local NVMe drives. The benchmark was run with 20 clients and there were 1 or 2 connections per client (1 for queries, 1 for inserts). The benchmark loads 400M rows without secondary indexes, creates secondary indexes, loads another 400M rows then does 3 read+write tests for one hour each that do queries as fast as possible with 100, 500 and then 1000 writes/second/client concurrent with the queries. Each read-write test runs for 1800 seconds. The test was configured to use a table per client. The database fits in the OS page cache but not the DBMS buffer pool. Clients and the DBMS share one server. The per-database configs are in the per-database subdirectories here.
The tested DBMS are:
- pg1310_def.cx7_gcp_c2s60_4g - Postgres 13.10, the cx7_gcp_c2s60_4g config and a default build that used -O2
- pg1310_o3_native_lto.cx7_gcp_c2s60_4g - Postgres 13.10, the cx7_gcp_c2s60_4g config and a build that uses -O3 -march=native -mtune=native -flto (link-time optimization)
Contents
- Summary
- l.i0: load without secondary indexes
- l.x: create secondary indexes
- l.i1: continue load after secondary indexes created
- q100.1: range queries with 100 insert/s per client
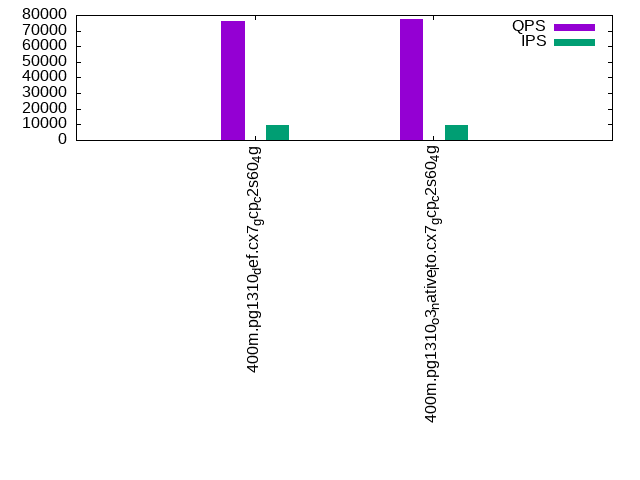
- q500.1: range queries with 500 insert/s per client
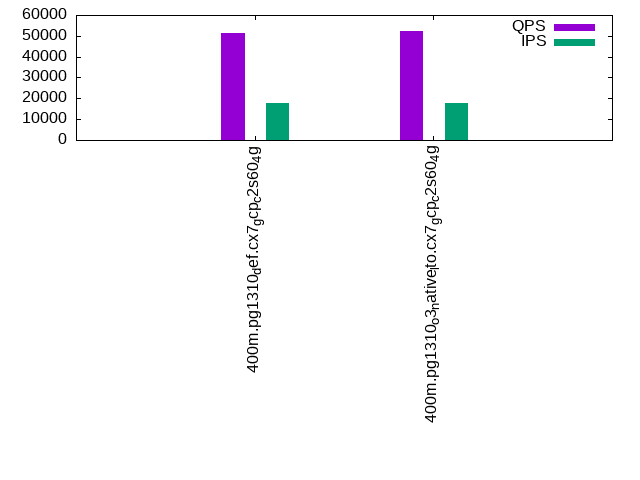
- q1000.1: range queries with 1000 insert/s per client
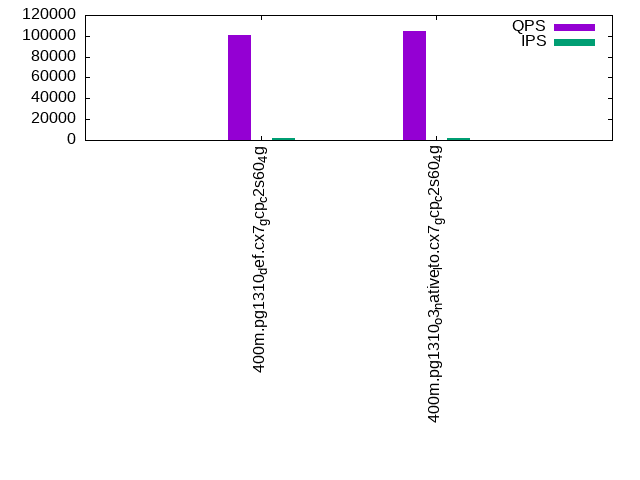
Summary
The numbers are inserts/s for l.i0 and l.i1, indexed docs (or rows) /s for l.x and queries/s for q*.2. The values are the average rate over the entire test for inserts (IPS) and queries (QPS). The range of values for IPS and QPS is split into 3 parts: bottom 25%, middle 50%, top 25%. Values in the bottom 25% have a red background, values in the top 25% have a green background and values in the middle have no color. A gray background is used for values that can be ignored because the DBMS did not sustain the target insert rate. Red backgrounds are not used when the minimum value is within 80% of the max value.
| dbms | l.i0 | l.x | l.i1 | q100.1 | q500.1 | q1000.1 |
|---|---|---|---|---|---|---|
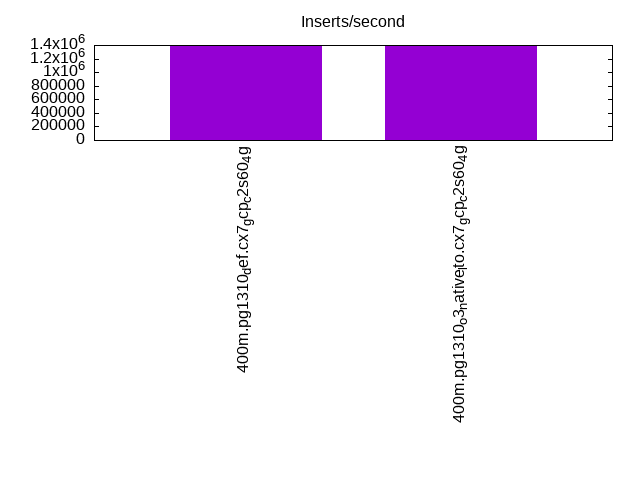
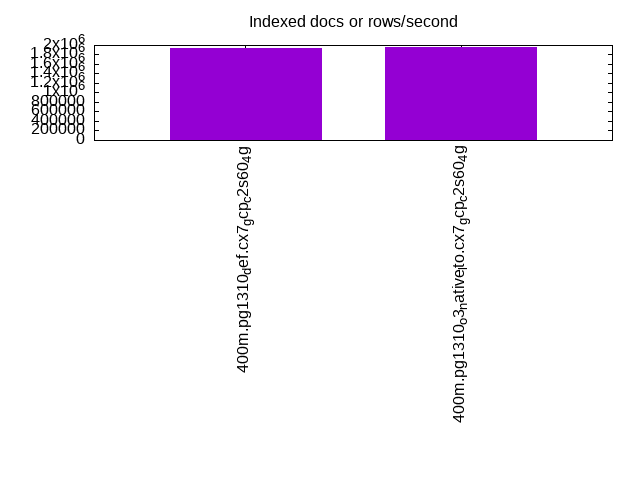
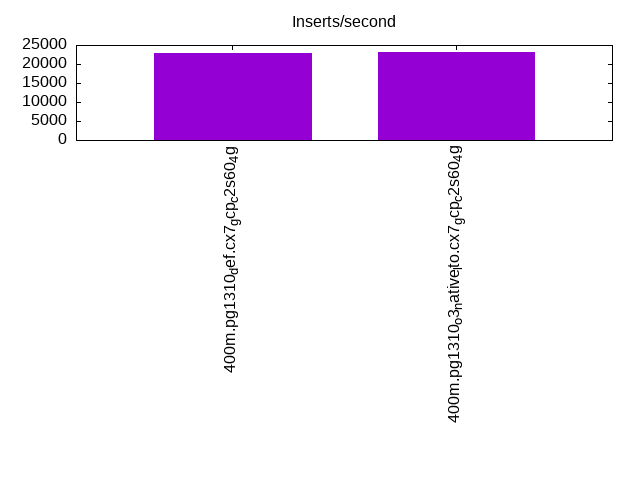
| 400m.pg1310_def.cx7_gcp_c2s60_4g | 1393728 | 1932850 | 22990 | 100937 | 75843 | 51228 |
| 400m.pg1310_o3_native_lto.cx7_gcp_c2s60_4g | 1398601 | 1951707 | 23136 | 104165 | 77297 | 52192 |
This lists the average rate of inserts/s for the tests that do inserts concurrent with queries. For such tests the query rate is listed in the table above. The read+write tests are setup so that the insert rate should match the target rate every second. Cells that are not at least 95% of the target have a red background to indicate a failure to satisfy the target.
| dbms | q100.1 | q500.1 | q1000.1 |
|---|---|---|---|
| pg1310_def.cx7_gcp_c2s60_4g | 1976 | 9890 | 17937 |
| pg1310_o3_native_lto.cx7_gcp_c2s60_4g | 1976 | 9885 | 17973 |
| target | 2000 | 10000 | 20000 |
l.i0
l.i0: load without secondary indexes. Graphs for performance per 1-second interval are here.
Average throughput:
Insert response time histogram: each cell has the percentage of responses that take <= the time in the header and max is the max response time in seconds. For the max column values in the top 25% of the range have a red background and in the bottom 25% of the range have a green background. The red background is not used when the min value is within 80% of the max value.
| dbms | 256us | 1ms | 4ms | 16ms | 64ms | 256ms | 1s | 4s | 16s | gt | max |
|---|---|---|---|---|---|---|---|---|---|---|---|
| pg1310_def.cx7_gcp_c2s60_4g | 64.146 | 34.687 | 1.082 | 0.040 | 0.031 | 0.012 | 0.001 | 1.283 | |||
| pg1310_o3_native_lto.cx7_gcp_c2s60_4g | 61.210 | 37.779 | 0.929 | 0.045 | 0.023 | 0.014 | 0.761 |
Performance metrics for the DBMS listed above. Some are normalized by throughput, others are not. Legend for results is here.
ips	qps	rps	rmbps	wps	wmbps	rpq	rkbpq	wpi	wkbpi	csps	cpups	cspq	cpupq	dbgb1	dbgb2	rss	maxop	p50	p99	tag
1393728	0	553	11.6	9785.6	590.8	0.000	0.009	0.007	0.434	199408	59.8	0.143	13	38.3	103.2	NA	1.283	79913	9489	400m.pg1310_def.cx7_gcp_c2s60_4g
1398601	0	610	10.5	9850.6	592.3	0.000	0.008	0.007	0.434	232732	58.6	0.166	13	38.3	103.2	NA	0.761	80013	10089	400m.pg1310_o3_native_lto.cx7_gcp_c2s60_4g
l.x
l.x: create secondary indexes.
Average throughput:
Performance metrics for the DBMS listed above. Some are normalized by throughput, others are not. Legend for results is here.
ips	qps	rps	rmbps	wps	wmbps	rpq	rkbpq	wpi	wkbpi	csps	cpups	cspq	cpupq	dbgb1	dbgb2	rss	maxop	p50	p99	tag
1932850	0	11403	275.4	6038.4	729.7	0.006	0.146	0.003	0.387	124010	22.0	0.064	3	73.5	176.8	NA	0.262	NA	NA	400m.pg1310_def.cx7_gcp_c2s60_4g
1951707	0	10241	254.1	5909.0	749.2	0.005	0.133	0.003	0.393	125351	21.7	0.064	3	73.5	176.6	NA	0.247	NA	NA	400m.pg1310_o3_native_lto.cx7_gcp_c2s60_4g
l.i1
l.i1: continue load after secondary indexes created. Graphs for performance per 1-second interval are here.
Average throughput:
Insert response time histogram: each cell has the percentage of responses that take <= the time in the header and max is the max response time in seconds. For the max column values in the top 25% of the range have a red background and in the bottom 25% of the range have a green background. The red background is not used when the min value is within 80% of the max value.
| dbms | 256us | 1ms | 4ms | 16ms | 64ms | 256ms | 1s | 4s | 16s | gt | max |
|---|---|---|---|---|---|---|---|---|---|---|---|
| pg1310_def.cx7_gcp_c2s60_4g | 0.009 | 88.254 | 11.733 | 0.004 | 0.448 | ||||||
| pg1310_o3_native_lto.cx7_gcp_c2s60_4g | 0.005 | 88.408 | 11.583 | 0.004 | 0.408 |
Performance metrics for the DBMS listed above. Some are normalized by throughput, others are not. Legend for results is here.
ips	qps	rps	rmbps	wps	wmbps	rpq	rkbpq	wpi	wkbpi	csps	cpups	cspq	cpupq	dbgb1	dbgb2	rss	maxop	p50	p99	tag
22990	0	70294	727.0	62431.8	603.8	3.058	32.382	2.716	26.895	133359	12.2	5.801	159	163.3	241.7	0.0	0.448	1199	599	400m.pg1310_def.cx7_gcp_c2s60_4g
23136	0	70042	725.7	62796.7	607.2	3.027	32.119	2.714	26.874	134068	11.9	5.795	154	163.3	242.0	0.0	0.408	1199	599	400m.pg1310_o3_native_lto.cx7_gcp_c2s60_4g
q100.1
q100.1: range queries with 100 insert/s per client. Graphs for performance per 1-second interval are here.
Average throughput:
Query response time histogram: each cell has the percentage of responses that take <= the time in the header and max is the max response time in seconds. For max values in the top 25% of the range have a red background and in the bottom 25% of the range have a green background. The red background is not used when the min value is within 80% of the max value.
| dbms | 256us | 1ms | 4ms | 16ms | 64ms | 256ms | 1s | 4s | 16s | gt | max |
|---|---|---|---|---|---|---|---|---|---|---|---|
| pg1310_def.cx7_gcp_c2s60_4g | 66.694 | 33.053 | 0.247 | 0.005 | nonzero | nonzero | nonzero | 0.498 | |||
| pg1310_o3_native_lto.cx7_gcp_c2s60_4g | 67.809 | 31.951 | 0.234 | 0.006 | nonzero | 0.056 |
Insert response time histogram: each cell has the percentage of responses that take <= the time in the header and max is the max response time in seconds. For max values in the top 25% of the range have a red background and in the bottom 25% of the range have a green background. The red background is not used when the min value is within 80% of the max value.
| dbms | 256us | 1ms | 4ms | 16ms | 64ms | 256ms | 1s | 4s | 16s | gt | max |
|---|---|---|---|---|---|---|---|---|---|---|---|
| pg1310_def.cx7_gcp_c2s60_4g | 0.007 | 99.856 | 0.115 | 0.022 | 0.549 | ||||||
| pg1310_o3_native_lto.cx7_gcp_c2s60_4g | 0.014 | 99.911 | 0.075 | 0.107 |
Performance metrics for the DBMS listed above. Some are normalized by throughput, others are not. Legend for results is here.
ips	qps	rps	rmbps	wps	wmbps	rpq	rkbpq	wpi	wkbpi	csps	cpups	cspq	cpupq	dbgb1	dbgb2	rss	maxop	p50	p99	tag
1976	100937	88330	760.3	6316.9	71.6	0.875	7.713	3.197	37.118	472009	37.3	4.676	111	163.9	217.3	0.0	0.498	5018	4443	400m.pg1310_def.cx7_gcp_c2s60_4g
1976	104165	91165	782.2	6321.9	71.2	0.875	7.690	3.200	36.909	486847	36.2	4.674	104	163.9	220.8	0.0	0.056	5274	4653	400m.pg1310_o3_native_lto.cx7_gcp_c2s60_4g
q500.1
q500.1: range queries with 500 insert/s per client. Graphs for performance per 1-second interval are here.
Average throughput:
Query response time histogram: each cell has the percentage of responses that take <= the time in the header and max is the max response time in seconds. For max values in the top 25% of the range have a red background and in the bottom 25% of the range have a green background. The red background is not used when the min value is within 80% of the max value.
| dbms | 256us | 1ms | 4ms | 16ms | 64ms | 256ms | 1s | 4s | 16s | gt | max |
|---|---|---|---|---|---|---|---|---|---|---|---|
| pg1310_def.cx7_gcp_c2s60_4g | 60.007 | 38.421 | 1.439 | 0.128 | 0.006 | nonzero | 0.111 | ||||
| pg1310_o3_native_lto.cx7_gcp_c2s60_4g | 60.629 | 37.757 | 1.475 | 0.132 | 0.006 | 0.050 |
Insert response time histogram: each cell has the percentage of responses that take <= the time in the header and max is the max response time in seconds. For max values in the top 25% of the range have a red background and in the bottom 25% of the range have a green background. The red background is not used when the min value is within 80% of the max value.
| dbms | 256us | 1ms | 4ms | 16ms | 64ms | 256ms | 1s | 4s | 16s | gt | max |
|---|---|---|---|---|---|---|---|---|---|---|---|
| pg1310_def.cx7_gcp_c2s60_4g | 0.006 | 92.338 | 7.656 | 0.255 | |||||||
| pg1310_o3_native_lto.cx7_gcp_c2s60_4g | 0.007 | 91.724 | 8.269 | nonzero | 0.305 |
Performance metrics for the DBMS listed above. Some are normalized by throughput, others are not. Legend for results is here.
ips	qps	rps	rmbps	wps	wmbps	rpq	rkbpq	wpi	wkbpi	csps	cpups	cspq	cpupq	dbgb1	dbgb2	rss	maxop	p50	p99	tag
9890	75843	94524	888.8	29286.3	308.8	1.246	12.000	2.961	31.975	412920	36.5	5.444	144	167.4	226.1	0.0	0.111	4011	1998	400m.pg1310_def.cx7_gcp_c2s60_4g
9885	77297	97424	923.7	29206.8	308.8	1.260	12.237	2.955	31.988	420631	35.4	5.442	137	167.4	226.0	0.0	0.050	4107	1997	400m.pg1310_o3_native_lto.cx7_gcp_c2s60_4g
q1000.1
q1000.1: range queries with 1000 insert/s per client. Graphs for performance per 1-second interval are here.
Average throughput:
Query response time histogram: each cell has the percentage of responses that take <= the time in the header and max is the max response time in seconds. For max values in the top 25% of the range have a red background and in the bottom 25% of the range have a green background. The red background is not used when the min value is within 80% of the max value.
| dbms | 256us | 1ms | 4ms | 16ms | 64ms | 256ms | 1s | 4s | 16s | gt | max |
|---|---|---|---|---|---|---|---|---|---|---|---|
| pg1310_def.cx7_gcp_c2s60_4g | 53.438 | 42.046 | 3.877 | 0.598 | 0.042 | nonzero | 0.088 | ||||
| pg1310_o3_native_lto.cx7_gcp_c2s60_4g | 53.576 | 41.971 | 3.824 | 0.589 | 0.041 | nonzero | 0.187 |
Insert response time histogram: each cell has the percentage of responses that take <= the time in the header and max is the max response time in seconds. For max values in the top 25% of the range have a red background and in the bottom 25% of the range have a green background. The red background is not used when the min value is within 80% of the max value.
| dbms | 256us | 1ms | 4ms | 16ms | 64ms | 256ms | 1s | 4s | 16s | gt | max |
|---|---|---|---|---|---|---|---|---|---|---|---|
| pg1310_def.cx7_gcp_c2s60_4g | 0.010 | 82.433 | 17.556 | 0.002 | 0.301 | ||||||
| pg1310_o3_native_lto.cx7_gcp_c2s60_4g | 0.001 | 82.416 | 17.581 | 0.002 | 0.577 |
Performance metrics for the DBMS listed above. Some are normalized by throughput, others are not. Legend for results is here.
ips	qps	rps	rmbps	wps	wmbps	rpq	rkbpq	wpi	wkbpi	csps	cpups	cspq	cpupq	dbgb1	dbgb2	rss	maxop	p50	p99	tag
17937	51228	96052	941.1	51321.0	541.5	1.875	18.812	2.861	30.911	360207	36.1	7.031	211	179.6	257.5	0.0	0.088	2670	1390	400m.pg1310_def.cx7_gcp_c2s60_4g
17973	52192	97678	953.8	51515.2	539.7	1.872	18.713	2.866	30.746	365959	35.2	7.012	202	179.6	257.4	0.0	0.187	2733	1422	400m.pg1310_o3_native_lto.cx7_gcp_c2s60_4g
l.i0
l.i0: load without secondary indexes
Performance metrics for all DBMS, not just the ones listed above. Some are normalized by throughput, others are not. Legend for results is here.
ips	qps	rps	rmbps	wps	wmbps	rpq	rkbpq	wpi	wkbpi	csps	cpups	cspq	cpupq	dbgb1	dbgb2	rss	maxop	p50	p99	tag
1393728	0	553	11.6	9785.6	590.8	0.000	0.009	0.007	0.434	199408	59.8	0.143	13	38.3	103.2	NA	1.283	79913	9489	400m.pg1310_def.cx7_gcp_c2s60_4g
1398601	0	610	10.5	9850.6	592.3	0.000	0.008	0.007	0.434	232732	58.6	0.166	13	38.3	103.2	NA	0.761	80013	10089	400m.pg1310_o3_native_lto.cx7_gcp_c2s60_4g
l.x
l.x: create secondary indexes
Performance metrics for all DBMS, not just the ones listed above. Some are normalized by throughput, others are not. Legend for results is here.
ips	qps	rps	rmbps	wps	wmbps	rpq	rkbpq	wpi	wkbpi	csps	cpups	cspq	cpupq	dbgb1	dbgb2	rss	maxop	p50	p99	tag
1932850	0	11403	275.4	6038.4	729.7	0.006	0.146	0.003	0.387	124010	22.0	0.064	3	73.5	176.8	NA	0.262	NA	NA	400m.pg1310_def.cx7_gcp_c2s60_4g
1951707	0	10241	254.1	5909.0	749.2	0.005	0.133	0.003	0.393	125351	21.7	0.064	3	73.5	176.6	NA	0.247	NA	NA	400m.pg1310_o3_native_lto.cx7_gcp_c2s60_4g
l.i1
l.i1: continue load after secondary indexes created
Performance metrics for all DBMS, not just the ones listed above. Some are normalized by throughput, others are not. Legend for results is here.
ips	qps	rps	rmbps	wps	wmbps	rpq	rkbpq	wpi	wkbpi	csps	cpups	cspq	cpupq	dbgb1	dbgb2	rss	maxop	p50	p99	tag
22990	0	70294	727.0	62431.8	603.8	3.058	32.382	2.716	26.895	133359	12.2	5.801	159	163.3	241.7	0.0	0.448	1199	599	400m.pg1310_def.cx7_gcp_c2s60_4g
23136	0	70042	725.7	62796.7	607.2	3.027	32.119	2.714	26.874	134068	11.9	5.795	154	163.3	242.0	0.0	0.408	1199	599	400m.pg1310_o3_native_lto.cx7_gcp_c2s60_4g
q100.1
q100.1: range queries with 100 insert/s per client
Performance metrics for all DBMS, not just the ones listed above. Some are normalized by throughput, others are not. Legend for results is here.
ips	qps	rps	rmbps	wps	wmbps	rpq	rkbpq	wpi	wkbpi	csps	cpups	cspq	cpupq	dbgb1	dbgb2	rss	maxop	p50	p99	tag
1976	100937	88330	760.3	6316.9	71.6	0.875	7.713	3.197	37.118	472009	37.3	4.676	111	163.9	217.3	0.0	0.498	5018	4443	400m.pg1310_def.cx7_gcp_c2s60_4g
1976	104165	91165	782.2	6321.9	71.2	0.875	7.690	3.200	36.909	486847	36.2	4.674	104	163.9	220.8	0.0	0.056	5274	4653	400m.pg1310_o3_native_lto.cx7_gcp_c2s60_4g
q500.1
q500.1: range queries with 500 insert/s per client
Performance metrics for all DBMS, not just the ones listed above. Some are normalized by throughput, others are not. Legend for results is here.
ips	qps	rps	rmbps	wps	wmbps	rpq	rkbpq	wpi	wkbpi	csps	cpups	cspq	cpupq	dbgb1	dbgb2	rss	maxop	p50	p99	tag
9890	75843	94524	888.8	29286.3	308.8	1.246	12.000	2.961	31.975	412920	36.5	5.444	144	167.4	226.1	0.0	0.111	4011	1998	400m.pg1310_def.cx7_gcp_c2s60_4g
9885	77297	97424	923.7	29206.8	308.8	1.260	12.237	2.955	31.988	420631	35.4	5.442	137	167.4	226.0	0.0	0.050	4107	1997	400m.pg1310_o3_native_lto.cx7_gcp_c2s60_4g
q1000.1
q1000.1: range queries with 1000 insert/s per client
Performance metrics for all DBMS, not just the ones listed above. Some are normalized by throughput, others are not. Legend for results is here.
ips	qps	rps	rmbps	wps	wmbps	rpq	rkbpq	wpi	wkbpi	csps	cpups	cspq	cpupq	dbgb1	dbgb2	rss	maxop	p50	p99	tag
17937	51228	96052	941.1	51321.0	541.5	1.875	18.812	2.861	30.911	360207	36.1	7.031	211	179.6	257.5	0.0	0.088	2670	1390	400m.pg1310_def.cx7_gcp_c2s60_4g
17973	52192	97678	953.8	51515.2	539.7	1.872	18.713	2.866	30.746	365959	35.2	7.012	202	179.6	257.4	0.0	0.187	2733	1422	400m.pg1310_o3_native_lto.cx7_gcp_c2s60_4g
l.i0
- l.i0: load without secondary indexes
- Legend for results is here.
- Each entry lists the percentage of responses that fit in that bucket (slower than max time for previous bucket, faster than min time for next bucket).
Insert response time histogram
256us	1ms	4ms	16ms	64ms	256ms	1s	4s	16s	gt	max	tag
0.000	64.146	34.687	1.082	0.040	0.031	0.012	0.001	0.000	0.000	1.283	pg1310_def.cx7_gcp_c2s60_4g
0.000	61.210	37.779	0.929	0.045	0.023	0.014	0.000	0.000	0.000	0.761	pg1310_o3_native_lto.cx7_gcp_c2s60_4g
l.x
- l.x: create secondary indexes
- Legend for results is here.
- Each entry lists the percentage of responses that fit in that bucket (slower than max time for previous bucket, faster than min time for next bucket).
TODO - determine whether there is data for create index response time
l.i1
- l.i1: continue load after secondary indexes created
- Legend for results is here.
- Each entry lists the percentage of responses that fit in that bucket (slower than max time for previous bucket, faster than min time for next bucket).
Insert response time histogram
256us	1ms	4ms	16ms	64ms	256ms	1s	4s	16s	gt	max	tag
0.000	0.000	0.000	0.009	88.254	11.733	0.004	0.000	0.000	0.000	0.448	pg1310_def.cx7_gcp_c2s60_4g
0.000	0.000	0.000	0.005	88.408	11.583	0.004	0.000	0.000	0.000	0.408	pg1310_o3_native_lto.cx7_gcp_c2s60_4g
q100.1
- q100.1: range queries with 100 insert/s per client
- Legend for results is here.
- Each entry lists the percentage of responses that fit in that bucket (slower than max time for previous bucket, faster than min time for next bucket).
Query response time histogram
256us	1ms	4ms	16ms	64ms	256ms	1s	4s	16s	gt	max	tag
66.694	33.053	0.247	0.005	nonzero	nonzero	nonzero	0.000	0.000	0.000	0.498	pg1310_def.cx7_gcp_c2s60_4g
67.809	31.951	0.234	0.006	nonzero	0.000	0.000	0.000	0.000	0.000	0.056	pg1310_o3_native_lto.cx7_gcp_c2s60_4g
Insert response time histogram
256us	1ms	4ms	16ms	64ms	256ms	1s	4s	16s	gt	max	tag
0.000	0.000	0.000	0.007	99.856	0.115	0.022	0.000	0.000	0.000	0.549	pg1310_def.cx7_gcp_c2s60_4g
0.000	0.000	0.000	0.014	99.911	0.075	0.000	0.000	0.000	0.000	0.107	pg1310_o3_native_lto.cx7_gcp_c2s60_4g
q500.1
- q500.1: range queries with 500 insert/s per client
- Legend for results is here.
- Each entry lists the percentage of responses that fit in that bucket (slower than max time for previous bucket, faster than min time for next bucket).
Query response time histogram
256us	1ms	4ms	16ms	64ms	256ms	1s	4s	16s	gt	max	tag
60.007	38.421	1.439	0.128	0.006	nonzero	0.000	0.000	0.000	0.000	0.111	pg1310_def.cx7_gcp_c2s60_4g
60.629	37.757	1.475	0.132	0.006	0.000	0.000	0.000	0.000	0.000	0.050	pg1310_o3_native_lto.cx7_gcp_c2s60_4g
Insert response time histogram
256us	1ms	4ms	16ms	64ms	256ms	1s	4s	16s	gt	max	tag
0.000	0.000	0.000	0.006	92.338	7.656	0.000	0.000	0.000	0.000	0.255	pg1310_def.cx7_gcp_c2s60_4g
0.000	0.000	0.000	0.007	91.724	8.269	nonzero	0.000	0.000	0.000	0.305	pg1310_o3_native_lto.cx7_gcp_c2s60_4g
q1000.1
- q1000.1: range queries with 1000 insert/s per client
- Legend for results is here.
- Each entry lists the percentage of responses that fit in that bucket (slower than max time for previous bucket, faster than min time for next bucket).
Query response time histogram
256us	1ms	4ms	16ms	64ms	256ms	1s	4s	16s	gt	max	tag
53.438	42.046	3.877	0.598	0.042	nonzero	0.000	0.000	0.000	0.000	0.088	pg1310_def.cx7_gcp_c2s60_4g
53.576	41.971	3.824	0.589	0.041	nonzero	0.000	0.000	0.000	0.000	0.187	pg1310_o3_native_lto.cx7_gcp_c2s60_4g
Insert response time histogram
256us	1ms	4ms	16ms	64ms	256ms	1s	4s	16s	gt	max	tag
0.000	0.000	0.000	0.010	82.433	17.556	0.002	0.000	0.000	0.000	0.301	pg1310_def.cx7_gcp_c2s60_4g
0.000	0.000	0.000	0.001	82.416	17.581	0.002	0.000	0.000	0.000	0.577	pg1310_o3_native_lto.cx7_gcp_c2s60_4g