Introduction
This is a report for the insert benchmark with 400M docs and 20 client(s). It is generated by scripts (bash, awk, sed) and Tufte might not be impressed. An overview of the insert benchmark is here and a short update is here. Below, by DBMS, I mean DBMS+version.config. An example is my8020.c10b40 where my means MySQL, 8020 is version 8.0.20 and c10b40 is the name for the configuration file.
The test server is a c2-standard-60 from GCP with 30 cores, hyperthreading disabled, 240G RAM and 3T from XFS and SW RAID 0 striped over 8 local NVMe drives. The benchmark was run with 20 clients and there were 1 or 2 connections per client (1 for queries, 1 for inserts). The benchmark loads 400M rows without secondary indexes, creates secondary indexes, loads another 400M rows then does 3 read+write tests for one hour each that do queries as fast as possible with 100, 500 and then 1000 writes/second/client concurrent with the queries. Each read-write test runs for 1800 seconds. The test was configured to use a table per client. The database is cached by the storage engine and the only IO is for writes. Clients and the DBMS share one server. The per-database configs are in the per-database subdirectories here.
The tested DBMS are:
- pg1214_def.cx7_gcp_c2s60 - Postgres 12.14, the cx7_gcp_c2s60 config and a default build that used -O2
- pg1214_o3_native_lto.cx7_gcp_c2s60 - Postgres 12.14, the cx7_gcp_c2s60 config and a build that uses -O3 -march=native -mtune=native -flto (link-time optimization)
Contents
- Summary
- l.i0: load without secondary indexes
- l.x: create secondary indexes
- l.i1: continue load after secondary indexes created
- q100.1: range queries with 100 insert/s per client
- q500.1: range queries with 500 insert/s per client
- q1000.1: range queries with 1000 insert/s per client
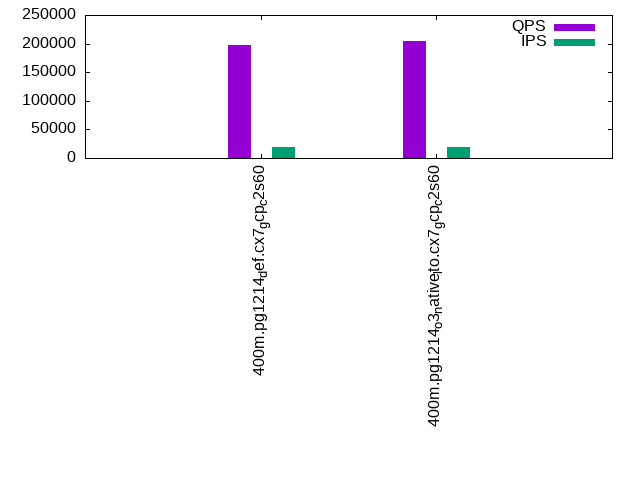
Summary
The numbers are inserts/s for l.i0 and l.i1, indexed docs (or rows) /s for l.x and queries/s for q*.2. The values are the average rate over the entire test for inserts (IPS) and queries (QPS). The range of values for IPS and QPS is split into 3 parts: bottom 25%, middle 50%, top 25%. Values in the bottom 25% have a red background, values in the top 25% have a green background and values in the middle have no color. A gray background is used for values that can be ignored because the DBMS did not sustain the target insert rate. Red backgrounds are not used when the minimum value is within 80% of the max value.
| dbms | l.i0 | l.x | l.i1 | q100.1 | q500.1 | q1000.1 |
|---|---|---|---|---|---|---|
| 400m.pg1214_def.cx7_gcp_c2s60 | 1403509 | 2548408 | 404858 | 191974 | 193981 | 198060 |
| 400m.pg1214_o3_native_lto.cx7_gcp_c2s60 | 1403509 | 2564744 | 403226 | 198992 | 200609 | 204408 |
This lists the average rate of inserts/s for the tests that do inserts concurrent with queries. For such tests the query rate is listed in the table above. The read+write tests are setup so that the insert rate should match the target rate every second. Cells that are not at least 95% of the target have a red background to indicate a failure to satisfy the target.
| dbms | q100.1 | q500.1 | q1000.1 |
|---|---|---|---|
| pg1214_def.cx7_gcp_c2s60 | 1976 | 9885 | 19769 |
| pg1214_o3_native_lto.cx7_gcp_c2s60 | 1976 | 9885 | 19769 |
| target | 2000 | 10000 | 20000 |
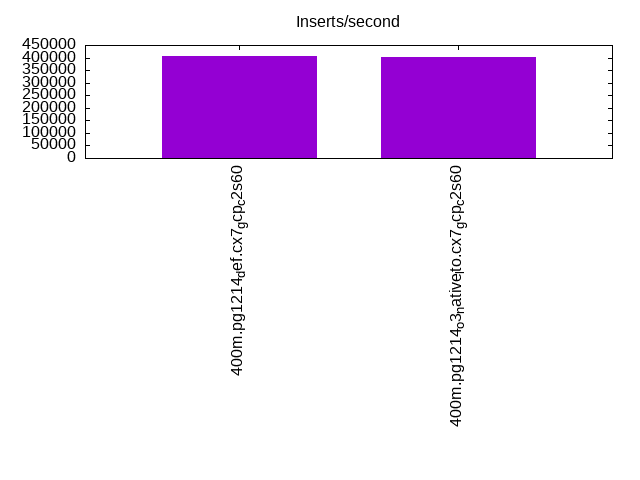
l.i0
l.i0: load without secondary indexes. Graphs for performance per 1-second interval are here.
Average throughput:

Insert response time histogram: each cell has the percentage of responses that take <= the time in the header and max is the max response time in seconds. For the max column values in the top 25% of the range have a red background and in the bottom 25% of the range have a green background. The red background is not used when the min value is within 80% of the max value.
| dbms | 256us | 1ms | 4ms | 16ms | 64ms | 256ms | 1s | 4s | 16s | gt | max |
|---|---|---|---|---|---|---|---|---|---|---|---|
| pg1214_def.cx7_gcp_c2s60 | 61.414 | 37.691 | 0.841 | 0.016 | 0.025 | 0.013 | 0.625 | ||||
| pg1214_o3_native_lto.cx7_gcp_c2s60 | 59.796 | 39.346 | 0.799 | 0.026 | 0.020 | 0.014 | 0.913 |
Performance metrics for the DBMS listed above. Some are normalized by throughput, others are not. Legend for results is here.
ips	qps	rps	rmbps	wps	wmbps	rpq	rkbpq	wpi	wkbpi	csps	cpups	cspq	cpupq	dbgb1	dbgb2	rss	maxop	p50	p99	tag
1403509	0	0	0.0	1843.8	463.0	0.000	0.000	0.001	0.338	209889	60.7	0.150	13	38.3	103.2	NA	0.625	79645	11792	400m.pg1214_def.cx7_gcp_c2s60
1403509	0	0	0.0	1842.3	466.1	0.000	0.000	0.001	0.340	232757	59.6	0.166	13	38.3	103.2	NA	0.913	79746	14484	400m.pg1214_o3_native_lto.cx7_gcp_c2s60
l.x
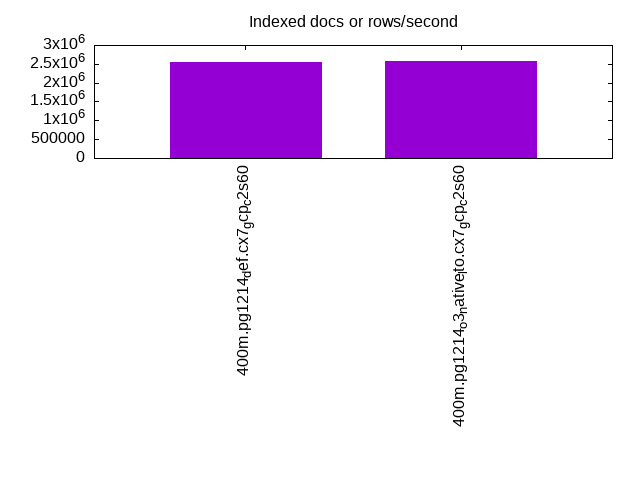
l.x: create secondary indexes.
Average throughput:
Performance metrics for the DBMS listed above. Some are normalized by throughput, others are not. Legend for results is here.
ips	qps	rps	rmbps	wps	wmbps	rpq	rkbpq	wpi	wkbpi	csps	cpups	cspq	cpupq	dbgb1	dbgb2	rss	maxop	p50	p99	tag
2548408	0	8390	107.8	3498.8	855.5	0.003	0.043	0.001	0.344	98070	26.6	0.038	3	73.5	170.5	0.0	0.092	NA	NA	400m.pg1214_def.cx7_gcp_c2s60
2564744	0	8411	112.9	3484.0	856.2	0.003	0.045	0.001	0.342	101553	25.1	0.040	3	73.5	170.5	0.0	0.314	NA	NA	400m.pg1214_o3_native_lto.cx7_gcp_c2s60
l.i1
l.i1: continue load after secondary indexes created. Graphs for performance per 1-second interval are here.
Average throughput:
Insert response time histogram: each cell has the percentage of responses that take <= the time in the header and max is the max response time in seconds. For the max column values in the top 25% of the range have a red background and in the bottom 25% of the range have a green background. The red background is not used when the min value is within 80% of the max value.
| dbms | 256us | 1ms | 4ms | 16ms | 64ms | 256ms | 1s | 4s | 16s | gt | max |
|---|---|---|---|---|---|---|---|---|---|---|---|
| pg1214_def.cx7_gcp_c2s60 | nonzero | 96.245 | 2.090 | 1.622 | 0.032 | 0.011 | nonzero | 1.077 | |||
| pg1214_o3_native_lto.cx7_gcp_c2s60 | 0.004 | 96.022 | 2.295 | 1.631 | 0.040 | 0.008 | 0.819 |
Performance metrics for the DBMS listed above. Some are normalized by throughput, others are not. Legend for results is here.
ips	qps	rps	rmbps	wps	wmbps	rpq	rkbpq	wpi	wkbpi	csps	cpups	cspq	cpupq	dbgb1	dbgb2	rss	maxop	p50	p99	tag
404858	0	4744	43.8	3884.3	496.1	0.012	0.111	0.010	1.255	256974	51.2	0.635	38	163.1	318.4	0.0	1.077	26371	1848	400m.pg1214_def.cx7_gcp_c2s60
403226	0	5405	44.7	3740.0	498.9	0.013	0.114	0.009	1.267	287816	50.4	0.714	37	163.1	318.3	0.0	0.819	26381	1798	400m.pg1214_o3_native_lto.cx7_gcp_c2s60
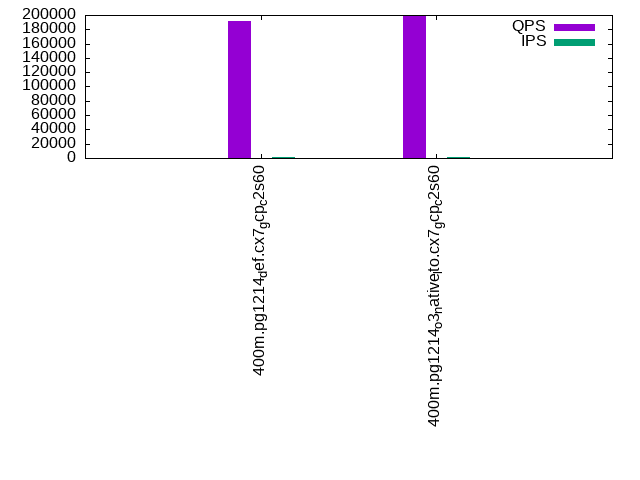
q100.1
q100.1: range queries with 100 insert/s per client. Graphs for performance per 1-second interval are here.
Average throughput:
Query response time histogram: each cell has the percentage of responses that take <= the time in the header and max is the max response time in seconds. For max values in the top 25% of the range have a red background and in the bottom 25% of the range have a green background. The red background is not used when the min value is within 80% of the max value.
| dbms | 256us | 1ms | 4ms | 16ms | 64ms | 256ms | 1s | 4s | 16s | gt | max |
|---|---|---|---|---|---|---|---|---|---|---|---|
| pg1214_def.cx7_gcp_c2s60 | 99.971 | 0.023 | 0.006 | 0.001 | nonzero | 0.030 | |||||
| pg1214_o3_native_lto.cx7_gcp_c2s60 | 99.974 | 0.019 | 0.006 | 0.001 | nonzero | 0.026 |
Insert response time histogram: each cell has the percentage of responses that take <= the time in the header and max is the max response time in seconds. For max values in the top 25% of the range have a red background and in the bottom 25% of the range have a green background. The red background is not used when the min value is within 80% of the max value.
| dbms | 256us | 1ms | 4ms | 16ms | 64ms | 256ms | 1s | 4s | 16s | gt | max |
|---|---|---|---|---|---|---|---|---|---|---|---|
| pg1214_def.cx7_gcp_c2s60 | 92.379 | 5.456 | 2.165 | 0.044 | |||||||
| pg1214_o3_native_lto.cx7_gcp_c2s60 | 92.583 | 5.903 | 1.514 | 0.051 |
Performance metrics for the DBMS listed above. Some are normalized by throughput, others are not. Legend for results is here.
ips	qps	rps	rmbps	wps	wmbps	rpq	rkbpq	wpi	wkbpi	csps	cpups	cspq	cpupq	dbgb1	dbgb2	rss	maxop	p50	p99	tag
1976	191974	0	0.0	3980.2	97.2	0.000	0.000	2.014	50.351	681267	63.0	3.549	98	163.6	286.8	0.0	0.030	9526	9142	400m.pg1214_def.cx7_gcp_c2s60
1976	198992	0	0.0	3991.6	97.0	0.000	0.000	2.020	50.280	705444	62.9	3.545	95	163.6	286.7	0.0	0.026	9877	9429	400m.pg1214_o3_native_lto.cx7_gcp_c2s60
q500.1
q500.1: range queries with 500 insert/s per client. Graphs for performance per 1-second interval are here.
Average throughput:
Query response time histogram: each cell has the percentage of responses that take <= the time in the header and max is the max response time in seconds. For max values in the top 25% of the range have a red background and in the bottom 25% of the range have a green background. The red background is not used when the min value is within 80% of the max value.
| dbms | 256us | 1ms | 4ms | 16ms | 64ms | 256ms | 1s | 4s | 16s | gt | max |
|---|---|---|---|---|---|---|---|---|---|---|---|
| pg1214_def.cx7_gcp_c2s60 | 99.906 | 0.061 | 0.030 | 0.004 | nonzero | 0.060 | |||||
| pg1214_o3_native_lto.cx7_gcp_c2s60 | 99.913 | 0.055 | 0.029 | 0.003 | nonzero | 0.060 |
Insert response time histogram: each cell has the percentage of responses that take <= the time in the header and max is the max response time in seconds. For max values in the top 25% of the range have a red background and in the bottom 25% of the range have a green background. The red background is not used when the min value is within 80% of the max value.
| dbms | 256us | 1ms | 4ms | 16ms | 64ms | 256ms | 1s | 4s | 16s | gt | max |
|---|---|---|---|---|---|---|---|---|---|---|---|
| pg1214_def.cx7_gcp_c2s60 | 43.952 | 25.435 | 29.038 | 1.574 | 0.001 | 0.280 | |||||
| pg1214_o3_native_lto.cx7_gcp_c2s60 | 43.562 | 26.406 | 28.512 | 1.521 | 0.001 | 0.327 |
Performance metrics for the DBMS listed above. Some are normalized by throughput, others are not. Legend for results is here.
ips	qps	rps	rmbps	wps	wmbps	rpq	rkbpq	wpi	wkbpi	csps	cpups	cspq	cpupq	dbgb1	dbgb2	rss	maxop	p50	p99	tag
9885	193981	0	0.0	6435.5	211.3	0.000	0.000	0.651	21.892	674308	64.2	3.476	99	167.1	254.9	0.0	0.060	9654	9145	400m.pg1214_def.cx7_gcp_c2s60
9885	200609	0	0.0	6441.9	210.8	0.000	0.000	0.652	21.833	698168	63.9	3.480	96	167.2	255.0	0.0	0.060	9909	9365	400m.pg1214_o3_native_lto.cx7_gcp_c2s60
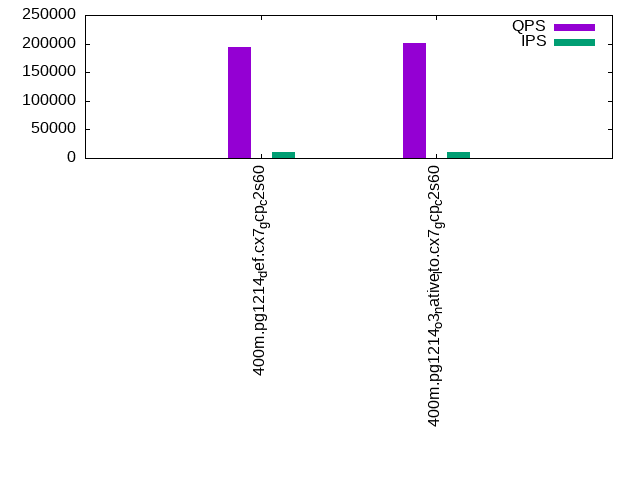
q1000.1
q1000.1: range queries with 1000 insert/s per client. Graphs for performance per 1-second interval are here.
Average throughput:
Query response time histogram: each cell has the percentage of responses that take <= the time in the header and max is the max response time in seconds. For max values in the top 25% of the range have a red background and in the bottom 25% of the range have a green background. The red background is not used when the min value is within 80% of the max value.
| dbms | 256us | 1ms | 4ms | 16ms | 64ms | 256ms | 1s | 4s | 16s | gt | max |
|---|---|---|---|---|---|---|---|---|---|---|---|
| pg1214_def.cx7_gcp_c2s60 | 99.847 | 0.101 | 0.043 | 0.008 | 0.001 | nonzero | 0.146 | ||||
| pg1214_o3_native_lto.cx7_gcp_c2s60 | 99.855 | 0.095 | 0.042 | 0.007 | 0.001 | nonzero | 0.083 |
Insert response time histogram: each cell has the percentage of responses that take <= the time in the header and max is the max response time in seconds. For max values in the top 25% of the range have a red background and in the bottom 25% of the range have a green background. The red background is not used when the min value is within 80% of the max value.
| dbms | 256us | 1ms | 4ms | 16ms | 64ms | 256ms | 1s | 4s | 16s | gt | max |
|---|---|---|---|---|---|---|---|---|---|---|---|
| pg1214_def.cx7_gcp_c2s60 | 58.007 | 21.435 | 19.406 | 1.153 | 0.240 | ||||||
| pg1214_o3_native_lto.cx7_gcp_c2s60 | 56.757 | 22.223 | 19.875 | 1.146 | 0.231 |
Performance metrics for the DBMS listed above. Some are normalized by throughput, others are not. Legend for results is here.
ips	qps	rps	rmbps	wps	wmbps	rpq	rkbpq	wpi	wkbpi	csps	cpups	cspq	cpupq	dbgb1	dbgb2	rss	maxop	p50	p99	tag
19769	198060	0	0.0	5537.7	296.9	0.000	0.000	0.280	15.377	667348	65.4	3.369	99	179.3	262.3	0.0	0.146	9877	8886	400m.pg1214_def.cx7_gcp_c2s60
19769	204408	0	0.0	5542.4	296.4	0.000	0.000	0.280	15.351	690868	65.2	3.380	96	179.3	262.7	0.0	0.083	10149	9257	400m.pg1214_o3_native_lto.cx7_gcp_c2s60
l.i0
l.i0: load without secondary indexes
Performance metrics for all DBMS, not just the ones listed above. Some are normalized by throughput, others are not. Legend for results is here.
ips	qps	rps	rmbps	wps	wmbps	rpq	rkbpq	wpi	wkbpi	csps	cpups	cspq	cpupq	dbgb1	dbgb2	rss	maxop	p50	p99	tag
1403509	0	0	0.0	1843.8	463.0	0.000	0.000	0.001	0.338	209889	60.7	0.150	13	38.3	103.2	NA	0.625	79645	11792	400m.pg1214_def.cx7_gcp_c2s60
1403509	0	0	0.0	1842.3	466.1	0.000	0.000	0.001	0.340	232757	59.6	0.166	13	38.3	103.2	NA	0.913	79746	14484	400m.pg1214_o3_native_lto.cx7_gcp_c2s60
l.x
l.x: create secondary indexes
Performance metrics for all DBMS, not just the ones listed above. Some are normalized by throughput, others are not. Legend for results is here.
ips	qps	rps	rmbps	wps	wmbps	rpq	rkbpq	wpi	wkbpi	csps	cpups	cspq	cpupq	dbgb1	dbgb2	rss	maxop	p50	p99	tag
2548408	0	8390	107.8	3498.8	855.5	0.003	0.043	0.001	0.344	98070	26.6	0.038	3	73.5	170.5	0.0	0.092	NA	NA	400m.pg1214_def.cx7_gcp_c2s60
2564744	0	8411	112.9	3484.0	856.2	0.003	0.045	0.001	0.342	101553	25.1	0.040	3	73.5	170.5	0.0	0.314	NA	NA	400m.pg1214_o3_native_lto.cx7_gcp_c2s60
l.i1
l.i1: continue load after secondary indexes created
Performance metrics for all DBMS, not just the ones listed above. Some are normalized by throughput, others are not. Legend for results is here.
ips	qps	rps	rmbps	wps	wmbps	rpq	rkbpq	wpi	wkbpi	csps	cpups	cspq	cpupq	dbgb1	dbgb2	rss	maxop	p50	p99	tag
404858	0	4744	43.8	3884.3	496.1	0.012	0.111	0.010	1.255	256974	51.2	0.635	38	163.1	318.4	0.0	1.077	26371	1848	400m.pg1214_def.cx7_gcp_c2s60
403226	0	5405	44.7	3740.0	498.9	0.013	0.114	0.009	1.267	287816	50.4	0.714	37	163.1	318.3	0.0	0.819	26381	1798	400m.pg1214_o3_native_lto.cx7_gcp_c2s60
q100.1
q100.1: range queries with 100 insert/s per client
Performance metrics for all DBMS, not just the ones listed above. Some are normalized by throughput, others are not. Legend for results is here.
ips	qps	rps	rmbps	wps	wmbps	rpq	rkbpq	wpi	wkbpi	csps	cpups	cspq	cpupq	dbgb1	dbgb2	rss	maxop	p50	p99	tag
1976	191974	0	0.0	3980.2	97.2	0.000	0.000	2.014	50.351	681267	63.0	3.549	98	163.6	286.8	0.0	0.030	9526	9142	400m.pg1214_def.cx7_gcp_c2s60
1976	198992	0	0.0	3991.6	97.0	0.000	0.000	2.020	50.280	705444	62.9	3.545	95	163.6	286.7	0.0	0.026	9877	9429	400m.pg1214_o3_native_lto.cx7_gcp_c2s60
q500.1
q500.1: range queries with 500 insert/s per client
Performance metrics for all DBMS, not just the ones listed above. Some are normalized by throughput, others are not. Legend for results is here.
ips	qps	rps	rmbps	wps	wmbps	rpq	rkbpq	wpi	wkbpi	csps	cpups	cspq	cpupq	dbgb1	dbgb2	rss	maxop	p50	p99	tag
9885	193981	0	0.0	6435.5	211.3	0.000	0.000	0.651	21.892	674308	64.2	3.476	99	167.1	254.9	0.0	0.060	9654	9145	400m.pg1214_def.cx7_gcp_c2s60
9885	200609	0	0.0	6441.9	210.8	0.000	0.000	0.652	21.833	698168	63.9	3.480	96	167.2	255.0	0.0	0.060	9909	9365	400m.pg1214_o3_native_lto.cx7_gcp_c2s60
q1000.1
q1000.1: range queries with 1000 insert/s per client
Performance metrics for all DBMS, not just the ones listed above. Some are normalized by throughput, others are not. Legend for results is here.
ips	qps	rps	rmbps	wps	wmbps	rpq	rkbpq	wpi	wkbpi	csps	cpups	cspq	cpupq	dbgb1	dbgb2	rss	maxop	p50	p99	tag
19769	198060	0	0.0	5537.7	296.9	0.000	0.000	0.280	15.377	667348	65.4	3.369	99	179.3	262.3	0.0	0.146	9877	8886	400m.pg1214_def.cx7_gcp_c2s60
19769	204408	0	0.0	5542.4	296.4	0.000	0.000	0.280	15.351	690868	65.2	3.380	96	179.3	262.7	0.0	0.083	10149	9257	400m.pg1214_o3_native_lto.cx7_gcp_c2s60
l.i0
- l.i0: load without secondary indexes
- Legend for results is here.
- Each entry lists the percentage of responses that fit in that bucket (slower than max time for previous bucket, faster than min time for next bucket).
Insert response time histogram
256us	1ms	4ms	16ms	64ms	256ms	1s	4s	16s	gt	max	tag
0.000	61.414	37.691	0.841	0.016	0.025	0.013	0.000	0.000	0.000	0.625	pg1214_def.cx7_gcp_c2s60
0.000	59.796	39.346	0.799	0.026	0.020	0.014	0.000	0.000	0.000	0.913	pg1214_o3_native_lto.cx7_gcp_c2s60
l.x
- l.x: create secondary indexes
- Legend for results is here.
- Each entry lists the percentage of responses that fit in that bucket (slower than max time for previous bucket, faster than min time for next bucket).
TODO - determine whether there is data for create index response time
l.i1
- l.i1: continue load after secondary indexes created
- Legend for results is here.
- Each entry lists the percentage of responses that fit in that bucket (slower than max time for previous bucket, faster than min time for next bucket).
Insert response time histogram
256us	1ms	4ms	16ms	64ms	256ms	1s	4s	16s	gt	max	tag
0.000	nonzero	96.245	2.090	1.622	0.032	0.011	nonzero	0.000	0.000	1.077	pg1214_def.cx7_gcp_c2s60
0.000	0.004	96.022	2.295	1.631	0.040	0.008	0.000	0.000	0.000	0.819	pg1214_o3_native_lto.cx7_gcp_c2s60
q100.1
- q100.1: range queries with 100 insert/s per client
- Legend for results is here.
- Each entry lists the percentage of responses that fit in that bucket (slower than max time for previous bucket, faster than min time for next bucket).
Query response time histogram
256us	1ms	4ms	16ms	64ms	256ms	1s	4s	16s	gt	max	tag
99.971	0.023	0.006	0.001	nonzero	0.000	0.000	0.000	0.000	0.000	0.030	pg1214_def.cx7_gcp_c2s60
99.974	0.019	0.006	0.001	nonzero	0.000	0.000	0.000	0.000	0.000	0.026	pg1214_o3_native_lto.cx7_gcp_c2s60
Insert response time histogram
256us	1ms	4ms	16ms	64ms	256ms	1s	4s	16s	gt	max	tag
0.000	0.000	92.379	5.456	2.165	0.000	0.000	0.000	0.000	0.000	0.044	pg1214_def.cx7_gcp_c2s60
0.000	0.000	92.583	5.903	1.514	0.000	0.000	0.000	0.000	0.000	0.051	pg1214_o3_native_lto.cx7_gcp_c2s60
q500.1
- q500.1: range queries with 500 insert/s per client
- Legend for results is here.
- Each entry lists the percentage of responses that fit in that bucket (slower than max time for previous bucket, faster than min time for next bucket).
Query response time histogram
256us	1ms	4ms	16ms	64ms	256ms	1s	4s	16s	gt	max	tag
99.906	0.061	0.030	0.004	nonzero	0.000	0.000	0.000	0.000	0.000	0.060	pg1214_def.cx7_gcp_c2s60
99.913	0.055	0.029	0.003	nonzero	0.000	0.000	0.000	0.000	0.000	0.060	pg1214_o3_native_lto.cx7_gcp_c2s60
Insert response time histogram
256us	1ms	4ms	16ms	64ms	256ms	1s	4s	16s	gt	max	tag
0.000	0.000	43.952	25.435	29.038	1.574	0.001	0.000	0.000	0.000	0.280	pg1214_def.cx7_gcp_c2s60
0.000	0.000	43.562	26.406	28.512	1.521	0.001	0.000	0.000	0.000	0.327	pg1214_o3_native_lto.cx7_gcp_c2s60
q1000.1
- q1000.1: range queries with 1000 insert/s per client
- Legend for results is here.
- Each entry lists the percentage of responses that fit in that bucket (slower than max time for previous bucket, faster than min time for next bucket).
Query response time histogram
256us	1ms	4ms	16ms	64ms	256ms	1s	4s	16s	gt	max	tag
99.847	0.101	0.043	0.008	0.001	nonzero	0.000	0.000	0.000	0.000	0.146	pg1214_def.cx7_gcp_c2s60
99.855	0.095	0.042	0.007	0.001	nonzero	0.000	0.000	0.000	0.000	0.083	pg1214_o3_native_lto.cx7_gcp_c2s60
Insert response time histogram
256us	1ms	4ms	16ms	64ms	256ms	1s	4s	16s	gt	max	tag
0.000	0.000	58.007	21.435	19.406	1.153	0.000	0.000	0.000	0.000	0.240	pg1214_def.cx7_gcp_c2s60
0.000	0.000	56.757	22.223	19.875	1.146	0.000	0.000	0.000	0.000	0.231	pg1214_o3_native_lto.cx7_gcp_c2s60