Introduction
This is a report for the insert benchmark with 400M docs and 20 client(s). It is generated by scripts (bash, awk, sed) and Tufte might not be impressed. An overview of the insert benchmark is here and a short update is here. Below, by DBMS, I mean DBMS+version.config. An example is my8020.c10b40 where my means MySQL, 8020 is version 8.0.20 and c10b40 is the name for the configuration file.
The test server is a c2-standard-60 from GCP with 30 cores, hyperthreading disabled, 240G RAM and 3T from XFS and SW RAID 0 striped over 8 local NVMe drives. The benchmark was run with 20 clients and there were 1 or 2 connections per client (1 for queries, 1 for inserts). The benchmark loads 400M rows without secondary indexes, creates secondary indexes, loads another 400M rows then does 3 read+write tests for one hour each that do queries as fast as possible with 100, 500 and then 1000 writes/second/client concurrent with the queries. Each read-write test runs for 1800 seconds. The test was configured to use one table. The database fits in the OS page cache but not the DBMS buffer pool. Clients and the DBMS share one server. The per-database configs are in the per-database subdirectories here.
The tested DBMS are:
- pg1119_def.cx7_gcp_c2s60_4g - Postgres 11.19, the cx7_gcp_c2s60_4g config and a default build that used -O2
- pg1119_o3_native_lto.cx7_gcp_c2s60_4g - Postgres 11.19, the cx7_gcp_c2s60_4g config and a build that uses -O3 -march=native -mtune=native -flto (link-time optimization)
Contents
- Summary
- l.i0: load without secondary indexes
- l.x: create secondary indexes
- l.i1: continue load after secondary indexes created
- q100.1: range queries with 100 insert/s per client
- q500.1: range queries with 500 insert/s per client
- q1000.1: range queries with 1000 insert/s per client
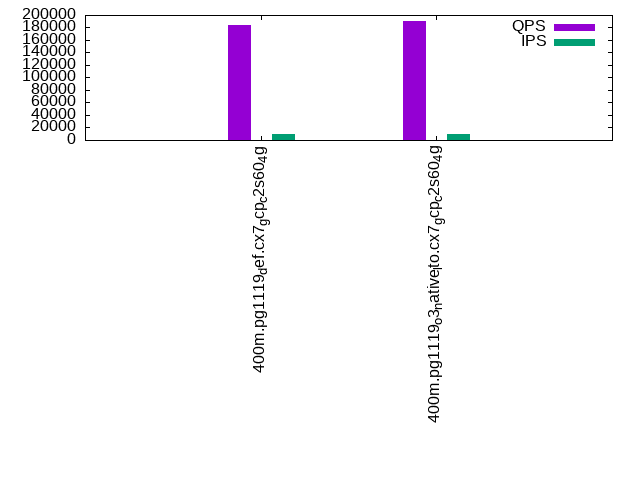
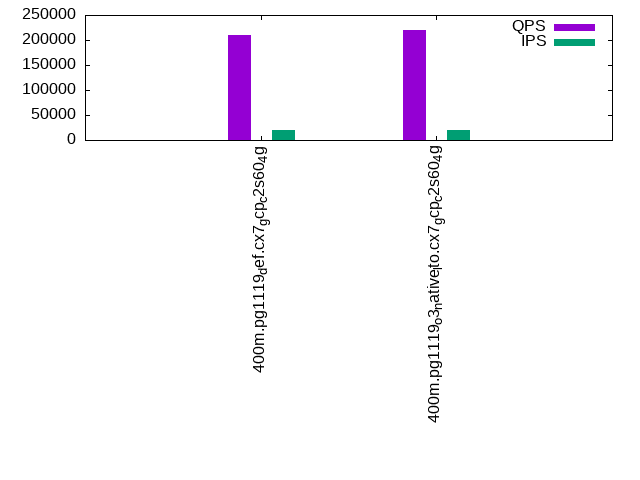
Summary
The numbers are inserts/s for l.i0 and l.i1, indexed docs (or rows) /s for l.x and queries/s for q*.2. The values are the average rate over the entire test for inserts (IPS) and queries (QPS). The range of values for IPS and QPS is split into 3 parts: bottom 25%, middle 50%, top 25%. Values in the bottom 25% have a red background, values in the top 25% have a green background and values in the middle have no color. A gray background is used for values that can be ignored because the DBMS did not sustain the target insert rate. Red backgrounds are not used when the minimum value is within 80% of the max value.
| dbms | l.i0 | l.x | l.i1 | q100.1 | q500.1 | q1000.1 |
|---|---|---|---|---|---|---|
| 400m.pg1119_def.cx7_gcp_c2s60_4g | 1111111 | 300601 | 33498 | 182522 | 184600 | 209859 |
| 400m.pg1119_o3_native_lto.cx7_gcp_c2s60_4g | 1129944 | 312090 | 33758 | 188553 | 190603 | 219889 |
This lists the average rate of inserts/s for the tests that do inserts concurrent with queries. For such tests the query rate is listed in the table above. The read+write tests are setup so that the insert rate should match the target rate every second. Cells that are not at least 95% of the target have a red background to indicate a failure to satisfy the target.
| dbms | q100.1 | q500.1 | q1000.1 |
|---|---|---|---|
| pg1119_def.cx7_gcp_c2s60_4g | 1976 | 9885 | 19651 |
| pg1119_o3_native_lto.cx7_gcp_c2s60_4g | 1976 | 9885 | 19683 |
| target | 2000 | 10000 | 20000 |
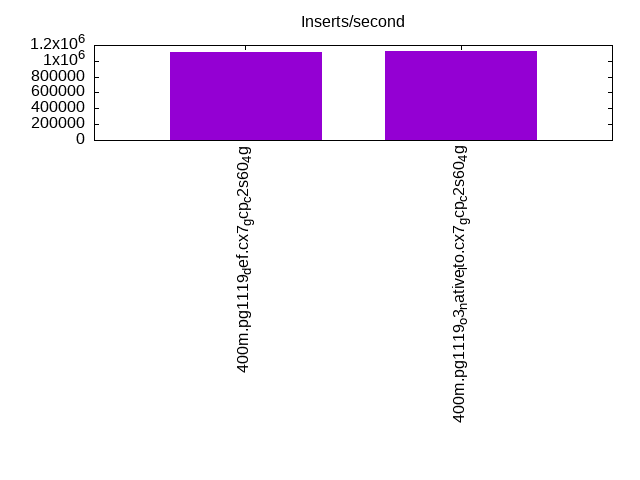
l.i0
l.i0: load without secondary indexes. Graphs for performance per 1-second interval are here.
Average throughput:
Insert response time histogram: each cell has the percentage of responses that take <= the time in the header and max is the max response time in seconds. For the max column values in the top 25% of the range have a red background and in the bottom 25% of the range have a green background. The red background is not used when the min value is within 80% of the max value.
| dbms | 256us | 1ms | 4ms | 16ms | 64ms | 256ms | 1s | 4s | 16s | gt | max |
|---|---|---|---|---|---|---|---|---|---|---|---|
| pg1119_def.cx7_gcp_c2s60_4g | 22.857 | 74.322 | 2.740 | 0.035 | 0.033 | 0.013 | 0.629 | ||||
| pg1119_o3_native_lto.cx7_gcp_c2s60_4g | 28.387 | 68.721 | 2.800 | 0.050 | 0.029 | 0.012 | 0.760 |
Performance metrics for the DBMS listed above. Some are normalized by throughput, others are not. Legend for results is here.
ips	qps	rps	rmbps	wps	wmbps	rpq	rkbpq	wpi	wkbpi	csps	cpups	cspq	cpupq	dbgb1	dbgb2	rss	maxop	p50	p99	tag
1111111	0	238	2.1	2351.1	469.7	0.000	0.002	0.002	0.433	302950	58.4	0.273	16	44.2	114.2	NA	0.629	61831	10888	400m.pg1119_def.cx7_gcp_c2s60_4g
1129944	0	195	2.1	2368.0	482.6	0.000	0.002	0.002	0.437	336807	58.6	0.298	16	44.2	114.2	NA	0.760	62754	12486	400m.pg1119_o3_native_lto.cx7_gcp_c2s60_4g
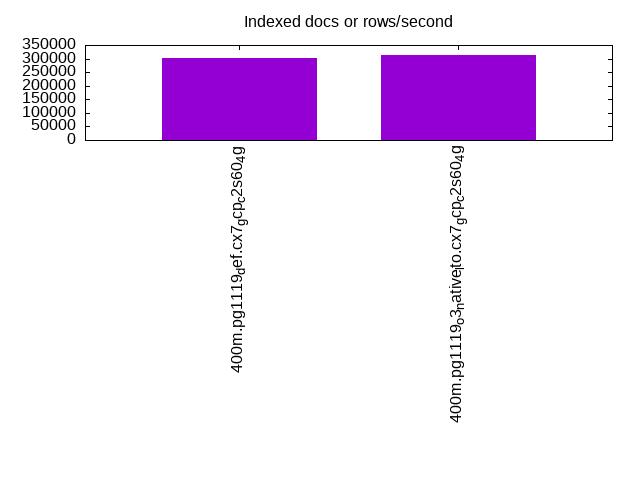
l.x
l.x: create secondary indexes.
Average throughput:
Performance metrics for the DBMS listed above. Some are normalized by throughput, others are not. Legend for results is here.
ips	qps	rps	rmbps	wps	wmbps	rpq	rkbpq	wpi	wkbpi	csps	cpups	cspq	cpupq	dbgb1	dbgb2	rss	maxop	p50	p99	tag
300601	0	1390	39.1	508.3	109.1	0.005	0.133	0.002	0.372	1410	3.4	0.005	3	79.5	150.5	0.0	0.002	NA	NA	400m.pg1119_def.cx7_gcp_c2s60_4g
312090	0	2091	44.6	521.2	113.0	0.007	0.146	0.002	0.371	1861	3.4	0.006	3	79.5	152.9	0.0	0.003	NA	NA	400m.pg1119_o3_native_lto.cx7_gcp_c2s60_4g
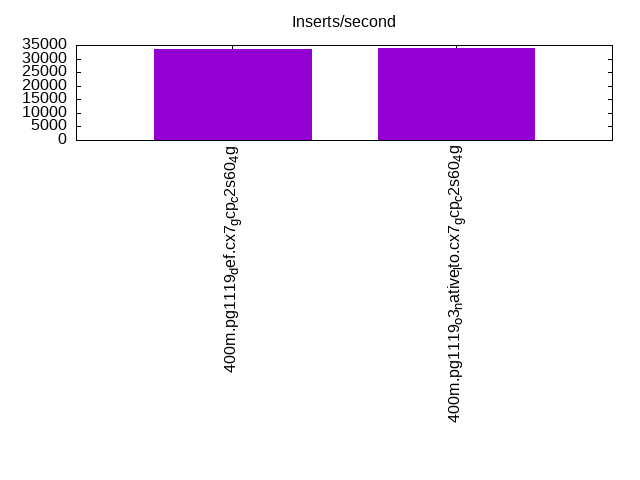
l.i1
l.i1: continue load after secondary indexes created. Graphs for performance per 1-second interval are here.
Average throughput:
Insert response time histogram: each cell has the percentage of responses that take <= the time in the header and max is the max response time in seconds. For the max column values in the top 25% of the range have a red background and in the bottom 25% of the range have a green background. The red background is not used when the min value is within 80% of the max value.
| dbms | 256us | 1ms | 4ms | 16ms | 64ms | 256ms | 1s | 4s | 16s | gt | max |
|---|---|---|---|---|---|---|---|---|---|---|---|
| pg1119_def.cx7_gcp_c2s60_4g | 0.169 | 6.403 | 88.055 | 5.372 | nonzero | 0.407 | |||||
| pg1119_o3_native_lto.cx7_gcp_c2s60_4g | 0.194 | 6.555 | 87.950 | 5.300 | nonzero | 0.688 |
Performance metrics for the DBMS listed above. Some are normalized by throughput, others are not. Legend for results is here.
ips	qps	rps	rmbps	wps	wmbps	rpq	rkbpq	wpi	wkbpi	csps	cpups	cspq	cpupq	dbgb1	dbgb2	rss	maxop	p50	p99	tag
33498	0	70808	655.9	61044.4	592.9	2.114	20.049	1.822	18.126	129039	13.0	3.852	116	176.5	245.0	0.0	0.407	1698	749	400m.pg1119_def.cx7_gcp_c2s60_4g
33758	0	71047	658.0	61534.1	596.1	2.105	19.960	1.823	18.082	130209	12.8	3.857	114	176.4	241.8	0.0	0.688	1698	749	400m.pg1119_o3_native_lto.cx7_gcp_c2s60_4g
q100.1
q100.1: range queries with 100 insert/s per client. Graphs for performance per 1-second interval are here.
Average throughput:
Query response time histogram: each cell has the percentage of responses that take <= the time in the header and max is the max response time in seconds. For max values in the top 25% of the range have a red background and in the bottom 25% of the range have a green background. The red background is not used when the min value is within 80% of the max value.
| dbms | 256us | 1ms | 4ms | 16ms | 64ms | 256ms | 1s | 4s | 16s | gt | max |
|---|---|---|---|---|---|---|---|---|---|---|---|
| pg1119_def.cx7_gcp_c2s60_4g | 99.892 | 0.104 | 0.002 | 0.001 | nonzero | 0.027 | |||||
| pg1119_o3_native_lto.cx7_gcp_c2s60_4g | 99.912 | 0.085 | 0.002 | 0.001 | nonzero | 0.032 |
Insert response time histogram: each cell has the percentage of responses that take <= the time in the header and max is the max response time in seconds. For max values in the top 25% of the range have a red background and in the bottom 25% of the range have a green background. The red background is not used when the min value is within 80% of the max value.
| dbms | 256us | 1ms | 4ms | 16ms | 64ms | 256ms | 1s | 4s | 16s | gt | max |
|---|---|---|---|---|---|---|---|---|---|---|---|
| pg1119_def.cx7_gcp_c2s60_4g | 0.229 | 99.692 | 0.076 | 0.003 | 0.334 | ||||||
| pg1119_o3_native_lto.cx7_gcp_c2s60_4g | 0.397 | 99.576 | 0.026 | 0.126 |
Performance metrics for the DBMS listed above. Some are normalized by throughput, others are not. Legend for results is here.
ips	qps	rps	rmbps	wps	wmbps	rpq	rkbpq	wpi	wkbpi	csps	cpups	cspq	cpupq	dbgb1	dbgb2	rss	maxop	p50	p99	tag
1976	182522	3940	39.7	4026.1	50.8	0.022	0.223	2.038	26.308	653071	63.0	3.578	104	177.6	231.4	0.0	0.027	9126	8774	400m.pg1119_def.cx7_gcp_c2s60_4g
1976	188553	3822	38.4	4026.4	50.5	0.020	0.209	2.038	26.163	674843	63.0	3.579	100	177.6	220.7	0.0	0.032	9338	8970	400m.pg1119_o3_native_lto.cx7_gcp_c2s60_4g
q500.1
q500.1: range queries with 500 insert/s per client. Graphs for performance per 1-second interval are here.
Average throughput:
Query response time histogram: each cell has the percentage of responses that take <= the time in the header and max is the max response time in seconds. For max values in the top 25% of the range have a red background and in the bottom 25% of the range have a green background. The red background is not used when the min value is within 80% of the max value.
| dbms | 256us | 1ms | 4ms | 16ms | 64ms | 256ms | 1s | 4s | 16s | gt | max |
|---|---|---|---|---|---|---|---|---|---|---|---|
| pg1119_def.cx7_gcp_c2s60_4g | 99.607 | 0.381 | 0.012 | 0.001 | nonzero | 0.030 | |||||
| pg1119_o3_native_lto.cx7_gcp_c2s60_4g | 99.645 | 0.343 | 0.011 | 0.001 | nonzero | 0.028 |
Insert response time histogram: each cell has the percentage of responses that take <= the time in the header and max is the max response time in seconds. For max values in the top 25% of the range have a red background and in the bottom 25% of the range have a green background. The red background is not used when the min value is within 80% of the max value.
| dbms | 256us | 1ms | 4ms | 16ms | 64ms | 256ms | 1s | 4s | 16s | gt | max |
|---|---|---|---|---|---|---|---|---|---|---|---|
| pg1119_def.cx7_gcp_c2s60_4g | 0.179 | 99.736 | 0.081 | 0.004 | 0.292 | ||||||
| pg1119_o3_native_lto.cx7_gcp_c2s60_4g | 0.357 | 99.568 | 0.075 | 0.254 |
Performance metrics for the DBMS listed above. Some are normalized by throughput, others are not. Legend for results is here.
ips	qps	rps	rmbps	wps	wmbps	rpq	rkbpq	wpi	wkbpi	csps	cpups	cspq	cpupq	dbgb1	dbgb2	rss	maxop	p50	p99	tag
9885	184600	18499	187.8	19910.3	211.2	0.100	1.042	2.014	21.878	639870	65.9	3.466	107	183.7	230.0	0.0	0.030	9130	8535	400m.pg1119_def.cx7_gcp_c2s60_4g
9885	190603	18171	186.0	19877.3	210.6	0.095	1.000	2.011	21.821	661225	65.8	3.469	104	183.7	226.3	0.0	0.028	9450	8842	400m.pg1119_o3_native_lto.cx7_gcp_c2s60_4g
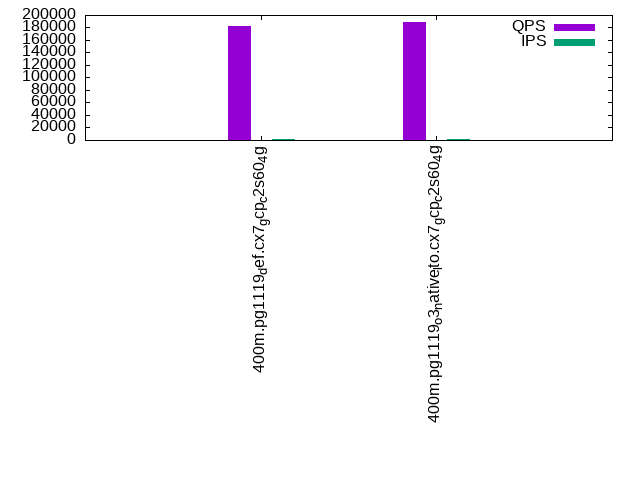
q1000.1
q1000.1: range queries with 1000 insert/s per client. Graphs for performance per 1-second interval are here.
Average throughput:
Query response time histogram: each cell has the percentage of responses that take <= the time in the header and max is the max response time in seconds. For max values in the top 25% of the range have a red background and in the bottom 25% of the range have a green background. The red background is not used when the min value is within 80% of the max value.
| dbms | 256us | 1ms | 4ms | 16ms | 64ms | 256ms | 1s | 4s | 16s | gt | max |
|---|---|---|---|---|---|---|---|---|---|---|---|
| pg1119_def.cx7_gcp_c2s60_4g | 99.389 | 0.587 | 0.022 | 0.002 | nonzero | 0.040 | |||||
| pg1119_o3_native_lto.cx7_gcp_c2s60_4g | 99.426 | 0.551 | 0.022 | 0.002 | nonzero | 0.042 |
Insert response time histogram: each cell has the percentage of responses that take <= the time in the header and max is the max response time in seconds. For max values in the top 25% of the range have a red background and in the bottom 25% of the range have a green background. The red background is not used when the min value is within 80% of the max value.
| dbms | 256us | 1ms | 4ms | 16ms | 64ms | 256ms | 1s | 4s | 16s | gt | max |
|---|---|---|---|---|---|---|---|---|---|---|---|
| pg1119_def.cx7_gcp_c2s60_4g | 0.878 | 93.685 | 5.437 | nonzero | 0.258 | ||||||
| pg1119_o3_native_lto.cx7_gcp_c2s60_4g | 1.098 | 93.540 | 5.362 | nonzero | 0.285 |
Performance metrics for the DBMS listed above. Some are normalized by throughput, others are not. Legend for results is here.
ips	qps	rps	rmbps	wps	wmbps	rpq	rkbpq	wpi	wkbpi	csps	cpups	cspq	cpupq	dbgb1	dbgb2	rss	maxop	p50	p99	tag
19651	209859	38002	386.0	37710.9	397.6	0.181	1.883	1.919	20.721	649083	70.1	3.093	100	197.2	256.4	0.0	0.040	10509	7931	400m.pg1119_def.cx7_gcp_c2s60_4g
19683	219889	37761	383.2	37891.8	401.6	0.172	1.785	1.925	20.894	677985	70.0	3.083	96	197.2	256.7	0.0	0.042	11028	8075	400m.pg1119_o3_native_lto.cx7_gcp_c2s60_4g
l.i0
l.i0: load without secondary indexes
Performance metrics for all DBMS, not just the ones listed above. Some are normalized by throughput, others are not. Legend for results is here.
ips	qps	rps	rmbps	wps	wmbps	rpq	rkbpq	wpi	wkbpi	csps	cpups	cspq	cpupq	dbgb1	dbgb2	rss	maxop	p50	p99	tag
1111111	0	238	2.1	2351.1	469.7	0.000	0.002	0.002	0.433	302950	58.4	0.273	16	44.2	114.2	NA	0.629	61831	10888	400m.pg1119_def.cx7_gcp_c2s60_4g
1129944	0	195	2.1	2368.0	482.6	0.000	0.002	0.002	0.437	336807	58.6	0.298	16	44.2	114.2	NA	0.760	62754	12486	400m.pg1119_o3_native_lto.cx7_gcp_c2s60_4g
l.x
l.x: create secondary indexes
Performance metrics for all DBMS, not just the ones listed above. Some are normalized by throughput, others are not. Legend for results is here.
ips	qps	rps	rmbps	wps	wmbps	rpq	rkbpq	wpi	wkbpi	csps	cpups	cspq	cpupq	dbgb1	dbgb2	rss	maxop	p50	p99	tag
300601	0	1390	39.1	508.3	109.1	0.005	0.133	0.002	0.372	1410	3.4	0.005	3	79.5	150.5	0.0	0.002	NA	NA	400m.pg1119_def.cx7_gcp_c2s60_4g
312090	0	2091	44.6	521.2	113.0	0.007	0.146	0.002	0.371	1861	3.4	0.006	3	79.5	152.9	0.0	0.003	NA	NA	400m.pg1119_o3_native_lto.cx7_gcp_c2s60_4g
l.i1
l.i1: continue load after secondary indexes created
Performance metrics for all DBMS, not just the ones listed above. Some are normalized by throughput, others are not. Legend for results is here.
ips	qps	rps	rmbps	wps	wmbps	rpq	rkbpq	wpi	wkbpi	csps	cpups	cspq	cpupq	dbgb1	dbgb2	rss	maxop	p50	p99	tag
33498	0	70808	655.9	61044.4	592.9	2.114	20.049	1.822	18.126	129039	13.0	3.852	116	176.5	245.0	0.0	0.407	1698	749	400m.pg1119_def.cx7_gcp_c2s60_4g
33758	0	71047	658.0	61534.1	596.1	2.105	19.960	1.823	18.082	130209	12.8	3.857	114	176.4	241.8	0.0	0.688	1698	749	400m.pg1119_o3_native_lto.cx7_gcp_c2s60_4g
q100.1
q100.1: range queries with 100 insert/s per client
Performance metrics for all DBMS, not just the ones listed above. Some are normalized by throughput, others are not. Legend for results is here.
ips	qps	rps	rmbps	wps	wmbps	rpq	rkbpq	wpi	wkbpi	csps	cpups	cspq	cpupq	dbgb1	dbgb2	rss	maxop	p50	p99	tag
1976	182522	3940	39.7	4026.1	50.8	0.022	0.223	2.038	26.308	653071	63.0	3.578	104	177.6	231.4	0.0	0.027	9126	8774	400m.pg1119_def.cx7_gcp_c2s60_4g
1976	188553	3822	38.4	4026.4	50.5	0.020	0.209	2.038	26.163	674843	63.0	3.579	100	177.6	220.7	0.0	0.032	9338	8970	400m.pg1119_o3_native_lto.cx7_gcp_c2s60_4g
q500.1
q500.1: range queries with 500 insert/s per client
Performance metrics for all DBMS, not just the ones listed above. Some are normalized by throughput, others are not. Legend for results is here.
ips	qps	rps	rmbps	wps	wmbps	rpq	rkbpq	wpi	wkbpi	csps	cpups	cspq	cpupq	dbgb1	dbgb2	rss	maxop	p50	p99	tag
9885	184600	18499	187.8	19910.3	211.2	0.100	1.042	2.014	21.878	639870	65.9	3.466	107	183.7	230.0	0.0	0.030	9130	8535	400m.pg1119_def.cx7_gcp_c2s60_4g
9885	190603	18171	186.0	19877.3	210.6	0.095	1.000	2.011	21.821	661225	65.8	3.469	104	183.7	226.3	0.0	0.028	9450	8842	400m.pg1119_o3_native_lto.cx7_gcp_c2s60_4g
q1000.1
q1000.1: range queries with 1000 insert/s per client
Performance metrics for all DBMS, not just the ones listed above. Some are normalized by throughput, others are not. Legend for results is here.
ips	qps	rps	rmbps	wps	wmbps	rpq	rkbpq	wpi	wkbpi	csps	cpups	cspq	cpupq	dbgb1	dbgb2	rss	maxop	p50	p99	tag
19651	209859	38002	386.0	37710.9	397.6	0.181	1.883	1.919	20.721	649083	70.1	3.093	100	197.2	256.4	0.0	0.040	10509	7931	400m.pg1119_def.cx7_gcp_c2s60_4g
19683	219889	37761	383.2	37891.8	401.6	0.172	1.785	1.925	20.894	677985	70.0	3.083	96	197.2	256.7	0.0	0.042	11028	8075	400m.pg1119_o3_native_lto.cx7_gcp_c2s60_4g
l.i0
- l.i0: load without secondary indexes
- Legend for results is here.
- Each entry lists the percentage of responses that fit in that bucket (slower than max time for previous bucket, faster than min time for next bucket).
Insert response time histogram
256us	1ms	4ms	16ms	64ms	256ms	1s	4s	16s	gt	max	tag
0.000	22.857	74.322	2.740	0.035	0.033	0.013	0.000	0.000	0.000	0.629	pg1119_def.cx7_gcp_c2s60_4g
0.000	28.387	68.721	2.800	0.050	0.029	0.012	0.000	0.000	0.000	0.760	pg1119_o3_native_lto.cx7_gcp_c2s60_4g
l.x
- l.x: create secondary indexes
- Legend for results is here.
- Each entry lists the percentage of responses that fit in that bucket (slower than max time for previous bucket, faster than min time for next bucket).
TODO - determine whether there is data for create index response time
l.i1
- l.i1: continue load after secondary indexes created
- Legend for results is here.
- Each entry lists the percentage of responses that fit in that bucket (slower than max time for previous bucket, faster than min time for next bucket).
Insert response time histogram
256us	1ms	4ms	16ms	64ms	256ms	1s	4s	16s	gt	max	tag
0.000	0.000	0.169	6.403	88.055	5.372	nonzero	0.000	0.000	0.000	0.407	pg1119_def.cx7_gcp_c2s60_4g
0.000	0.000	0.194	6.555	87.950	5.300	nonzero	0.000	0.000	0.000	0.688	pg1119_o3_native_lto.cx7_gcp_c2s60_4g
q100.1
- q100.1: range queries with 100 insert/s per client
- Legend for results is here.
- Each entry lists the percentage of responses that fit in that bucket (slower than max time for previous bucket, faster than min time for next bucket).
Query response time histogram
256us	1ms	4ms	16ms	64ms	256ms	1s	4s	16s	gt	max	tag
99.892	0.104	0.002	0.001	nonzero	0.000	0.000	0.000	0.000	0.000	0.027	pg1119_def.cx7_gcp_c2s60_4g
99.912	0.085	0.002	0.001	nonzero	0.000	0.000	0.000	0.000	0.000	0.032	pg1119_o3_native_lto.cx7_gcp_c2s60_4g
Insert response time histogram
256us	1ms	4ms	16ms	64ms	256ms	1s	4s	16s	gt	max	tag
0.000	0.000	0.000	0.229	99.692	0.076	0.003	0.000	0.000	0.000	0.334	pg1119_def.cx7_gcp_c2s60_4g
0.000	0.000	0.000	0.397	99.576	0.026	0.000	0.000	0.000	0.000	0.126	pg1119_o3_native_lto.cx7_gcp_c2s60_4g
q500.1
- q500.1: range queries with 500 insert/s per client
- Legend for results is here.
- Each entry lists the percentage of responses that fit in that bucket (slower than max time for previous bucket, faster than min time for next bucket).
Query response time histogram
256us	1ms	4ms	16ms	64ms	256ms	1s	4s	16s	gt	max	tag
99.607	0.381	0.012	0.001	nonzero	0.000	0.000	0.000	0.000	0.000	0.030	pg1119_def.cx7_gcp_c2s60_4g
99.645	0.343	0.011	0.001	nonzero	0.000	0.000	0.000	0.000	0.000	0.028	pg1119_o3_native_lto.cx7_gcp_c2s60_4g
Insert response time histogram
256us	1ms	4ms	16ms	64ms	256ms	1s	4s	16s	gt	max	tag
0.000	0.000	0.000	0.179	99.736	0.081	0.004	0.000	0.000	0.000	0.292	pg1119_def.cx7_gcp_c2s60_4g
0.000	0.000	0.000	0.357	99.568	0.075	0.000	0.000	0.000	0.000	0.254	pg1119_o3_native_lto.cx7_gcp_c2s60_4g
q1000.1
- q1000.1: range queries with 1000 insert/s per client
- Legend for results is here.
- Each entry lists the percentage of responses that fit in that bucket (slower than max time for previous bucket, faster than min time for next bucket).
Query response time histogram
256us	1ms	4ms	16ms	64ms	256ms	1s	4s	16s	gt	max	tag
99.389	0.587	0.022	0.002	nonzero	0.000	0.000	0.000	0.000	0.000	0.040	pg1119_def.cx7_gcp_c2s60_4g
99.426	0.551	0.022	0.002	nonzero	0.000	0.000	0.000	0.000	0.000	0.042	pg1119_o3_native_lto.cx7_gcp_c2s60_4g
Insert response time histogram
256us	1ms	4ms	16ms	64ms	256ms	1s	4s	16s	gt	max	tag
0.000	0.000	0.000	0.878	93.685	5.437	nonzero	0.000	0.000	0.000	0.258	pg1119_def.cx7_gcp_c2s60_4g
0.000	0.000	0.000	1.098	93.540	5.362	nonzero	0.000	0.000	0.000	0.285	pg1119_o3_native_lto.cx7_gcp_c2s60_4g