Introduction
This is a report for the insert benchmark with 400M docs and 20 client(s). It is generated by scripts (bash, awk, sed) and Tufte might not be impressed. An overview of the insert benchmark is here and a short update is here. Below, by DBMS, I mean DBMS+version.config. An example is my8020.c10b40 where my means MySQL, 8020 is version 8.0.20 and c10b40 is the name for the configuration file.
The test server is a c2-standard-60 from GCP with 30 cores, hyperthreading disabled, 240G RAM and 3T from XFS and SW RAID 0 striped over 8 local NVMe drives. The benchmark was run with 20 clients and there were 1 or 2 connections per client (1 for queries, 1 for inserts). The benchmark loads 400M rows without secondary indexes, creates secondary indexes, loads another 400M rows then does 3 read+write tests for one hour each that do queries as fast as possible with 100, 500 and then 1000 writes/second/client concurrent with the queries. Each read-write test runs for 1800 seconds. The test was configured to use a table per client. The database is cached by the storage engine and the only IO is for writes. Clients and the DBMS share one server. The per-database configs are in the per-database subdirectories here.
The tested DBMS are:
- pg1119_def.cx7_gcp_c2s60 - Postgres 11.19, the cx7_gcp_c2s60 config and a default build that used -O2
- pg1119_o3_native_lto.cx7_gcp_c2s60 - Postgres 11.19, the cx7_gcp_c2s60 config and a build that uses -O3 -march=native -mtune=native -flto (link-time optimization)
Contents
- Summary
- l.i0: load without secondary indexes
- l.x: create secondary indexes
- l.i1: continue load after secondary indexes created
- q100.1: range queries with 100 insert/s per client
- q500.1: range queries with 500 insert/s per client
- q1000.1: range queries with 1000 insert/s per client
Summary
The numbers are inserts/s for l.i0 and l.i1, indexed docs (or rows) /s for l.x and queries/s for q*.2. The values are the average rate over the entire test for inserts (IPS) and queries (QPS). The range of values for IPS and QPS is split into 3 parts: bottom 25%, middle 50%, top 25%. Values in the bottom 25% have a red background, values in the top 25% have a green background and values in the middle have no color. A gray background is used for values that can be ignored because the DBMS did not sustain the target insert rate. Red backgrounds are not used when the minimum value is within 80% of the max value.
| dbms | l.i0 | l.x | l.i1 | q100.1 | q500.1 | q1000.1 |
|---|---|---|---|---|---|---|
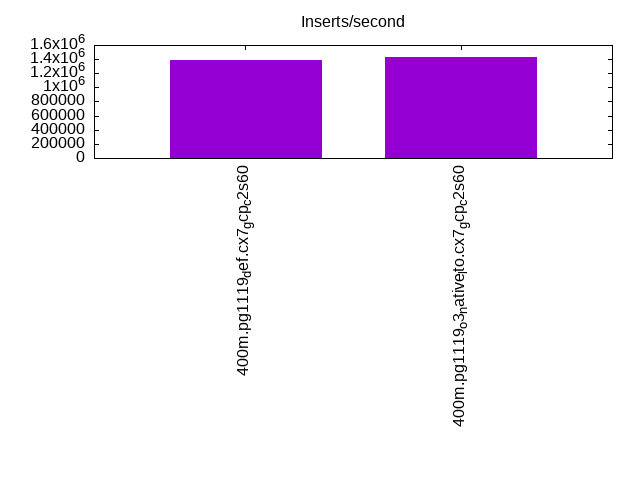
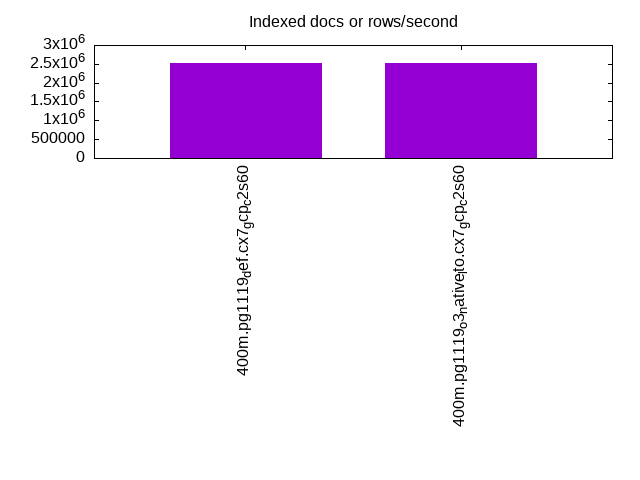
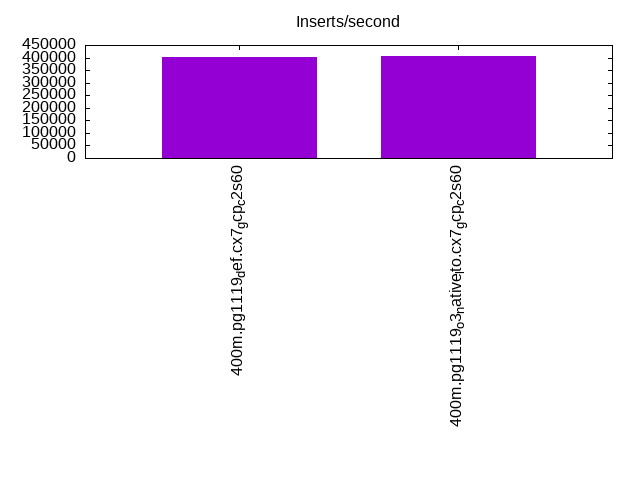
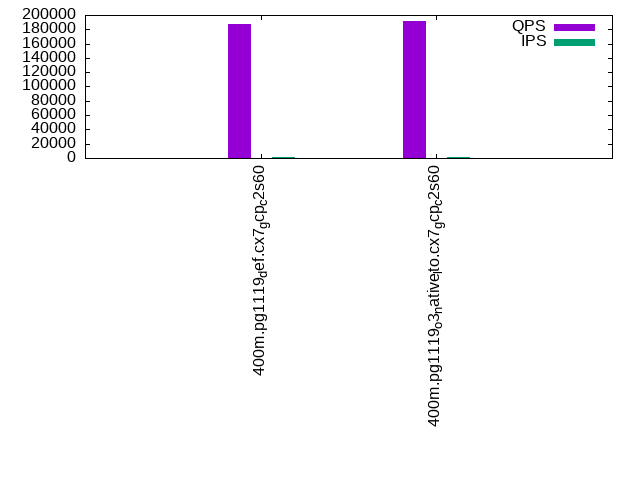
| 400m.pg1119_def.cx7_gcp_c2s60 | 1388889 | 2532278 | 403226 | 187781 | 188800 | 191320 |
| 400m.pg1119_o3_native_lto.cx7_gcp_c2s60 | 1428571 | 2516352 | 406918 | 191643 | 193929 | 195925 |
This lists the average rate of inserts/s for the tests that do inserts concurrent with queries. For such tests the query rate is listed in the table above. The read+write tests are setup so that the insert rate should match the target rate every second. Cells that are not at least 95% of the target have a red background to indicate a failure to satisfy the target.
| dbms | q100.1 | q500.1 | q1000.1 |
|---|---|---|---|
| pg1119_def.cx7_gcp_c2s60 | 1976 | 9885 | 19748 |
| pg1119_o3_native_lto.cx7_gcp_c2s60 | 1976 | 9885 | 19748 |
| target | 2000 | 10000 | 20000 |
l.i0
l.i0: load without secondary indexes. Graphs for performance per 1-second interval are here.
Average throughput:
Insert response time histogram: each cell has the percentage of responses that take <= the time in the header and max is the max response time in seconds. For the max column values in the top 25% of the range have a red background and in the bottom 25% of the range have a green background. The red background is not used when the min value is within 80% of the max value.
| dbms | 256us | 1ms | 4ms | 16ms | 64ms | 256ms | 1s | 4s | 16s | gt | max |
|---|---|---|---|---|---|---|---|---|---|---|---|
| pg1119_def.cx7_gcp_c2s60 | 61.871 | 37.178 | 0.904 | 0.012 | 0.019 | 0.015 | 0.981 | ||||
| pg1119_o3_native_lto.cx7_gcp_c2s60 | 60.984 | 38.162 | 0.805 | 0.013 | 0.024 | 0.013 | 0.756 |
Performance metrics for the DBMS listed above. Some are normalized by throughput, others are not. Legend for results is here.
ips	qps	rps	rmbps	wps	wmbps	rpq	rkbpq	wpi	wkbpi	csps	cpups	cspq	cpupq	dbgb1	dbgb2	rss	maxop	p50	p99	tag
1388889	0	0	0.0	1847.0	464.6	0.000	0.000	0.001	0.343	211205	61.0	0.152	13	38.3	103.2	NA	0.981	79014	9390	400m.pg1119_def.cx7_gcp_c2s60
1428571	0	0	0.0	1878.0	470.4	0.000	0.000	0.001	0.337	236836	59.9	0.166	13	38.3	103.2	NA	0.756	81410	8391	400m.pg1119_o3_native_lto.cx7_gcp_c2s60
l.x
l.x: create secondary indexes.
Average throughput:
Performance metrics for the DBMS listed above. Some are normalized by throughput, others are not. Legend for results is here.
ips	qps	rps	rmbps	wps	wmbps	rpq	rkbpq	wpi	wkbpi	csps	cpups	cspq	cpupq	dbgb1	dbgb2	rss	maxop	p50	p99	tag
2532278	0	9868	115.3	3474.3	845.9	0.004	0.047	0.001	0.342	100083	26.0	0.040	3	73.5	170.6	0.0	0.362	NA	NA	400m.pg1119_def.cx7_gcp_c2s60
2516352	0	7029	107.3	3445.1	849.0	0.003	0.044	0.001	0.345	102102	24.8	0.041	3	73.5	170.5	0.0	0.052	NA	NA	400m.pg1119_o3_native_lto.cx7_gcp_c2s60
l.i1
l.i1: continue load after secondary indexes created. Graphs for performance per 1-second interval are here.
Average throughput:
Insert response time histogram: each cell has the percentage of responses that take <= the time in the header and max is the max response time in seconds. For the max column values in the top 25% of the range have a red background and in the bottom 25% of the range have a green background. The red background is not used when the min value is within 80% of the max value.
| dbms | 256us | 1ms | 4ms | 16ms | 64ms | 256ms | 1s | 4s | 16s | gt | max |
|---|---|---|---|---|---|---|---|---|---|---|---|
| pg1119_def.cx7_gcp_c2s60 | nonzero | 96.066 | 2.246 | 1.642 | 0.033 | 0.011 | 0.001 | 1.341 | |||
| pg1119_o3_native_lto.cx7_gcp_c2s60 | 0.010 | 96.127 | 2.179 | 1.641 | 0.033 | 0.010 | 0.796 |
Performance metrics for the DBMS listed above. Some are normalized by throughput, others are not. Legend for results is here.
ips	qps	rps	rmbps	wps	wmbps	rpq	rkbpq	wpi	wkbpi	csps	cpups	cspq	cpupq	dbgb1	dbgb2	rss	maxop	p50	p99	tag
403226	0	5371	43.2	3615.5	495.4	0.013	0.110	0.009	1.258	264836	50.6	0.657	38	165.8	320.3	NA	1.341	26621	1648	400m.pg1119_def.cx7_gcp_c2s60
406918	0	5063	45.3	3863.1	507.0	0.012	0.114	0.009	1.276	287873	50.4	0.707	37	165.8	323.6	NA	0.796	26421	1748	400m.pg1119_o3_native_lto.cx7_gcp_c2s60
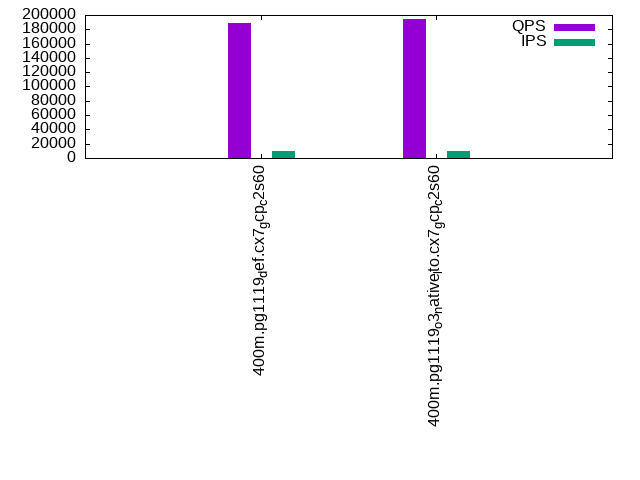
q100.1
q100.1: range queries with 100 insert/s per client. Graphs for performance per 1-second interval are here.
Average throughput:
Query response time histogram: each cell has the percentage of responses that take <= the time in the header and max is the max response time in seconds. For max values in the top 25% of the range have a red background and in the bottom 25% of the range have a green background. The red background is not used when the min value is within 80% of the max value.
| dbms | 256us | 1ms | 4ms | 16ms | 64ms | 256ms | 1s | 4s | 16s | gt | max |
|---|---|---|---|---|---|---|---|---|---|---|---|
| pg1119_def.cx7_gcp_c2s60 | 99.967 | 0.026 | 0.006 | 0.001 | nonzero | 0.026 | |||||
| pg1119_o3_native_lto.cx7_gcp_c2s60 | 99.968 | 0.025 | 0.006 | 0.001 | nonzero | 0.024 |
Insert response time histogram: each cell has the percentage of responses that take <= the time in the header and max is the max response time in seconds. For max values in the top 25% of the range have a red background and in the bottom 25% of the range have a green background. The red background is not used when the min value is within 80% of the max value.
| dbms | 256us | 1ms | 4ms | 16ms | 64ms | 256ms | 1s | 4s | 16s | gt | max |
|---|---|---|---|---|---|---|---|---|---|---|---|
| pg1119_def.cx7_gcp_c2s60 | 95.726 | 3.575 | 0.681 | 0.008 | 0.010 | 0.337 | |||||
| pg1119_o3_native_lto.cx7_gcp_c2s60 | 95.682 | 3.364 | 0.939 | 0.015 | 0.185 |
Performance metrics for the DBMS listed above. Some are normalized by throughput, others are not. Legend for results is here.
ips	qps	rps	rmbps	wps	wmbps	rpq	rkbpq	wpi	wkbpi	csps	cpups	cspq	cpupq	dbgb1	dbgb2	rss	maxop	p50	p99	tag
1976	187781	0	0.0	4115.3	95.3	0.000	0.000	2.083	49.374	667106	62.9	3.553	100	166.6	289.3	0.0	0.026	9338	8982	400m.pg1119_def.cx7_gcp_c2s60
1976	191643	0	0.0	3998.1	98.2	0.000	0.000	2.024	50.878	679241	63.0	3.544	99	166.6	292.5	0.0	0.024	9541	9142	400m.pg1119_o3_native_lto.cx7_gcp_c2s60
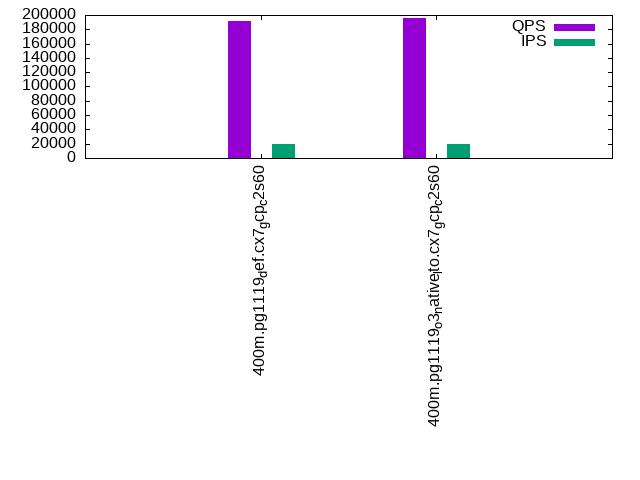
q500.1
q500.1: range queries with 500 insert/s per client. Graphs for performance per 1-second interval are here.
Average throughput:
Query response time histogram: each cell has the percentage of responses that take <= the time in the header and max is the max response time in seconds. For max values in the top 25% of the range have a red background and in the bottom 25% of the range have a green background. The red background is not used when the min value is within 80% of the max value.
| dbms | 256us | 1ms | 4ms | 16ms | 64ms | 256ms | 1s | 4s | 16s | gt | max |
|---|---|---|---|---|---|---|---|---|---|---|---|
| pg1119_def.cx7_gcp_c2s60 | 99.902 | 0.064 | 0.030 | 0.004 | nonzero | 0.053 | |||||
| pg1119_o3_native_lto.cx7_gcp_c2s60 | 99.906 | 0.061 | 0.029 | 0.004 | nonzero | 0.053 |
Insert response time histogram: each cell has the percentage of responses that take <= the time in the header and max is the max response time in seconds. For max values in the top 25% of the range have a red background and in the bottom 25% of the range have a green background. The red background is not used when the min value is within 80% of the max value.
| dbms | 256us | 1ms | 4ms | 16ms | 64ms | 256ms | 1s | 4s | 16s | gt | max |
|---|---|---|---|---|---|---|---|---|---|---|---|
| pg1119_def.cx7_gcp_c2s60 | 43.824 | 26.244 | 28.555 | 1.372 | 0.005 | 0.332 | |||||
| pg1119_o3_native_lto.cx7_gcp_c2s60 | 43.888 | 25.996 | 28.537 | 1.577 | 0.002 | 0.326 |
Performance metrics for the DBMS listed above. Some are normalized by throughput, others are not. Legend for results is here.
ips	qps	rps	rmbps	wps	wmbps	rpq	rkbpq	wpi	wkbpi	csps	cpups	cspq	cpupq	dbgb1	dbgb2	rss	maxop	p50	p99	tag
9885	188800	0	0.0	6944.6	215.6	0.000	0.000	0.703	22.334	657913	64.0	3.485	102	171.6	259.0	0.0	0.053	9382	8902	400m.pg1119_def.cx7_gcp_c2s60
9885	193929	0	0.0	6879.7	212.6	0.000	0.000	0.696	22.025	672766	64.1	3.469	99	171.6	260.9	0.0	0.053	9625	9110	400m.pg1119_o3_native_lto.cx7_gcp_c2s60
q1000.1
q1000.1: range queries with 1000 insert/s per client. Graphs for performance per 1-second interval are here.
Average throughput:
Query response time histogram: each cell has the percentage of responses that take <= the time in the header and max is the max response time in seconds. For max values in the top 25% of the range have a red background and in the bottom 25% of the range have a green background. The red background is not used when the min value is within 80% of the max value.
| dbms | 256us | 1ms | 4ms | 16ms | 64ms | 256ms | 1s | 4s | 16s | gt | max |
|---|---|---|---|---|---|---|---|---|---|---|---|
| pg1119_def.cx7_gcp_c2s60 | 99.838 | 0.111 | 0.044 | 0.007 | nonzero | nonzero | nonzero | 0.955 | |||
| pg1119_o3_native_lto.cx7_gcp_c2s60 | 99.842 | 0.108 | 0.043 | 0.007 | nonzero | nonzero | nonzero | 0.420 |
Insert response time histogram: each cell has the percentage of responses that take <= the time in the header and max is the max response time in seconds. For max values in the top 25% of the range have a red background and in the bottom 25% of the range have a green background. The red background is not used when the min value is within 80% of the max value.
| dbms | 256us | 1ms | 4ms | 16ms | 64ms | 256ms | 1s | 4s | 16s | gt | max |
|---|---|---|---|---|---|---|---|---|---|---|---|
| pg1119_def.cx7_gcp_c2s60 | 67.585 | 17.632 | 14.143 | 0.620 | 0.015 | 0.004 | 2.113 | ||||
| pg1119_o3_native_lto.cx7_gcp_c2s60 | 66.971 | 17.617 | 14.687 | 0.716 | 0.005 | 0.004 | 2.446 |
Performance metrics for the DBMS listed above. Some are normalized by throughput, others are not. Legend for results is here.
ips	qps	rps	rmbps	wps	wmbps	rpq	rkbpq	wpi	wkbpi	csps	cpups	cspq	cpupq	dbgb1	dbgb2	rss	maxop	p50	p99	tag
19748	191320	62	0.5	6460.2	297.5	0.000	0.003	0.327	15.428	649090	65.4	3.393	103	185.4	266.8	0.0	0.955	9510	8758	400m.pg1119_def.cx7_gcp_c2s60
19748	195925	63	0.5	6516.3	297.0	0.000	0.003	0.330	15.399	663899	65.4	3.389	100	185.4	268.1	0.0	0.420	9749	8966	400m.pg1119_o3_native_lto.cx7_gcp_c2s60
l.i0
l.i0: load without secondary indexes
Performance metrics for all DBMS, not just the ones listed above. Some are normalized by throughput, others are not. Legend for results is here.
ips	qps	rps	rmbps	wps	wmbps	rpq	rkbpq	wpi	wkbpi	csps	cpups	cspq	cpupq	dbgb1	dbgb2	rss	maxop	p50	p99	tag
1388889	0	0	0.0	1847.0	464.6	0.000	0.000	0.001	0.343	211205	61.0	0.152	13	38.3	103.2	NA	0.981	79014	9390	400m.pg1119_def.cx7_gcp_c2s60
1428571	0	0	0.0	1878.0	470.4	0.000	0.000	0.001	0.337	236836	59.9	0.166	13	38.3	103.2	NA	0.756	81410	8391	400m.pg1119_o3_native_lto.cx7_gcp_c2s60
l.x
l.x: create secondary indexes
Performance metrics for all DBMS, not just the ones listed above. Some are normalized by throughput, others are not. Legend for results is here.
ips	qps	rps	rmbps	wps	wmbps	rpq	rkbpq	wpi	wkbpi	csps	cpups	cspq	cpupq	dbgb1	dbgb2	rss	maxop	p50	p99	tag
2532278	0	9868	115.3	3474.3	845.9	0.004	0.047	0.001	0.342	100083	26.0	0.040	3	73.5	170.6	0.0	0.362	NA	NA	400m.pg1119_def.cx7_gcp_c2s60
2516352	0	7029	107.3	3445.1	849.0	0.003	0.044	0.001	0.345	102102	24.8	0.041	3	73.5	170.5	0.0	0.052	NA	NA	400m.pg1119_o3_native_lto.cx7_gcp_c2s60
l.i1
l.i1: continue load after secondary indexes created
Performance metrics for all DBMS, not just the ones listed above. Some are normalized by throughput, others are not. Legend for results is here.
ips	qps	rps	rmbps	wps	wmbps	rpq	rkbpq	wpi	wkbpi	csps	cpups	cspq	cpupq	dbgb1	dbgb2	rss	maxop	p50	p99	tag
403226	0	5371	43.2	3615.5	495.4	0.013	0.110	0.009	1.258	264836	50.6	0.657	38	165.8	320.3	NA	1.341	26621	1648	400m.pg1119_def.cx7_gcp_c2s60
406918	0	5063	45.3	3863.1	507.0	0.012	0.114	0.009	1.276	287873	50.4	0.707	37	165.8	323.6	NA	0.796	26421	1748	400m.pg1119_o3_native_lto.cx7_gcp_c2s60
q100.1
q100.1: range queries with 100 insert/s per client
Performance metrics for all DBMS, not just the ones listed above. Some are normalized by throughput, others are not. Legend for results is here.
ips	qps	rps	rmbps	wps	wmbps	rpq	rkbpq	wpi	wkbpi	csps	cpups	cspq	cpupq	dbgb1	dbgb2	rss	maxop	p50	p99	tag
1976	187781	0	0.0	4115.3	95.3	0.000	0.000	2.083	49.374	667106	62.9	3.553	100	166.6	289.3	0.0	0.026	9338	8982	400m.pg1119_def.cx7_gcp_c2s60
1976	191643	0	0.0	3998.1	98.2	0.000	0.000	2.024	50.878	679241	63.0	3.544	99	166.6	292.5	0.0	0.024	9541	9142	400m.pg1119_o3_native_lto.cx7_gcp_c2s60
q500.1
q500.1: range queries with 500 insert/s per client
Performance metrics for all DBMS, not just the ones listed above. Some are normalized by throughput, others are not. Legend for results is here.
ips	qps	rps	rmbps	wps	wmbps	rpq	rkbpq	wpi	wkbpi	csps	cpups	cspq	cpupq	dbgb1	dbgb2	rss	maxop	p50	p99	tag
9885	188800	0	0.0	6944.6	215.6	0.000	0.000	0.703	22.334	657913	64.0	3.485	102	171.6	259.0	0.0	0.053	9382	8902	400m.pg1119_def.cx7_gcp_c2s60
9885	193929	0	0.0	6879.7	212.6	0.000	0.000	0.696	22.025	672766	64.1	3.469	99	171.6	260.9	0.0	0.053	9625	9110	400m.pg1119_o3_native_lto.cx7_gcp_c2s60
q1000.1
q1000.1: range queries with 1000 insert/s per client
Performance metrics for all DBMS, not just the ones listed above. Some are normalized by throughput, others are not. Legend for results is here.
ips	qps	rps	rmbps	wps	wmbps	rpq	rkbpq	wpi	wkbpi	csps	cpups	cspq	cpupq	dbgb1	dbgb2	rss	maxop	p50	p99	tag
19748	191320	62	0.5	6460.2	297.5	0.000	0.003	0.327	15.428	649090	65.4	3.393	103	185.4	266.8	0.0	0.955	9510	8758	400m.pg1119_def.cx7_gcp_c2s60
19748	195925	63	0.5	6516.3	297.0	0.000	0.003	0.330	15.399	663899	65.4	3.389	100	185.4	268.1	0.0	0.420	9749	8966	400m.pg1119_o3_native_lto.cx7_gcp_c2s60
l.i0
- l.i0: load without secondary indexes
- Legend for results is here.
- Each entry lists the percentage of responses that fit in that bucket (slower than max time for previous bucket, faster than min time for next bucket).
Insert response time histogram
256us	1ms	4ms	16ms	64ms	256ms	1s	4s	16s	gt	max	tag
0.000	61.871	37.178	0.904	0.012	0.019	0.015	0.000	0.000	0.000	0.981	pg1119_def.cx7_gcp_c2s60
0.000	60.984	38.162	0.805	0.013	0.024	0.013	0.000	0.000	0.000	0.756	pg1119_o3_native_lto.cx7_gcp_c2s60
l.x
- l.x: create secondary indexes
- Legend for results is here.
- Each entry lists the percentage of responses that fit in that bucket (slower than max time for previous bucket, faster than min time for next bucket).
TODO - determine whether there is data for create index response time
l.i1
- l.i1: continue load after secondary indexes created
- Legend for results is here.
- Each entry lists the percentage of responses that fit in that bucket (slower than max time for previous bucket, faster than min time for next bucket).
Insert response time histogram
256us	1ms	4ms	16ms	64ms	256ms	1s	4s	16s	gt	max	tag
0.000	nonzero	96.066	2.246	1.642	0.033	0.011	0.001	0.000	0.000	1.341	pg1119_def.cx7_gcp_c2s60
0.000	0.010	96.127	2.179	1.641	0.033	0.010	0.000	0.000	0.000	0.796	pg1119_o3_native_lto.cx7_gcp_c2s60
q100.1
- q100.1: range queries with 100 insert/s per client
- Legend for results is here.
- Each entry lists the percentage of responses that fit in that bucket (slower than max time for previous bucket, faster than min time for next bucket).
Query response time histogram
256us	1ms	4ms	16ms	64ms	256ms	1s	4s	16s	gt	max	tag
99.967	0.026	0.006	0.001	nonzero	0.000	0.000	0.000	0.000	0.000	0.026	pg1119_def.cx7_gcp_c2s60
99.968	0.025	0.006	0.001	nonzero	0.000	0.000	0.000	0.000	0.000	0.024	pg1119_o3_native_lto.cx7_gcp_c2s60
Insert response time histogram
256us	1ms	4ms	16ms	64ms	256ms	1s	4s	16s	gt	max	tag
0.000	0.000	95.726	3.575	0.681	0.008	0.010	0.000	0.000	0.000	0.337	pg1119_def.cx7_gcp_c2s60
0.000	0.000	95.682	3.364	0.939	0.015	0.000	0.000	0.000	0.000	0.185	pg1119_o3_native_lto.cx7_gcp_c2s60
q500.1
- q500.1: range queries with 500 insert/s per client
- Legend for results is here.
- Each entry lists the percentage of responses that fit in that bucket (slower than max time for previous bucket, faster than min time for next bucket).
Query response time histogram
256us	1ms	4ms	16ms	64ms	256ms	1s	4s	16s	gt	max	tag
99.902	0.064	0.030	0.004	nonzero	0.000	0.000	0.000	0.000	0.000	0.053	pg1119_def.cx7_gcp_c2s60
99.906	0.061	0.029	0.004	nonzero	0.000	0.000	0.000	0.000	0.000	0.053	pg1119_o3_native_lto.cx7_gcp_c2s60
Insert response time histogram
256us	1ms	4ms	16ms	64ms	256ms	1s	4s	16s	gt	max	tag
0.000	0.000	43.824	26.244	28.555	1.372	0.005	0.000	0.000	0.000	0.332	pg1119_def.cx7_gcp_c2s60
0.000	0.000	43.888	25.996	28.537	1.577	0.002	0.000	0.000	0.000	0.326	pg1119_o3_native_lto.cx7_gcp_c2s60
q1000.1
- q1000.1: range queries with 1000 insert/s per client
- Legend for results is here.
- Each entry lists the percentage of responses that fit in that bucket (slower than max time for previous bucket, faster than min time for next bucket).
Query response time histogram
256us	1ms	4ms	16ms	64ms	256ms	1s	4s	16s	gt	max	tag
99.838	0.111	0.044	0.007	nonzero	nonzero	nonzero	0.000	0.000	0.000	0.955	pg1119_def.cx7_gcp_c2s60
99.842	0.108	0.043	0.007	nonzero	nonzero	nonzero	0.000	0.000	0.000	0.420	pg1119_o3_native_lto.cx7_gcp_c2s60
Insert response time histogram
256us	1ms	4ms	16ms	64ms	256ms	1s	4s	16s	gt	max	tag
0.000	0.000	67.585	17.632	14.143	0.620	0.015	0.004	0.000	0.000	2.113	pg1119_def.cx7_gcp_c2s60
0.000	0.000	66.971	17.617	14.687	0.716	0.005	0.004	0.000	0.000	2.446	pg1119_o3_native_lto.cx7_gcp_c2s60