Introduction
This is a report for the insert benchmark with 20M docs and 4 client(s). It is generated by scripts (bash, awk, sed) and Tufte might not be impressed. An overview of the insert benchmark is here and a short update is here. Below, by DBMS, I mean DBMS+version.config. An example is my8020.c10b40 where my means MySQL, 8020 is version 8.0.20 and c10b40 is the name for the configuration file.
The test server has 8 AMD cores, 16G RAM and an NVMe SSD. It is described here as the Beelink. The benchmark was run with 1 client and there were 1 or 2 connections per client (1 for queries, 1 for inserts). The benchmark loads 20M rows without secondary indexes, creates secondary indexes, loads another 20M rows then does 3 read+write tests for one hour each that do queries as fast as possible with 100, 500 and then 1000 writes/second/client concurrent with the queries. The database is cached by the storage engine and the only IO is for writes. Clients and the DBMS share one server. The per-database configs are in the per-database subdirectories here.
The tested DBMS are:
- fbmy8028_rel_withdbg.cay9c - MyRocks 8.0.28, the cay9c config and compiled with CMAKE_BUILD_TYPE=RelWithDebInfo and -O2
- fbmy8028_rel.cay9c - MyRocks 8.0.28, the cay9c config and compiled with CMAKE_BUILD_TYPE=Release and -O3
- fbmy8028_rel_o2.cay9c - MyRocks 8.0.28, the cay9c config and compiled with CMAKE_BUILD_TYPE=Release and -O2
- fbmy8028_rel_native.cay9c - MyRocks 8.0.28, the cay9c config and compiled with CMAKE_BUILD_TYPE=Release and -O3 -march=native -mtune=native
- fbmy8028_rel_o2_lto.cay9c - MyRocks 8.0.28, the cay9c config and compiled with CMAKE_BUILD_TYPE=Release and -O2 -flto
- fbmy8028_rel_lto.cay9c - MyRocks 8.0.28, the cay9c config and compiled with CMAKE_BUILD_TYPE=Release and -O3 -flto
- fbmy8028_rel_native_lto.cay9c - MyRocks 8.0.28, the cay9c config and compiled with CMAKE_BUILD_TYPE=Release and -O3 -flto -march=native -mtune=native
Contents
- Summary
- l.i0: load without secondary indexes
- l.x: create secondary indexes
- l.i1: continue load after secondary indexes created
- q100.1: range queries with 100 insert/s per client
- q500.1: range queries with 500 insert/s per client
- q1000.1: range queries with 1000 insert/s per client
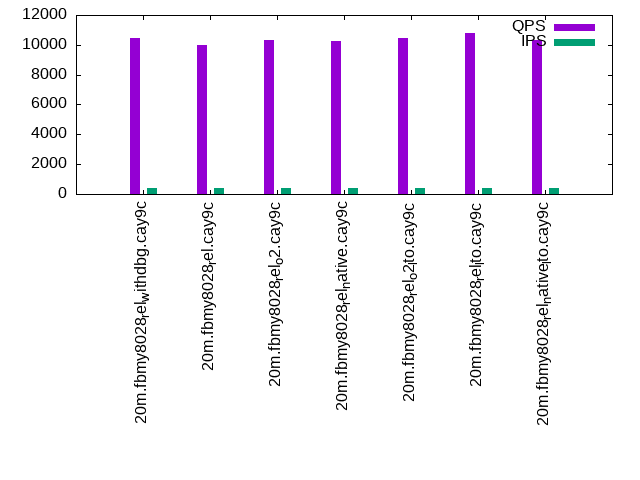
Summary
The numbers are inserts/s for l.i0 and l.i1, indexed docs (or rows) /s for l.x and queries/s for q*.2. The values are the average rate over the entire test for inserts (IPS) and queries (QPS). The range of values for IPS and QPS is split into 3 parts: bottom 25%, middle 50%, top 25%. Values in the bottom 25% have a red background, values in the top 25% have a green background and values in the middle have no color. A gray background is used for values that can be ignored because the DBMS did not sustain the target insert rate. Red backgrounds are not used when the minimum value is within 80% of the max value.
| dbms | l.i0 | l.x | l.i1 | q100.1 | q500.1 | q1000.1 |
|---|---|---|---|---|---|---|
| 20m.fbmy8028_rel_withdbg.cay9c | 153846 | 245122 | 79365 | 10453 | 10115 | 10130 |
| 20m.fbmy8028_rel.cay9c | 151515 | 275342 | 80000 | 9971 | 10068 | 9972 |
| 20m.fbmy8028_rel_o2.cay9c | 152672 | 245122 | 79365 | 10333 | 10131 | 10036 |
| 20m.fbmy8028_rel_native.cay9c | 153846 | 275342 | 79051 | 10231 | 10082 | 10028 |
| 20m.fbmy8028_rel_o2_lto.cay9c | 155039 | 245122 | 80645 | 10488 | 10416 | 10368 |
| 20m.fbmy8028_rel_lto.cay9c | 158730 | 279167 | 83333 | 10812 | 10437 | 10371 |
| 20m.fbmy8028_rel_native_lto.cay9c | 158730 | 287143 | 83333 | 10357 | 10405 | 10419 |
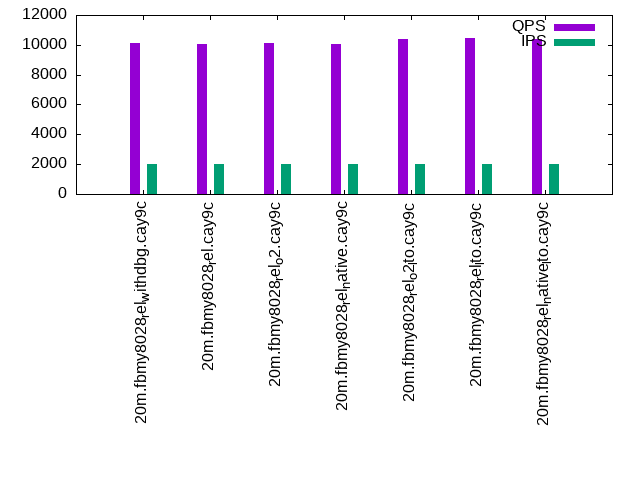
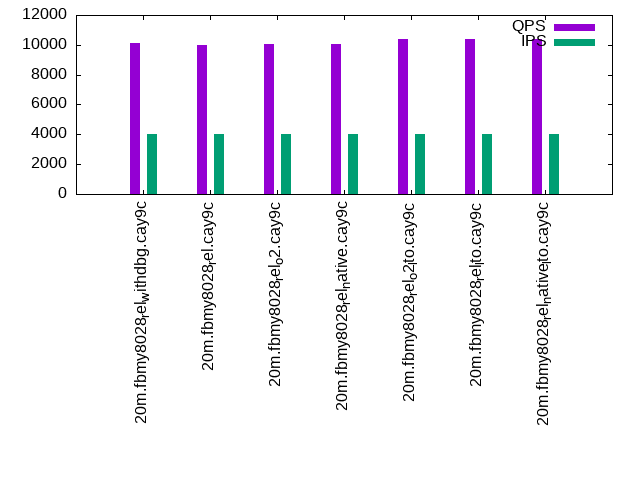
This lists the average rate of inserts/s for the tests that do inserts concurrent with queries. For such tests the query rate is listed in the table above. The read+write tests are setup so that the insert rate should match the target rate every second. Cells that are not at least 95% of the target have a red background to indicate a failure to satisfy the target.
| dbms | q100.1 | q500.1 | q1000.1 |
|---|---|---|---|
| fbmy8028_rel_withdbg.cay9c | 399 | 1993 | 3989 |
| fbmy8028_rel.cay9c | 399 | 1994 | 3989 |
| fbmy8028_rel_o2.cay9c | 399 | 1994 | 3989 |
| fbmy8028_rel_native.cay9c | 399 | 1994 | 3989 |
| fbmy8028_rel_o2_lto.cay9c | 399 | 1994 | 3989 |
| fbmy8028_rel_lto.cay9c | 399 | 1994 | 3989 |
| fbmy8028_rel_native_lto.cay9c | 399 | 1994 | 3989 |
| target | 400 | 2000 | 4000 |
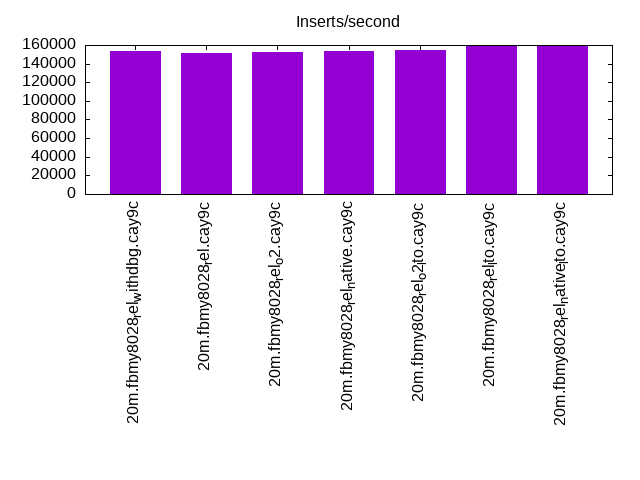
l.i0
l.i0: load without secondary indexes. Graphs for performance per 1-second interval are here.
Average throughput:
Insert response time histogram: each cell has the percentage of responses that take <= the time in the header and max is the max response time in seconds. For the max column values in the top 25% of the range have a red background and in the bottom 25% of the range have a green background. The red background is not used when the min value is within 80% of the max value.
| dbms | 256us | 1ms | 4ms | 16ms | 64ms | 256ms | 1s | 4s | 16s | gt | max |
|---|---|---|---|---|---|---|---|---|---|---|---|
| fbmy8028_rel_withdbg.cay9c | 99.265 | 0.525 | 0.197 | 0.013 | 0.134 | ||||||
| fbmy8028_rel.cay9c | 99.240 | 0.538 | 0.209 | 0.013 | 0.128 | ||||||
| fbmy8028_rel_o2.cay9c | 99.239 | 0.559 | 0.190 | 0.013 | 0.112 | ||||||
| fbmy8028_rel_native.cay9c | 99.249 | 0.548 | 0.190 | 0.013 | 0.126 | ||||||
| fbmy8028_rel_o2_lto.cay9c | 99.250 | 0.537 | 0.199 | 0.013 | 0.119 | ||||||
| fbmy8028_rel_lto.cay9c | 99.256 | 0.548 | 0.182 | 0.013 | 0.125 | ||||||
| fbmy8028_rel_native_lto.cay9c | 99.290 | 0.504 | 0.193 | 0.013 | 0.137 |
Performance metrics for the DBMS listed above. Some are normalized by throughput, others are not. Legend for results is here.
ips	qps	rps	rmbps	wps	wmbps	rpq	rkbpq	wpi	wkbpi	csps	cpups	cspq	cpupq	dbgb1	dbgb2	rss	maxop	p50	p99	tag
153846	0	0	0.0	107.7	42.6	0.000	0.000	0.001	0.284	15599	67.1	0.101	35	0.7	1.9	0.8	0.134	40856	34063	20m.fbmy8028_rel_withdbg.cay9c
151515	0	0	0.0	107.7	42.6	0.000	0.000	0.001	0.288	15716	66.8	0.104	35	0.7	1.9	0.7	0.128	41654	16692	20m.fbmy8028_rel.cay9c
152672	0	0	0.0	107.8	42.6	0.000	0.000	0.001	0.286	15586	67.1	0.102	35	0.7	1.9	0.8	0.112	41192	2798	20m.fbmy8028_rel_o2.cay9c
153846	0	0	0.0	107.8	42.6	0.000	0.000	0.001	0.284	15653	66.7	0.102	35	0.7	1.9	0.7	0.126	41551	14184	20m.fbmy8028_rel_native.cay9c
155039	0	0	0.0	111.0	44.0	0.000	0.000	0.001	0.291	15798	67.9	0.102	35	0.7	1.9	0.8	0.119	41255	24980	20m.fbmy8028_rel_o2_lto.cay9c
158730	0	0	0.0	111.6	44.3	0.000	0.000	0.001	0.286	15884	67.4	0.100	34	0.7	1.9	0.8	0.125	42454	18180	20m.fbmy8028_rel_lto.cay9c
158730	0	0	0.0	111.8	44.3	0.000	0.000	0.001	0.286	16041	67.2	0.101	34	0.7	1.9	0.7	0.137	42853	8890	20m.fbmy8028_rel_native_lto.cay9c
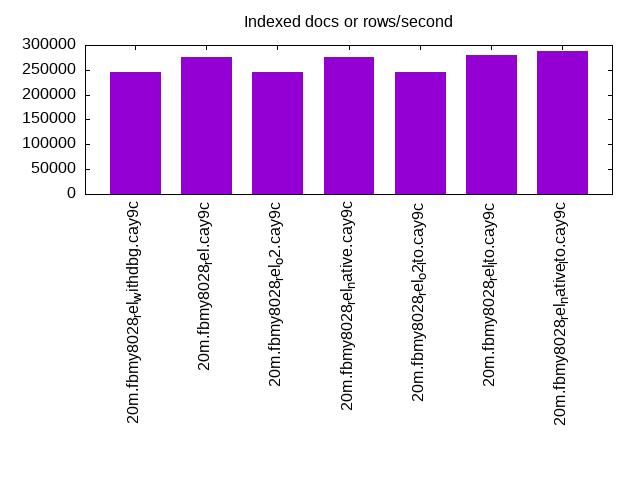
l.x
l.x: create secondary indexes.
Average throughput:
Performance metrics for the DBMS listed above. Some are normalized by throughput, others are not. Legend for results is here.
ips	qps	rps	rmbps	wps	wmbps	rpq	rkbpq	wpi	wkbpi	csps	cpups	cspq	cpupq	dbgb1	dbgb2	rss	maxop	p50	p99	tag
245122	0	1	0.0	98.0	40.6	0.000	0.000	0.000	0.170	671	48.2	0.003	16	1.4	2.7	2.2	0.014	NA	NA	20m.fbmy8028_rel_withdbg.cay9c
275342	0	0	0.0	105.3	44.7	0.000	0.000	0.000	0.166	650	47.9	0.002	14	1.4	2.7	2.2	0.014	NA	NA	20m.fbmy8028_rel.cay9c
245122	0	1	0.0	97.5	40.7	0.000	0.000	0.000	0.170	702	48.0	0.003	16	1.4	2.7	2.3	0.014	NA	NA	20m.fbmy8028_rel_o2.cay9c
275342	0	1	0.0	104.2	44.6	0.000	0.000	0.000	0.166	690	48.1	0.003	14	1.4	2.7	2.2	0.016	NA	NA	20m.fbmy8028_rel_native.cay9c
245122	0	1	0.0	98.2	41.0	0.000	0.000	0.000	0.171	688	48.4	0.003	16	1.4	2.7	2.2	0.017	NA	NA	20m.fbmy8028_rel_o2_lto.cay9c
279167	0	1	0.0	112.7	47.0	0.000	0.000	0.000	0.172	760	47.7	0.003	14	1.4	2.7	2.2	0.010	NA	NA	20m.fbmy8028_rel_lto.cay9c
287143	0	1	0.0	116.8	47.5	0.000	0.000	0.000	0.170	797	46.8	0.003	13	1.4	2.7	2.2	0.010	NA	NA	20m.fbmy8028_rel_native_lto.cay9c
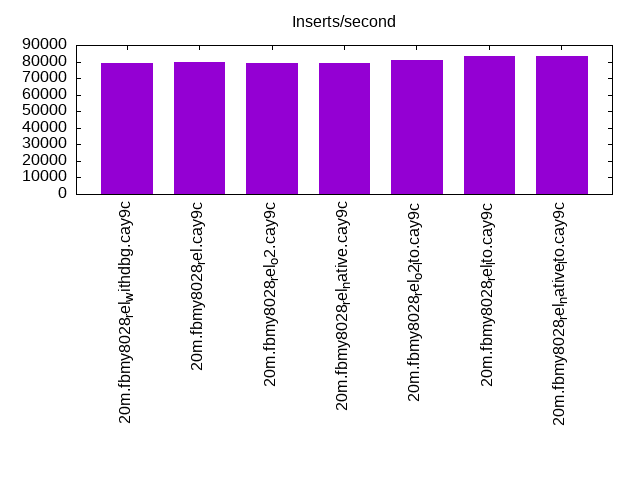
l.i1
l.i1: continue load after secondary indexes created. Graphs for performance per 1-second interval are here.
Average throughput:
Insert response time histogram: each cell has the percentage of responses that take <= the time in the header and max is the max response time in seconds. For the max column values in the top 25% of the range have a red background and in the bottom 25% of the range have a green background. The red background is not used when the min value is within 80% of the max value.
| dbms | 256us | 1ms | 4ms | 16ms | 64ms | 256ms | 1s | 4s | 16s | gt | max |
|---|---|---|---|---|---|---|---|---|---|---|---|
| fbmy8028_rel_withdbg.cay9c | 99.138 | 0.744 | 0.113 | 0.005 | 0.102 | ||||||
| fbmy8028_rel.cay9c | 99.166 | 0.720 | 0.108 | 0.005 | 0.124 | ||||||
| fbmy8028_rel_o2.cay9c | 99.144 | 0.749 | 0.102 | 0.004 | 0.133 | ||||||
| fbmy8028_rel_native.cay9c | 99.163 | 0.715 | 0.116 | 0.006 | 0.118 | ||||||
| fbmy8028_rel_o2_lto.cay9c | 99.183 | 0.695 | 0.116 | 0.006 | 0.119 | ||||||
| fbmy8028_rel_lto.cay9c | 99.260 | 0.628 | 0.105 | 0.007 | 0.121 | ||||||
| fbmy8028_rel_native_lto.cay9c | 99.208 | 0.684 | 0.100 | 0.007 | 0.117 |
Performance metrics for the DBMS listed above. Some are normalized by throughput, others are not. Legend for results is here.
ips	qps	rps	rmbps	wps	wmbps	rpq	rkbpq	wpi	wkbpi	csps	cpups	cspq	cpupq	dbgb1	dbgb2	rss	maxop	p50	p99	tag
79365	0	17	2.1	155.3	61.5	0.000	0.027	0.002	0.793	17132	74.7	0.216	75	4.9	6.8	2.7	0.102	20328	14285	20m.fbmy8028_rel_withdbg.cay9c
80000	0	16	1.9	160.0	63.1	0.000	0.025	0.002	0.808	17337	74.7	0.217	75	3.8	5.8	2.7	0.124	20678	15644	20m.fbmy8028_rel.cay9c
79365	0	15	1.8	156.9	62.0	0.000	0.024	0.002	0.800	17224	74.5	0.217	75	3.6	5.5	2.7	0.133	20278	15888	20m.fbmy8028_rel_o2.cay9c
79051	0	6	0.7	159.1	63.4	0.000	0.009	0.002	0.821	17299	73.9	0.219	75	4.2	6.1	2.8	0.118	20378	15533	20m.fbmy8028_rel_native.cay9c
80645	0	11	1.3	157.8	62.3	0.000	0.017	0.002	0.791	17393	75.2	0.216	75	3.8	5.7	2.7	0.119	20835	16083	20m.fbmy8028_rel_o2_lto.cay9c
83333	0	16	2.0	162.5	64.4	0.000	0.025	0.002	0.792	17743	74.5	0.213	72	3.4	5.3	2.8	0.121	21277	15788	20m.fbmy8028_rel_lto.cay9c
83333	0	18	2.2	165.0	65.8	0.000	0.027	0.002	0.809	17825	74.4	0.214	71	3.6	5.5	2.7	0.117	21184	15683	20m.fbmy8028_rel_native_lto.cay9c
q100.1
q100.1: range queries with 100 insert/s per client. Graphs for performance per 1-second interval are here.
Average throughput:
Query response time histogram: each cell has the percentage of responses that take <= the time in the header and max is the max response time in seconds. For max values in the top 25% of the range have a red background and in the bottom 25% of the range have a green background. The red background is not used when the min value is within 80% of the max value.
| dbms | 256us | 1ms | 4ms | 16ms | 64ms | 256ms | 1s | 4s | 16s | gt | max |
|---|---|---|---|---|---|---|---|---|---|---|---|
| fbmy8028_rel_withdbg.cay9c | 6.764 | 93.226 | 0.010 | 0.001 | nonzero | 0.022 | |||||
| fbmy8028_rel.cay9c | 3.645 | 96.340 | 0.014 | 0.001 | 0.009 | ||||||
| fbmy8028_rel_o2.cay9c | 6.056 | 93.934 | 0.010 | nonzero | 0.008 | ||||||
| fbmy8028_rel_native.cay9c | 6.272 | 93.714 | 0.013 | 0.001 | 0.013 | ||||||
| fbmy8028_rel_o2_lto.cay9c | 8.826 | 91.162 | 0.011 | 0.001 | 0.011 | ||||||
| fbmy8028_rel_lto.cay9c | 13.075 | 86.915 | 0.010 | nonzero | nonzero | 0.023 | |||||
| fbmy8028_rel_native_lto.cay9c | 8.859 | 91.130 | 0.010 | 0.001 | 0.013 |
Insert response time histogram: each cell has the percentage of responses that take <= the time in the header and max is the max response time in seconds. For max values in the top 25% of the range have a red background and in the bottom 25% of the range have a green background. The red background is not used when the min value is within 80% of the max value.
| dbms | 256us | 1ms | 4ms | 16ms | 64ms | 256ms | 1s | 4s | 16s | gt | max |
|---|---|---|---|---|---|---|---|---|---|---|---|
| fbmy8028_rel_withdbg.cay9c | 99.618 | 0.361 | 0.021 | 0.017 | |||||||
| fbmy8028_rel.cay9c | 99.493 | 0.458 | 0.049 | 0.018 | |||||||
| fbmy8028_rel_o2.cay9c | 99.646 | 0.312 | 0.042 | 0.023 | |||||||
| fbmy8028_rel_native.cay9c | 99.389 | 0.562 | 0.049 | 0.018 | |||||||
| fbmy8028_rel_o2_lto.cay9c | 99.611 | 0.340 | 0.049 | 0.018 | |||||||
| fbmy8028_rel_lto.cay9c | 99.521 | 0.431 | 0.049 | 0.017 | |||||||
| fbmy8028_rel_native_lto.cay9c | 99.729 | 0.236 | 0.035 | 0.017 |
Performance metrics for the DBMS listed above. Some are normalized by throughput, others are not. Legend for results is here.
ips	qps	rps	rmbps	wps	wmbps	rpq	rkbpq	wpi	wkbpi	csps	cpups	cspq	cpupq	dbgb1	dbgb2	rss	maxop	p50	p99	tag
399	10453	4	0.1	6.6	1.5	0.000	0.012	0.017	3.927	39480	51.2	3.777	392	2.8	4.9	6.1	0.022	2654	2142	20m.fbmy8028_rel_withdbg.cay9c
399	9971	14	0.2	6.7	1.6	0.001	0.016	0.017	4.062	37841	51.1	3.795	410	2.9	4.9	6.5	0.009	2557	2030	20m.fbmy8028_rel.cay9c
399	10333	9	0.1	7.0	1.7	0.001	0.015	0.018	4.425	39087	51.2	3.783	396	2.8	4.9	6.2	0.008	2637	2142	20m.fbmy8028_rel_o2.cay9c
399	10231	37	0.3	7.3	1.9	0.004	0.032	0.018	4.812	38798	51.3	3.792	401	2.8	4.9	7.0	0.013	2589	1967	20m.fbmy8028_rel_native.cay9c
399	10488	17	0.2	6.8	1.7	0.002	0.023	0.017	4.311	39650	51.2	3.780	391	2.8	4.9	6.4	0.011	2622	2046	20m.fbmy8028_rel_o2_lto.cay9c
399	10812	4	0.1	6.8	1.7	0.000	0.013	0.017	4.248	40849	51.2	3.778	379	2.8	4.9	6.0	0.023	2718	2237	20m.fbmy8028_rel_lto.cay9c
399	10357	9	0.1	6.6	1.5	0.001	0.012	0.016	3.886	39224	51.1	3.787	395	2.8	4.9	6.4	0.013	2589	2046	20m.fbmy8028_rel_native_lto.cay9c
q500.1
q500.1: range queries with 500 insert/s per client. Graphs for performance per 1-second interval are here.
Average throughput:
Query response time histogram: each cell has the percentage of responses that take <= the time in the header and max is the max response time in seconds. For max values in the top 25% of the range have a red background and in the bottom 25% of the range have a green background. The red background is not used when the min value is within 80% of the max value.
| dbms | 256us | 1ms | 4ms | 16ms | 64ms | 256ms | 1s | 4s | 16s | gt | max |
|---|---|---|---|---|---|---|---|---|---|---|---|
| fbmy8028_rel_withdbg.cay9c | 2.755 | 97.195 | 0.047 | 0.003 | nonzero | 0.020 | |||||
| fbmy8028_rel.cay9c | 3.032 | 96.908 | 0.056 | 0.004 | nonzero | 0.016 | |||||
| fbmy8028_rel_o2.cay9c | 2.057 | 97.890 | 0.050 | 0.003 | 0.016 | ||||||
| fbmy8028_rel_native.cay9c | 2.893 | 97.046 | 0.057 | 0.003 | nonzero | 0.017 | |||||
| fbmy8028_rel_o2_lto.cay9c | 7.370 | 92.578 | 0.048 | 0.004 | nonzero | 0.020 | |||||
| fbmy8028_rel_lto.cay9c | 7.737 | 92.217 | 0.044 | 0.003 | nonzero | 0.019 | |||||
| fbmy8028_rel_native_lto.cay9c | 8.196 | 91.752 | 0.048 | 0.003 | nonzero | 0.018 |
Insert response time histogram: each cell has the percentage of responses that take <= the time in the header and max is the max response time in seconds. For max values in the top 25% of the range have a red background and in the bottom 25% of the range have a green background. The red background is not used when the min value is within 80% of the max value.
| dbms | 256us | 1ms | 4ms | 16ms | 64ms | 256ms | 1s | 4s | 16s | gt | max |
|---|---|---|---|---|---|---|---|---|---|---|---|
| fbmy8028_rel_withdbg.cay9c | 95.058 | 4.833 | 0.108 | 0.062 | |||||||
| fbmy8028_rel.cay9c | 92.042 | 7.792 | 0.167 | 0.063 | |||||||
| fbmy8028_rel_o2.cay9c | 96.240 | 3.668 | 0.090 | 0.001 | 0.066 | ||||||
| fbmy8028_rel_native.cay9c | 95.953 | 3.947 | 0.099 | 0.001 | 0.066 | ||||||
| fbmy8028_rel_o2_lto.cay9c | 92.607 | 7.232 | 0.161 | 0.048 | |||||||
| fbmy8028_rel_lto.cay9c | 96.508 | 3.389 | 0.103 | 0.062 | |||||||
| fbmy8028_rel_native_lto.cay9c | 95.885 | 3.993 | 0.121 | 0.001 | 0.065 |
Performance metrics for the DBMS listed above. Some are normalized by throughput, others are not. Legend for results is here.
ips	qps	rps	rmbps	wps	wmbps	rpq	rkbpq	wpi	wkbpi	csps	cpups	cspq	cpupq	dbgb1	dbgb2	rss	maxop	p50	p99	tag
1993	10115	0	0.0	7.3	1.9	0.000	0.000	0.004	0.972	38110	51.9	3.768	410	3.2	3.7	8.2	0.020	2558	2094	20m.fbmy8028_rel_withdbg.cay9c
1994	10068	0	0.0	7.7	2.1	0.000	0.000	0.004	1.063	37931	51.9	3.768	412	3.1	3.6	8.5	0.016	2509	2062	20m.fbmy8028_rel.cay9c
1994	10131	0	0.0	7.1	1.8	0.000	0.000	0.004	0.919	38134	51.9	3.764	410	3.2	3.7	8.3	0.016	2573	2094	20m.fbmy8028_rel_o2.cay9c
1994	10082	0	0.0	7.1	1.7	0.000	0.000	0.004	0.880	38122	51.6	3.781	409	3.2	3.7	8.4	0.017	2525	2047	20m.fbmy8028_rel_native.cay9c
1994	10416	0	0.0	8.0	2.1	0.000	0.000	0.004	1.104	39090	52.1	3.753	400	3.1	3.6	9.4	0.020	2589	2110	20m.fbmy8028_rel_o2_lto.cay9c
1994	10437	0	0.0	7.2	1.8	0.000	0.000	0.004	0.938	39316	51.8	3.767	397	3.2	3.7	8.1	0.019	2637	2190	20m.fbmy8028_rel_lto.cay9c
1994	10405	0	0.0	8.1	2.2	0.000	0.000	0.004	1.141	39172	51.9	3.765	399	3.1	3.6	8.7	0.018	2589	2127	20m.fbmy8028_rel_native_lto.cay9c
q1000.1
q1000.1: range queries with 1000 insert/s per client. Graphs for performance per 1-second interval are here.
Average throughput:
Query response time histogram: each cell has the percentage of responses that take <= the time in the header and max is the max response time in seconds. For max values in the top 25% of the range have a red background and in the bottom 25% of the range have a green background. The red background is not used when the min value is within 80% of the max value.
| dbms | 256us | 1ms | 4ms | 16ms | 64ms | 256ms | 1s | 4s | 16s | gt | max |
|---|---|---|---|---|---|---|---|---|---|---|---|
| fbmy8028_rel_withdbg.cay9c | 2.426 | 97.429 | 0.131 | 0.013 | nonzero | 0.024 | |||||
| fbmy8028_rel.cay9c | 1.778 | 98.056 | 0.152 | 0.014 | nonzero | 0.020 | |||||
| fbmy8028_rel_o2.cay9c | 2.034 | 97.805 | 0.147 | 0.014 | nonzero | 0.025 | |||||
| fbmy8028_rel_native.cay9c | 2.658 | 97.171 | 0.156 | 0.015 | nonzero | 0.026 | |||||
| fbmy8028_rel_o2_lto.cay9c | 5.165 | 94.711 | 0.116 | 0.009 | nonzero | 0.026 | |||||
| fbmy8028_rel_lto.cay9c | 6.245 | 93.618 | 0.125 | 0.012 | nonzero | 0.024 | |||||
| fbmy8028_rel_native_lto.cay9c | 6.996 | 92.868 | 0.125 | 0.010 | nonzero | 0.022 |
Insert response time histogram: each cell has the percentage of responses that take <= the time in the header and max is the max response time in seconds. For max values in the top 25% of the range have a red background and in the bottom 25% of the range have a green background. The red background is not used when the min value is within 80% of the max value.
| dbms | 256us | 1ms | 4ms | 16ms | 64ms | 256ms | 1s | 4s | 16s | gt | max |
|---|---|---|---|---|---|---|---|---|---|---|---|
| fbmy8028_rel_withdbg.cay9c | 84.029 | 15.770 | 0.201 | 0.059 | |||||||
| fbmy8028_rel.cay9c | 84.764 | 15.040 | 0.195 | 0.001 | 0.068 | ||||||
| fbmy8028_rel_o2.cay9c | 85.478 | 14.340 | 0.182 | 0.056 | |||||||
| fbmy8028_rel_native.cay9c | 92.763 | 7.125 | 0.112 | 0.063 | |||||||
| fbmy8028_rel_o2_lto.cay9c | 93.538 | 6.324 | 0.137 | 0.001 | 0.074 | ||||||
| fbmy8028_rel_lto.cay9c | 90.719 | 9.133 | 0.147 | 0.001 | 0.070 | ||||||
| fbmy8028_rel_native_lto.cay9c | 93.031 | 6.841 | 0.127 | 0.001 | 0.076 |
Performance metrics for the DBMS listed above. Some are normalized by throughput, others are not. Legend for results is here.
ips	qps	rps	rmbps	wps	wmbps	rpq	rkbpq	wpi	wkbpi	csps	cpups	cspq	cpupq	dbgb1	dbgb2	rss	maxop	p50	p99	tag
3989	10130	10	0.5	15.7	4.8	0.001	0.052	0.004	1.221	37426	53.9	3.695	426	3.7	5.1	10.8	0.024	2541	2062	20m.fbmy8028_rel_withdbg.cay9c
3989	9972	5	0.5	15.3	4.7	0.001	0.051	0.004	1.201	37004	53.8	3.711	432	3.7	5.1	10.7	0.020	2493	2046	20m.fbmy8028_rel.cay9c
3989	10036	9	0.5	16.1	4.9	0.001	0.051	0.004	1.260	37165	53.9	3.703	430	3.7	5.1	10.9	0.025	2525	2078	20m.fbmy8028_rel_o2.cay9c
3989	10028	20	0.8	16.5	5.2	0.002	0.085	0.004	1.325	37246	54.1	3.714	432	3.7	5.1	10.4	0.026	2493	2047	20m.fbmy8028_rel_native.cay9c
3989	10368	17	0.6	14.8	4.4	0.002	0.064	0.004	1.130	38473	53.7	3.711	414	3.9	5.3	10.8	0.026	2590	2142	20m.fbmy8028_rel_o2_lto.cay9c
3989	10371	9	0.6	15.6	4.8	0.001	0.055	0.004	1.225	38413	53.8	3.704	415	3.7	5.1	10.8	0.024	2605	2174	20m.fbmy8028_rel_lto.cay9c
3989	10419	17	0.7	14.4	4.3	0.002	0.069	0.004	1.112	38725	53.6	3.717	412	4.0	5.4	10.7	0.022	2590	2141	20m.fbmy8028_rel_native_lto.cay9c
l.i0
l.i0: load without secondary indexes
Performance metrics for all DBMS, not just the ones listed above. Some are normalized by throughput, others are not. Legend for results is here.
ips	qps	rps	rmbps	wps	wmbps	rpq	rkbpq	wpi	wkbpi	csps	cpups	cspq	cpupq	dbgb1	dbgb2	rss	maxop	p50	p99	tag
153846	0	0	0.0	107.7	42.6	0.000	0.000	0.001	0.284	15599	67.1	0.101	35	0.7	1.9	0.8	0.134	40856	34063	20m.fbmy8028_rel_withdbg.cay9c
151515	0	0	0.0	107.7	42.6	0.000	0.000	0.001	0.288	15716	66.8	0.104	35	0.7	1.9	0.7	0.128	41654	16692	20m.fbmy8028_rel.cay9c
152672	0	0	0.0	107.8	42.6	0.000	0.000	0.001	0.286	15586	67.1	0.102	35	0.7	1.9	0.8	0.112	41192	2798	20m.fbmy8028_rel_o2.cay9c
153846	0	0	0.0	107.8	42.6	0.000	0.000	0.001	0.284	15653	66.7	0.102	35	0.7	1.9	0.7	0.126	41551	14184	20m.fbmy8028_rel_native.cay9c
155039	0	0	0.0	111.0	44.0	0.000	0.000	0.001	0.291	15798	67.9	0.102	35	0.7	1.9	0.8	0.119	41255	24980	20m.fbmy8028_rel_o2_lto.cay9c
158730	0	0	0.0	111.6	44.3	0.000	0.000	0.001	0.286	15884	67.4	0.100	34	0.7	1.9	0.8	0.125	42454	18180	20m.fbmy8028_rel_lto.cay9c
158730	0	0	0.0	111.8	44.3	0.000	0.000	0.001	0.286	16041	67.2	0.101	34	0.7	1.9	0.7	0.137	42853	8890	20m.fbmy8028_rel_native_lto.cay9c
l.x
l.x: create secondary indexes
Performance metrics for all DBMS, not just the ones listed above. Some are normalized by throughput, others are not. Legend for results is here.
ips	qps	rps	rmbps	wps	wmbps	rpq	rkbpq	wpi	wkbpi	csps	cpups	cspq	cpupq	dbgb1	dbgb2	rss	maxop	p50	p99	tag
245122	0	1	0.0	98.0	40.6	0.000	0.000	0.000	0.170	671	48.2	0.003	16	1.4	2.7	2.2	0.014	NA	NA	20m.fbmy8028_rel_withdbg.cay9c
275342	0	0	0.0	105.3	44.7	0.000	0.000	0.000	0.166	650	47.9	0.002	14	1.4	2.7	2.2	0.014	NA	NA	20m.fbmy8028_rel.cay9c
245122	0	1	0.0	97.5	40.7	0.000	0.000	0.000	0.170	702	48.0	0.003	16	1.4	2.7	2.3	0.014	NA	NA	20m.fbmy8028_rel_o2.cay9c
275342	0	1	0.0	104.2	44.6	0.000	0.000	0.000	0.166	690	48.1	0.003	14	1.4	2.7	2.2	0.016	NA	NA	20m.fbmy8028_rel_native.cay9c
245122	0	1	0.0	98.2	41.0	0.000	0.000	0.000	0.171	688	48.4	0.003	16	1.4	2.7	2.2	0.017	NA	NA	20m.fbmy8028_rel_o2_lto.cay9c
279167	0	1	0.0	112.7	47.0	0.000	0.000	0.000	0.172	760	47.7	0.003	14	1.4	2.7	2.2	0.010	NA	NA	20m.fbmy8028_rel_lto.cay9c
287143	0	1	0.0	116.8	47.5	0.000	0.000	0.000	0.170	797	46.8	0.003	13	1.4	2.7	2.2	0.010	NA	NA	20m.fbmy8028_rel_native_lto.cay9c
l.i1
l.i1: continue load after secondary indexes created
Performance metrics for all DBMS, not just the ones listed above. Some are normalized by throughput, others are not. Legend for results is here.
ips	qps	rps	rmbps	wps	wmbps	rpq	rkbpq	wpi	wkbpi	csps	cpups	cspq	cpupq	dbgb1	dbgb2	rss	maxop	p50	p99	tag
79365	0	17	2.1	155.3	61.5	0.000	0.027	0.002	0.793	17132	74.7	0.216	75	4.9	6.8	2.7	0.102	20328	14285	20m.fbmy8028_rel_withdbg.cay9c
80000	0	16	1.9	160.0	63.1	0.000	0.025	0.002	0.808	17337	74.7	0.217	75	3.8	5.8	2.7	0.124	20678	15644	20m.fbmy8028_rel.cay9c
79365	0	15	1.8	156.9	62.0	0.000	0.024	0.002	0.800	17224	74.5	0.217	75	3.6	5.5	2.7	0.133	20278	15888	20m.fbmy8028_rel_o2.cay9c
79051	0	6	0.7	159.1	63.4	0.000	0.009	0.002	0.821	17299	73.9	0.219	75	4.2	6.1	2.8	0.118	20378	15533	20m.fbmy8028_rel_native.cay9c
80645	0	11	1.3	157.8	62.3	0.000	0.017	0.002	0.791	17393	75.2	0.216	75	3.8	5.7	2.7	0.119	20835	16083	20m.fbmy8028_rel_o2_lto.cay9c
83333	0	16	2.0	162.5	64.4	0.000	0.025	0.002	0.792	17743	74.5	0.213	72	3.4	5.3	2.8	0.121	21277	15788	20m.fbmy8028_rel_lto.cay9c
83333	0	18	2.2	165.0	65.8	0.000	0.027	0.002	0.809	17825	74.4	0.214	71	3.6	5.5	2.7	0.117	21184	15683	20m.fbmy8028_rel_native_lto.cay9c
q100.1
q100.1: range queries with 100 insert/s per client
Performance metrics for all DBMS, not just the ones listed above. Some are normalized by throughput, others are not. Legend for results is here.
ips	qps	rps	rmbps	wps	wmbps	rpq	rkbpq	wpi	wkbpi	csps	cpups	cspq	cpupq	dbgb1	dbgb2	rss	maxop	p50	p99	tag
399	10453	4	0.1	6.6	1.5	0.000	0.012	0.017	3.927	39480	51.2	3.777	392	2.8	4.9	6.1	0.022	2654	2142	20m.fbmy8028_rel_withdbg.cay9c
399	9971	14	0.2	6.7	1.6	0.001	0.016	0.017	4.062	37841	51.1	3.795	410	2.9	4.9	6.5	0.009	2557	2030	20m.fbmy8028_rel.cay9c
399	10333	9	0.1	7.0	1.7	0.001	0.015	0.018	4.425	39087	51.2	3.783	396	2.8	4.9	6.2	0.008	2637	2142	20m.fbmy8028_rel_o2.cay9c
399	10231	37	0.3	7.3	1.9	0.004	0.032	0.018	4.812	38798	51.3	3.792	401	2.8	4.9	7.0	0.013	2589	1967	20m.fbmy8028_rel_native.cay9c
399	10488	17	0.2	6.8	1.7	0.002	0.023	0.017	4.311	39650	51.2	3.780	391	2.8	4.9	6.4	0.011	2622	2046	20m.fbmy8028_rel_o2_lto.cay9c
399	10812	4	0.1	6.8	1.7	0.000	0.013	0.017	4.248	40849	51.2	3.778	379	2.8	4.9	6.0	0.023	2718	2237	20m.fbmy8028_rel_lto.cay9c
399	10357	9	0.1	6.6	1.5	0.001	0.012	0.016	3.886	39224	51.1	3.787	395	2.8	4.9	6.4	0.013	2589	2046	20m.fbmy8028_rel_native_lto.cay9c
q500.1
q500.1: range queries with 500 insert/s per client
Performance metrics for all DBMS, not just the ones listed above. Some are normalized by throughput, others are not. Legend for results is here.
ips	qps	rps	rmbps	wps	wmbps	rpq	rkbpq	wpi	wkbpi	csps	cpups	cspq	cpupq	dbgb1	dbgb2	rss	maxop	p50	p99	tag
1993	10115	0	0.0	7.3	1.9	0.000	0.000	0.004	0.972	38110	51.9	3.768	410	3.2	3.7	8.2	0.020	2558	2094	20m.fbmy8028_rel_withdbg.cay9c
1994	10068	0	0.0	7.7	2.1	0.000	0.000	0.004	1.063	37931	51.9	3.768	412	3.1	3.6	8.5	0.016	2509	2062	20m.fbmy8028_rel.cay9c
1994	10131	0	0.0	7.1	1.8	0.000	0.000	0.004	0.919	38134	51.9	3.764	410	3.2	3.7	8.3	0.016	2573	2094	20m.fbmy8028_rel_o2.cay9c
1994	10082	0	0.0	7.1	1.7	0.000	0.000	0.004	0.880	38122	51.6	3.781	409	3.2	3.7	8.4	0.017	2525	2047	20m.fbmy8028_rel_native.cay9c
1994	10416	0	0.0	8.0	2.1	0.000	0.000	0.004	1.104	39090	52.1	3.753	400	3.1	3.6	9.4	0.020	2589	2110	20m.fbmy8028_rel_o2_lto.cay9c
1994	10437	0	0.0	7.2	1.8	0.000	0.000	0.004	0.938	39316	51.8	3.767	397	3.2	3.7	8.1	0.019	2637	2190	20m.fbmy8028_rel_lto.cay9c
1994	10405	0	0.0	8.1	2.2	0.000	0.000	0.004	1.141	39172	51.9	3.765	399	3.1	3.6	8.7	0.018	2589	2127	20m.fbmy8028_rel_native_lto.cay9c
q1000.1
q1000.1: range queries with 1000 insert/s per client
Performance metrics for all DBMS, not just the ones listed above. Some are normalized by throughput, others are not. Legend for results is here.
ips	qps	rps	rmbps	wps	wmbps	rpq	rkbpq	wpi	wkbpi	csps	cpups	cspq	cpupq	dbgb1	dbgb2	rss	maxop	p50	p99	tag
3989	10130	10	0.5	15.7	4.8	0.001	0.052	0.004	1.221	37426	53.9	3.695	426	3.7	5.1	10.8	0.024	2541	2062	20m.fbmy8028_rel_withdbg.cay9c
3989	9972	5	0.5	15.3	4.7	0.001	0.051	0.004	1.201	37004	53.8	3.711	432	3.7	5.1	10.7	0.020	2493	2046	20m.fbmy8028_rel.cay9c
3989	10036	9	0.5	16.1	4.9	0.001	0.051	0.004	1.260	37165	53.9	3.703	430	3.7	5.1	10.9	0.025	2525	2078	20m.fbmy8028_rel_o2.cay9c
3989	10028	20	0.8	16.5	5.2	0.002	0.085	0.004	1.325	37246	54.1	3.714	432	3.7	5.1	10.4	0.026	2493	2047	20m.fbmy8028_rel_native.cay9c
3989	10368	17	0.6	14.8	4.4	0.002	0.064	0.004	1.130	38473	53.7	3.711	414	3.9	5.3	10.8	0.026	2590	2142	20m.fbmy8028_rel_o2_lto.cay9c
3989	10371	9	0.6	15.6	4.8	0.001	0.055	0.004	1.225	38413	53.8	3.704	415	3.7	5.1	10.8	0.024	2605	2174	20m.fbmy8028_rel_lto.cay9c
3989	10419	17	0.7	14.4	4.3	0.002	0.069	0.004	1.112	38725	53.6	3.717	412	4.0	5.4	10.7	0.022	2590	2141	20m.fbmy8028_rel_native_lto.cay9c
l.i0
- l.i0: load without secondary indexes
- Legend for results is here.
- Each entry lists the percentage of responses that fit in that bucket (slower than max time for previous bucket, faster than min time for next bucket).
Insert response time histogram
256us	1ms	4ms	16ms	64ms	256ms	1s	4s	16s	gt	max	tag
0.000	0.000	99.265	0.525	0.197	0.013	0.000	0.000	0.000	0.000	0.134	fbmy8028_rel_withdbg.cay9c
0.000	0.000	99.240	0.538	0.209	0.013	0.000	0.000	0.000	0.000	0.128	fbmy8028_rel.cay9c
0.000	0.000	99.239	0.559	0.190	0.013	0.000	0.000	0.000	0.000	0.112	fbmy8028_rel_o2.cay9c
0.000	0.000	99.249	0.548	0.190	0.013	0.000	0.000	0.000	0.000	0.126	fbmy8028_rel_native.cay9c
0.000	0.000	99.250	0.537	0.199	0.013	0.000	0.000	0.000	0.000	0.119	fbmy8028_rel_o2_lto.cay9c
0.000	0.000	99.256	0.548	0.182	0.013	0.000	0.000	0.000	0.000	0.125	fbmy8028_rel_lto.cay9c
0.000	0.000	99.290	0.504	0.193	0.013	0.000	0.000	0.000	0.000	0.137	fbmy8028_rel_native_lto.cay9c
l.x
- l.x: create secondary indexes
- Legend for results is here.
- Each entry lists the percentage of responses that fit in that bucket (slower than max time for previous bucket, faster than min time for next bucket).
TODO - determine whether there is data for create index response time
l.i1
- l.i1: continue load after secondary indexes created
- Legend for results is here.
- Each entry lists the percentage of responses that fit in that bucket (slower than max time for previous bucket, faster than min time for next bucket).
Insert response time histogram
256us	1ms	4ms	16ms	64ms	256ms	1s	4s	16s	gt	max	tag
0.000	0.000	99.138	0.744	0.113	0.005	0.000	0.000	0.000	0.000	0.102	fbmy8028_rel_withdbg.cay9c
0.000	0.000	99.166	0.720	0.108	0.005	0.000	0.000	0.000	0.000	0.124	fbmy8028_rel.cay9c
0.000	0.000	99.144	0.749	0.102	0.004	0.000	0.000	0.000	0.000	0.133	fbmy8028_rel_o2.cay9c
0.000	0.000	99.163	0.715	0.116	0.006	0.000	0.000	0.000	0.000	0.118	fbmy8028_rel_native.cay9c
0.000	0.000	99.183	0.695	0.116	0.006	0.000	0.000	0.000	0.000	0.119	fbmy8028_rel_o2_lto.cay9c
0.000	0.000	99.260	0.628	0.105	0.007	0.000	0.000	0.000	0.000	0.121	fbmy8028_rel_lto.cay9c
0.000	0.000	99.208	0.684	0.100	0.007	0.000	0.000	0.000	0.000	0.117	fbmy8028_rel_native_lto.cay9c
q100.1
- q100.1: range queries with 100 insert/s per client
- Legend for results is here.
- Each entry lists the percentage of responses that fit in that bucket (slower than max time for previous bucket, faster than min time for next bucket).
Query response time histogram
256us	1ms	4ms	16ms	64ms	256ms	1s	4s	16s	gt	max	tag
6.764	93.226	0.010	0.001	nonzero	0.000	0.000	0.000	0.000	0.000	0.022	fbmy8028_rel_withdbg.cay9c
3.645	96.340	0.014	0.001	0.000	0.000	0.000	0.000	0.000	0.000	0.009	fbmy8028_rel.cay9c
6.056	93.934	0.010	nonzero	0.000	0.000	0.000	0.000	0.000	0.000	0.008	fbmy8028_rel_o2.cay9c
6.272	93.714	0.013	0.001	0.000	0.000	0.000	0.000	0.000	0.000	0.013	fbmy8028_rel_native.cay9c
8.826	91.162	0.011	0.001	0.000	0.000	0.000	0.000	0.000	0.000	0.011	fbmy8028_rel_o2_lto.cay9c
13.075	86.915	0.010	nonzero	nonzero	0.000	0.000	0.000	0.000	0.000	0.023	fbmy8028_rel_lto.cay9c
8.859	91.130	0.010	0.001	0.000	0.000	0.000	0.000	0.000	0.000	0.013	fbmy8028_rel_native_lto.cay9c
Insert response time histogram
256us	1ms	4ms	16ms	64ms	256ms	1s	4s	16s	gt	max	tag
0.000	0.000	99.618	0.361	0.021	0.000	0.000	0.000	0.000	0.000	0.017	fbmy8028_rel_withdbg.cay9c
0.000	0.000	99.493	0.458	0.049	0.000	0.000	0.000	0.000	0.000	0.018	fbmy8028_rel.cay9c
0.000	0.000	99.646	0.312	0.042	0.000	0.000	0.000	0.000	0.000	0.023	fbmy8028_rel_o2.cay9c
0.000	0.000	99.389	0.562	0.049	0.000	0.000	0.000	0.000	0.000	0.018	fbmy8028_rel_native.cay9c
0.000	0.000	99.611	0.340	0.049	0.000	0.000	0.000	0.000	0.000	0.018	fbmy8028_rel_o2_lto.cay9c
0.000	0.000	99.521	0.431	0.049	0.000	0.000	0.000	0.000	0.000	0.017	fbmy8028_rel_lto.cay9c
0.000	0.000	99.729	0.236	0.035	0.000	0.000	0.000	0.000	0.000	0.017	fbmy8028_rel_native_lto.cay9c
q500.1
- q500.1: range queries with 500 insert/s per client
- Legend for results is here.
- Each entry lists the percentage of responses that fit in that bucket (slower than max time for previous bucket, faster than min time for next bucket).
Query response time histogram
256us	1ms	4ms	16ms	64ms	256ms	1s	4s	16s	gt	max	tag
2.755	97.195	0.047	0.003	nonzero	0.000	0.000	0.000	0.000	0.000	0.020	fbmy8028_rel_withdbg.cay9c
3.032	96.908	0.056	0.004	nonzero	0.000	0.000	0.000	0.000	0.000	0.016	fbmy8028_rel.cay9c
2.057	97.890	0.050	0.003	0.000	0.000	0.000	0.000	0.000	0.000	0.016	fbmy8028_rel_o2.cay9c
2.893	97.046	0.057	0.003	nonzero	0.000	0.000	0.000	0.000	0.000	0.017	fbmy8028_rel_native.cay9c
7.370	92.578	0.048	0.004	nonzero	0.000	0.000	0.000	0.000	0.000	0.020	fbmy8028_rel_o2_lto.cay9c
7.737	92.217	0.044	0.003	nonzero	0.000	0.000	0.000	0.000	0.000	0.019	fbmy8028_rel_lto.cay9c
8.196	91.752	0.048	0.003	nonzero	0.000	0.000	0.000	0.000	0.000	0.018	fbmy8028_rel_native_lto.cay9c
Insert response time histogram
256us	1ms	4ms	16ms	64ms	256ms	1s	4s	16s	gt	max	tag
0.000	0.000	95.058	4.833	0.108	0.000	0.000	0.000	0.000	0.000	0.062	fbmy8028_rel_withdbg.cay9c
0.000	0.000	92.042	7.792	0.167	0.000	0.000	0.000	0.000	0.000	0.063	fbmy8028_rel.cay9c
0.000	0.000	96.240	3.668	0.090	0.001	0.000	0.000	0.000	0.000	0.066	fbmy8028_rel_o2.cay9c
0.000	0.000	95.953	3.947	0.099	0.001	0.000	0.000	0.000	0.000	0.066	fbmy8028_rel_native.cay9c
0.000	0.000	92.607	7.232	0.161	0.000	0.000	0.000	0.000	0.000	0.048	fbmy8028_rel_o2_lto.cay9c
0.000	0.000	96.508	3.389	0.103	0.000	0.000	0.000	0.000	0.000	0.062	fbmy8028_rel_lto.cay9c
0.000	0.000	95.885	3.993	0.121	0.001	0.000	0.000	0.000	0.000	0.065	fbmy8028_rel_native_lto.cay9c
q1000.1
- q1000.1: range queries with 1000 insert/s per client
- Legend for results is here.
- Each entry lists the percentage of responses that fit in that bucket (slower than max time for previous bucket, faster than min time for next bucket).
Query response time histogram
256us	1ms	4ms	16ms	64ms	256ms	1s	4s	16s	gt	max	tag
2.426	97.429	0.131	0.013	nonzero	0.000	0.000	0.000	0.000	0.000	0.024	fbmy8028_rel_withdbg.cay9c
1.778	98.056	0.152	0.014	nonzero	0.000	0.000	0.000	0.000	0.000	0.020	fbmy8028_rel.cay9c
2.034	97.805	0.147	0.014	nonzero	0.000	0.000	0.000	0.000	0.000	0.025	fbmy8028_rel_o2.cay9c
2.658	97.171	0.156	0.015	nonzero	0.000	0.000	0.000	0.000	0.000	0.026	fbmy8028_rel_native.cay9c
5.165	94.711	0.116	0.009	nonzero	0.000	0.000	0.000	0.000	0.000	0.026	fbmy8028_rel_o2_lto.cay9c
6.245	93.618	0.125	0.012	nonzero	0.000	0.000	0.000	0.000	0.000	0.024	fbmy8028_rel_lto.cay9c
6.996	92.868	0.125	0.010	nonzero	0.000	0.000	0.000	0.000	0.000	0.022	fbmy8028_rel_native_lto.cay9c
Insert response time histogram
256us	1ms	4ms	16ms	64ms	256ms	1s	4s	16s	gt	max	tag
0.000	0.000	84.029	15.770	0.201	0.000	0.000	0.000	0.000	0.000	0.059	fbmy8028_rel_withdbg.cay9c
0.000	0.000	84.764	15.040	0.195	0.001	0.000	0.000	0.000	0.000	0.068	fbmy8028_rel.cay9c
0.000	0.000	85.478	14.340	0.182	0.000	0.000	0.000	0.000	0.000	0.056	fbmy8028_rel_o2.cay9c
0.000	0.000	92.763	7.125	0.112	0.000	0.000	0.000	0.000	0.000	0.063	fbmy8028_rel_native.cay9c
0.000	0.000	93.538	6.324	0.137	0.001	0.000	0.000	0.000	0.000	0.074	fbmy8028_rel_o2_lto.cay9c
0.000	0.000	90.719	9.133	0.147	0.001	0.000	0.000	0.000	0.000	0.070	fbmy8028_rel_lto.cay9c
0.000	0.000	93.031	6.841	0.127	0.001	0.000	0.000	0.000	0.000	0.076	fbmy8028_rel_native_lto.cay9c