Introduction
This is a report for the insert benchmark with 20M docs and 4 client(s). It is generated by scripts (bash, awk, sed) and Tufte might not be impressed. An overview of the insert benchmark is here and a short update is here. Below, by DBMS, I mean DBMS+version.config. An example is my8020.c10b40 where my means MySQL, 8020 is version 8.0.20 and c10b40 is the name for the configuration file.
The test server has 8 AMD cores, 16G RAM and an NVMe SSD. It is described here as the Beelink. The benchmark was run with 1 client and there were 1 or 2 connections per client (1 for queries, 1 for inserts). The benchmark loads 20M rows without secondary indexes, creates secondary indexes, loads another 20M rows then does 3 read+write tests for one hour each that do queries as fast as possible with 100, 500 and then 1000 writes/second/client concurrent with the queries. The database is cached by the storage engine and the only IO is for writes. Clients and the DBMS share one server. The per-database configs are in the per-database subdirectories here.
The tested DBMS are:
- fbmy5635_rel.cay9c - MyRocks 5.6.35, the cay9c config and compiled with CMAKE_BUILD_TYPE=Release: -O3
- fbmy8028_rel_native_lto.cay9c - MyRocks 8.0.28, the cay9c config and compiled with CMAKE_BUILD_TYPE=Release: -O3 -flto -march=native -mtune=native
Contents
- Summary
- l.i0: load without secondary indexes
- l.x: create secondary indexes
- l.i1: continue load after secondary indexes created
- q100.1: range queries with 100 insert/s per client
- q500.1: range queries with 500 insert/s per client
- q1000.1: range queries with 1000 insert/s per client
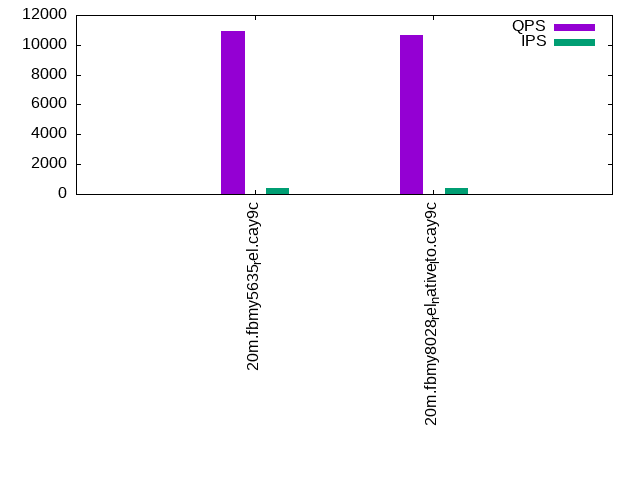
Summary
The numbers are inserts/s for l.i0 and l.i1, indexed docs (or rows) /s for l.x and queries/s for q*.2. The values are the average rate over the entire test for inserts (IPS) and queries (QPS). The range of values for IPS and QPS is split into 3 parts: bottom 25%, middle 50%, top 25%. Values in the bottom 25% have a red background, values in the top 25% have a green background and values in the middle have no color. A gray background is used for values that can be ignored because the DBMS did not sustain the target insert rate. Red backgrounds are not used when the minimum value is within 80% of the max value.
| dbms | l.i0 | l.x | l.i1 | q100.1 | q500.1 | q1000.1 |
|---|---|---|---|---|---|---|
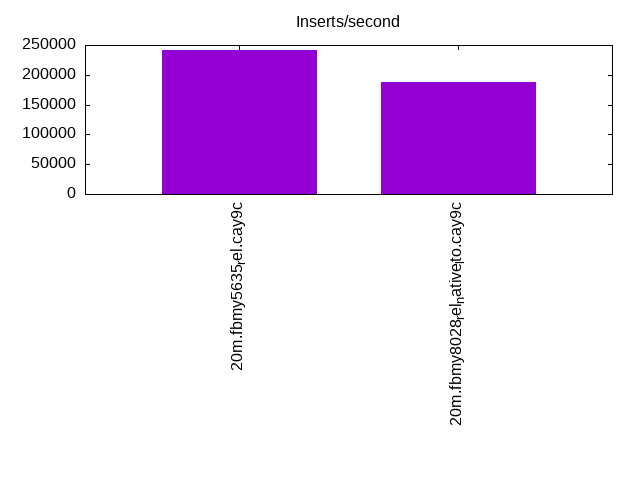
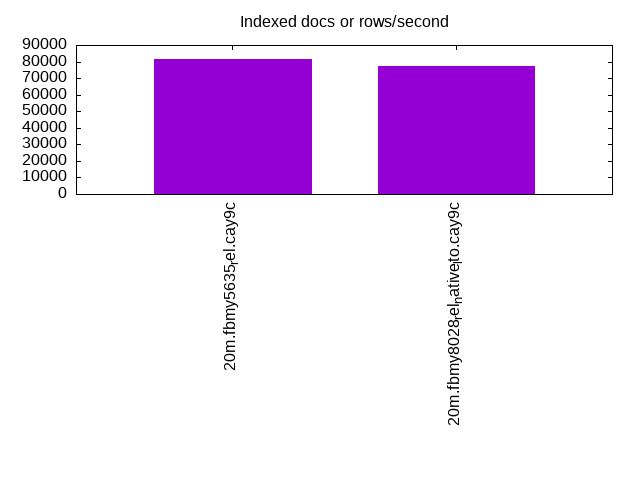
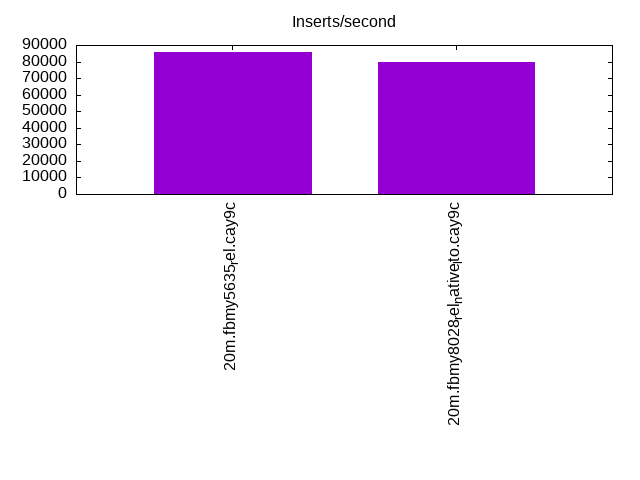
| 20m.fbmy5635_rel.cay9c | 240964 | 81707 | 85837 | 10930 | 10634 | 10739 |
| 20m.fbmy8028_rel_native_lto.cay9c | 188679 | 77606 | 80000 | 10654 | 10307 | 10240 |
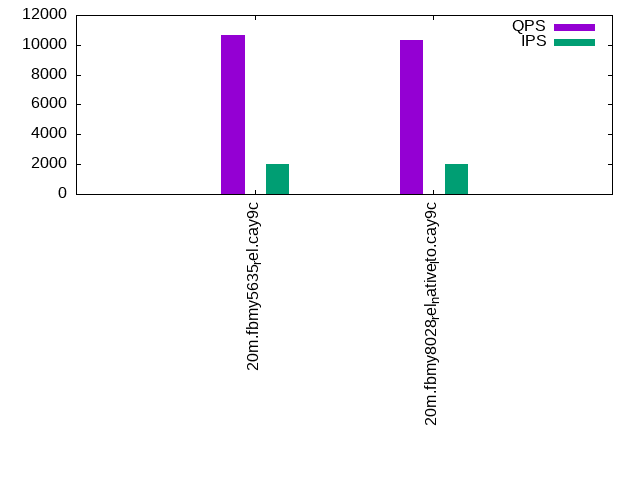
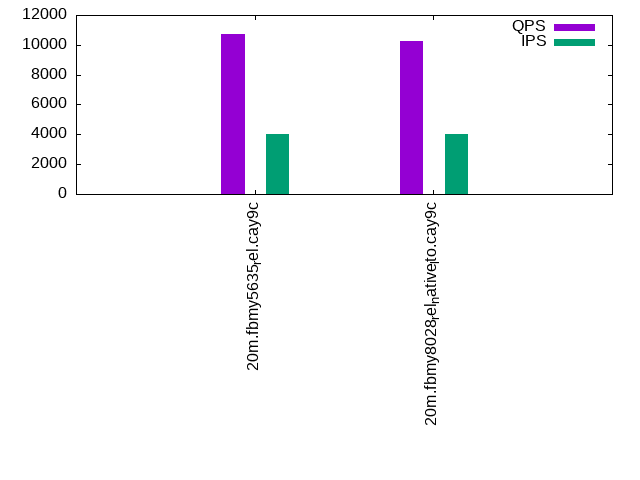
This lists the average rate of inserts/s for the tests that do inserts concurrent with queries. For such tests the query rate is listed in the table above. The read+write tests are setup so that the insert rate should match the target rate every second. Cells that are not at least 95% of the target have a red background to indicate a failure to satisfy the target.
| dbms | q100.1 | q500.1 | q1000.1 |
|---|---|---|---|
| fbmy5635_rel.cay9c | 399 | 1994 | 3989 |
| fbmy8028_rel_native_lto.cay9c | 399 | 1994 | 3989 |
| target | 400 | 2000 | 4000 |
l.i0
l.i0: load without secondary indexes. Graphs for performance per 1-second interval are here.
Average throughput:
Insert response time histogram: each cell has the percentage of responses that take <= the time in the header and max is the max response time in seconds. For the max column values in the top 25% of the range have a red background and in the bottom 25% of the range have a green background. The red background is not used when the min value is within 80% of the max value.
| dbms | 256us | 1ms | 4ms | 16ms | 64ms | 256ms | 1s | 4s | 16s | gt | max |
|---|---|---|---|---|---|---|---|---|---|---|---|
| fbmy5635_rel.cay9c | 99.761 | 0.224 | 0.002 | 0.013 | 0.106 | ||||||
| fbmy8028_rel_native_lto.cay9c | 99.369 | 0.450 | 0.168 | 0.013 | 0.119 |
Performance metrics for the DBMS listed above. Some are normalized by throughput, others are not. Legend for results is here.
ips	qps	rps	rmbps	wps	wmbps	rpq	rkbpq	wpi	wkbpi	csps	cpups	cspq	cpupq	dbgb1	dbgb2	rss	maxop	p50	p99	tag
240964	0	0	0.0	121.9	51.3	0.000	0.000	0.001	0.218	22570	73.2	0.094	24	0.7	1.8	0.3	0.106	70823	41355	20m.fbmy5635_rel.cay9c
188679	0	0	0.0	102.8	39.1	0.000	0.000	0.001	0.212	18364	68.2	0.097	29	0.7	2.0	0.7	0.119	53542	4595	20m.fbmy8028_rel_native_lto.cay9c
l.x
l.x: create secondary indexes.
Average throughput:
Performance metrics for the DBMS listed above. Some are normalized by throughput, others are not. Legend for results is here.
ips	qps	rps	rmbps	wps	wmbps	rpq	rkbpq	wpi	wkbpi	csps	cpups	cspq	cpupq	dbgb1	dbgb2	rss	maxop	p50	p99	tag
81707	0	0	0.0	32.2	12.6	0.000	0.000	0.000	0.158	228	12.7	0.003	12	1.4	2.4	1.3	0.007	NA	NA	20m.fbmy5635_rel.cay9c
77606	0	0	0.0	29.9	11.7	0.000	0.000	0.000	0.154	367	12.8	0.005	13	1.4	2.6	1.9	0.008	NA	NA	20m.fbmy8028_rel_native_lto.cay9c
l.i1
l.i1: continue load after secondary indexes created. Graphs for performance per 1-second interval are here.
Average throughput:
Insert response time histogram: each cell has the percentage of responses that take <= the time in the header and max is the max response time in seconds. For the max column values in the top 25% of the range have a red background and in the bottom 25% of the range have a green background. The red background is not used when the min value is within 80% of the max value.
| dbms | 256us | 1ms | 4ms | 16ms | 64ms | 256ms | 1s | 4s | 16s | gt | max |
|---|---|---|---|---|---|---|---|---|---|---|---|
| fbmy5635_rel.cay9c | 99.626 | 0.363 | 0.006 | 0.005 | 0.110 | ||||||
| fbmy8028_rel_native_lto.cay9c | 99.085 | 0.798 | 0.111 | 0.006 | 0.135 |
Performance metrics for the DBMS listed above. Some are normalized by throughput, others are not. Legend for results is here.
ips	qps	rps	rmbps	wps	wmbps	rpq	rkbpq	wpi	wkbpi	csps	cpups	cspq	cpupq	dbgb1	dbgb2	rss	maxop	p50	p99	tag
85837	0	3	0.4	155.6	64.5	0.000	0.005	0.002	0.770	19872	69.1	0.232	64	5.2	6.9	1.9	0.110	21826	15383	20m.fbmy5635_rel.cay9c
80000	0	12	1.6	150.7	60.4	0.000	0.020	0.002	0.773	17882	70.8	0.224	71	3.5	5.4	2.6	0.135	20427	14840	20m.fbmy8028_rel_native_lto.cay9c
q100.1
q100.1: range queries with 100 insert/s per client. Graphs for performance per 1-second interval are here.
Average throughput:
Query response time histogram: each cell has the percentage of responses that take <= the time in the header and max is the max response time in seconds. For max values in the top 25% of the range have a red background and in the bottom 25% of the range have a green background. The red background is not used when the min value is within 80% of the max value.
| dbms | 256us | 1ms | 4ms | 16ms | 64ms | 256ms | 1s | 4s | 16s | gt | max |
|---|---|---|---|---|---|---|---|---|---|---|---|
| fbmy5635_rel.cay9c | 12.678 | 87.313 | 0.008 | 0.001 | nonzero | 0.041 | |||||
| fbmy8028_rel_native_lto.cay9c | 11.576 | 88.409 | 0.015 | nonzero | 0.009 |
Insert response time histogram: each cell has the percentage of responses that take <= the time in the header and max is the max response time in seconds. For max values in the top 25% of the range have a red background and in the bottom 25% of the range have a green background. The red background is not used when the min value is within 80% of the max value.
| dbms | 256us | 1ms | 4ms | 16ms | 64ms | 256ms | 1s | 4s | 16s | gt | max |
|---|---|---|---|---|---|---|---|---|---|---|---|
| fbmy5635_rel.cay9c | 99.764 | 0.236 | 0.008 | ||||||||
| fbmy8028_rel_native_lto.cay9c | 99.535 | 0.424 | 0.042 | 0.022 |
Performance metrics for the DBMS listed above. Some are normalized by throughput, others are not. Legend for results is here.
ips	qps	rps	rmbps	wps	wmbps	rpq	rkbpq	wpi	wkbpi	csps	cpups	cspq	cpupq	dbgb1	dbgb2	rss	maxop	p50	p99	tag
399	10930	33	0.3	7.2	1.8	0.003	0.033	0.018	4.736	41130	50.7	3.763	371	2.8	4.6	5.9	0.041	2749	2333	20m.fbmy5635_rel.cay9c
399	10654	8	0.2	6.5	1.5	0.001	0.018	0.016	3.812	40398	51.1	3.792	384	2.8	4.9	5.8	0.009	2653	2142	20m.fbmy8028_rel_native_lto.cay9c
q500.1
q500.1: range queries with 500 insert/s per client. Graphs for performance per 1-second interval are here.
Average throughput:
Query response time histogram: each cell has the percentage of responses that take <= the time in the header and max is the max response time in seconds. For max values in the top 25% of the range have a red background and in the bottom 25% of the range have a green background. The red background is not used when the min value is within 80% of the max value.
| dbms | 256us | 1ms | 4ms | 16ms | 64ms | 256ms | 1s | 4s | 16s | gt | max |
|---|---|---|---|---|---|---|---|---|---|---|---|
| fbmy5635_rel.cay9c | 10.086 | 89.865 | 0.046 | 0.002 | nonzero | 0.037 | |||||
| fbmy8028_rel_native_lto.cay9c | 6.084 | 93.834 | 0.078 | 0.005 | nonzero | 0.016 |
Insert response time histogram: each cell has the percentage of responses that take <= the time in the header and max is the max response time in seconds. For max values in the top 25% of the range have a red background and in the bottom 25% of the range have a green background. The red background is not used when the min value is within 80% of the max value.
| dbms | 256us | 1ms | 4ms | 16ms | 64ms | 256ms | 1s | 4s | 16s | gt | max |
|---|---|---|---|---|---|---|---|---|---|---|---|
| fbmy5635_rel.cay9c | 95.989 | 3.986 | 0.025 | 0.048 | |||||||
| fbmy8028_rel_native_lto.cay9c | 95.583 | 4.318 | 0.099 | 0.063 |
Performance metrics for the DBMS listed above. Some are normalized by throughput, others are not. Legend for results is here.
ips	qps	rps	rmbps	wps	wmbps	rpq	rkbpq	wpi	wkbpi	csps	cpups	cspq	cpupq	dbgb1	dbgb2	rss	maxop	p50	p99	tag
1994	10634	0	0.0	6.6	1.7	0.000	0.000	0.003	0.859	39995	51.1	3.761	384	3.2	3.5	7.7	0.037	2637	2350	20m.fbmy5635_rel.cay9c
1994	10307	0	0.0	6.9	1.7	0.000	0.000	0.003	0.864	39095	51.5	3.793	400	3.2	3.6	7.6	0.016	2590	2126	20m.fbmy8028_rel_native_lto.cay9c
q1000.1
q1000.1: range queries with 1000 insert/s per client. Graphs for performance per 1-second interval are here.
Average throughput:
Query response time histogram: each cell has the percentage of responses that take <= the time in the header and max is the max response time in seconds. For max values in the top 25% of the range have a red background and in the bottom 25% of the range have a green background. The red background is not used when the min value is within 80% of the max value.
| dbms | 256us | 1ms | 4ms | 16ms | 64ms | 256ms | 1s | 4s | 16s | gt | max |
|---|---|---|---|---|---|---|---|---|---|---|---|
| fbmy5635_rel.cay9c | 8.616 | 91.266 | 0.112 | 0.006 | nonzero | 0.020 | |||||
| fbmy8028_rel_native_lto.cay9c | 4.209 | 95.621 | 0.160 | 0.009 | nonzero | 0.029 |
Insert response time histogram: each cell has the percentage of responses that take <= the time in the header and max is the max response time in seconds. For max values in the top 25% of the range have a red background and in the bottom 25% of the range have a green background. The red background is not used when the min value is within 80% of the max value.
| dbms | 256us | 1ms | 4ms | 16ms | 64ms | 256ms | 1s | 4s | 16s | gt | max |
|---|---|---|---|---|---|---|---|---|---|---|---|
| fbmy5635_rel.cay9c | 90.794 | 9.166 | 0.037 | 0.002 | 0.069 | ||||||
| fbmy8028_rel_native_lto.cay9c | 96.306 | 3.590 | 0.103 | 0.001 | 0.068 |
Performance metrics for the DBMS listed above. Some are normalized by throughput, others are not. Legend for results is here.
ips	qps	rps	rmbps	wps	wmbps	rpq	rkbpq	wpi	wkbpi	csps	cpups	cspq	cpupq	dbgb1	dbgb2	rss	maxop	p50	p99	tag
3989	10739	10	0.3	15.6	4.9	0.001	0.030	0.004	1.262	39532	53.3	3.681	397	3.7	4.9	10.6	0.020	2669	2317	20m.fbmy5635_rel.cay9c
3989	10240	7	0.5	15.1	4.6	0.001	0.046	0.004	1.192	38425	53.6	3.753	419	3.7	5.1	11.0	0.029	2557	2110	20m.fbmy8028_rel_native_lto.cay9c
l.i0
l.i0: load without secondary indexes
Performance metrics for all DBMS, not just the ones listed above. Some are normalized by throughput, others are not. Legend for results is here.
ips	qps	rps	rmbps	wps	wmbps	rpq	rkbpq	wpi	wkbpi	csps	cpups	cspq	cpupq	dbgb1	dbgb2	rss	maxop	p50	p99	tag
240964	0	0	0.0	121.9	51.3	0.000	0.000	0.001	0.218	22570	73.2	0.094	24	0.7	1.8	0.3	0.106	70823	41355	20m.fbmy5635_rel.cay9c
188679	0	0	0.0	102.8	39.1	0.000	0.000	0.001	0.212	18364	68.2	0.097	29	0.7	2.0	0.7	0.119	53542	4595	20m.fbmy8028_rel_native_lto.cay9c
l.x
l.x: create secondary indexes
Performance metrics for all DBMS, not just the ones listed above. Some are normalized by throughput, others are not. Legend for results is here.
ips	qps	rps	rmbps	wps	wmbps	rpq	rkbpq	wpi	wkbpi	csps	cpups	cspq	cpupq	dbgb1	dbgb2	rss	maxop	p50	p99	tag
81707	0	0	0.0	32.2	12.6	0.000	0.000	0.000	0.158	228	12.7	0.003	12	1.4	2.4	1.3	0.007	NA	NA	20m.fbmy5635_rel.cay9c
77606	0	0	0.0	29.9	11.7	0.000	0.000	0.000	0.154	367	12.8	0.005	13	1.4	2.6	1.9	0.008	NA	NA	20m.fbmy8028_rel_native_lto.cay9c
l.i1
l.i1: continue load after secondary indexes created
Performance metrics for all DBMS, not just the ones listed above. Some are normalized by throughput, others are not. Legend for results is here.
ips	qps	rps	rmbps	wps	wmbps	rpq	rkbpq	wpi	wkbpi	csps	cpups	cspq	cpupq	dbgb1	dbgb2	rss	maxop	p50	p99	tag
85837	0	3	0.4	155.6	64.5	0.000	0.005	0.002	0.770	19872	69.1	0.232	64	5.2	6.9	1.9	0.110	21826	15383	20m.fbmy5635_rel.cay9c
80000	0	12	1.6	150.7	60.4	0.000	0.020	0.002	0.773	17882	70.8	0.224	71	3.5	5.4	2.6	0.135	20427	14840	20m.fbmy8028_rel_native_lto.cay9c
q100.1
q100.1: range queries with 100 insert/s per client
Performance metrics for all DBMS, not just the ones listed above. Some are normalized by throughput, others are not. Legend for results is here.
ips	qps	rps	rmbps	wps	wmbps	rpq	rkbpq	wpi	wkbpi	csps	cpups	cspq	cpupq	dbgb1	dbgb2	rss	maxop	p50	p99	tag
399	10930	33	0.3	7.2	1.8	0.003	0.033	0.018	4.736	41130	50.7	3.763	371	2.8	4.6	5.9	0.041	2749	2333	20m.fbmy5635_rel.cay9c
399	10654	8	0.2	6.5	1.5	0.001	0.018	0.016	3.812	40398	51.1	3.792	384	2.8	4.9	5.8	0.009	2653	2142	20m.fbmy8028_rel_native_lto.cay9c
q500.1
q500.1: range queries with 500 insert/s per client
Performance metrics for all DBMS, not just the ones listed above. Some are normalized by throughput, others are not. Legend for results is here.
ips	qps	rps	rmbps	wps	wmbps	rpq	rkbpq	wpi	wkbpi	csps	cpups	cspq	cpupq	dbgb1	dbgb2	rss	maxop	p50	p99	tag
1994	10634	0	0.0	6.6	1.7	0.000	0.000	0.003	0.859	39995	51.1	3.761	384	3.2	3.5	7.7	0.037	2637	2350	20m.fbmy5635_rel.cay9c
1994	10307	0	0.0	6.9	1.7	0.000	0.000	0.003	0.864	39095	51.5	3.793	400	3.2	3.6	7.6	0.016	2590	2126	20m.fbmy8028_rel_native_lto.cay9c
q1000.1
q1000.1: range queries with 1000 insert/s per client
Performance metrics for all DBMS, not just the ones listed above. Some are normalized by throughput, others are not. Legend for results is here.
ips	qps	rps	rmbps	wps	wmbps	rpq	rkbpq	wpi	wkbpi	csps	cpups	cspq	cpupq	dbgb1	dbgb2	rss	maxop	p50	p99	tag
3989	10739	10	0.3	15.6	4.9	0.001	0.030	0.004	1.262	39532	53.3	3.681	397	3.7	4.9	10.6	0.020	2669	2317	20m.fbmy5635_rel.cay9c
3989	10240	7	0.5	15.1	4.6	0.001	0.046	0.004	1.192	38425	53.6	3.753	419	3.7	5.1	11.0	0.029	2557	2110	20m.fbmy8028_rel_native_lto.cay9c
l.i0
- l.i0: load without secondary indexes
- Legend for results is here.
- Each entry lists the percentage of responses that fit in that bucket (slower than max time for previous bucket, faster than min time for next bucket).
Insert response time histogram
256us	1ms	4ms	16ms	64ms	256ms	1s	4s	16s	gt	max	tag
0.000	0.000	99.761	0.224	0.002	0.013	0.000	0.000	0.000	0.000	0.106	fbmy5635_rel.cay9c
0.000	0.000	99.369	0.450	0.168	0.013	0.000	0.000	0.000	0.000	0.119	fbmy8028_rel_native_lto.cay9c
l.x
- l.x: create secondary indexes
- Legend for results is here.
- Each entry lists the percentage of responses that fit in that bucket (slower than max time for previous bucket, faster than min time for next bucket).
TODO - determine whether there is data for create index response time
l.i1
- l.i1: continue load after secondary indexes created
- Legend for results is here.
- Each entry lists the percentage of responses that fit in that bucket (slower than max time for previous bucket, faster than min time for next bucket).
Insert response time histogram
256us	1ms	4ms	16ms	64ms	256ms	1s	4s	16s	gt	max	tag
0.000	0.000	99.626	0.363	0.006	0.005	0.000	0.000	0.000	0.000	0.110	fbmy5635_rel.cay9c
0.000	0.000	99.085	0.798	0.111	0.006	0.000	0.000	0.000	0.000	0.135	fbmy8028_rel_native_lto.cay9c
q100.1
- q100.1: range queries with 100 insert/s per client
- Legend for results is here.
- Each entry lists the percentage of responses that fit in that bucket (slower than max time for previous bucket, faster than min time for next bucket).
Query response time histogram
256us	1ms	4ms	16ms	64ms	256ms	1s	4s	16s	gt	max	tag
12.678	87.313	0.008	0.001	nonzero	0.000	0.000	0.000	0.000	0.000	0.041	fbmy5635_rel.cay9c
11.576	88.409	0.015	nonzero	0.000	0.000	0.000	0.000	0.000	0.000	0.009	fbmy8028_rel_native_lto.cay9c
Insert response time histogram
256us	1ms	4ms	16ms	64ms	256ms	1s	4s	16s	gt	max	tag
0.000	0.000	99.764	0.236	0.000	0.000	0.000	0.000	0.000	0.000	0.008	fbmy5635_rel.cay9c
0.000	0.000	99.535	0.424	0.042	0.000	0.000	0.000	0.000	0.000	0.022	fbmy8028_rel_native_lto.cay9c
q500.1
- q500.1: range queries with 500 insert/s per client
- Legend for results is here.
- Each entry lists the percentage of responses that fit in that bucket (slower than max time for previous bucket, faster than min time for next bucket).
Query response time histogram
256us	1ms	4ms	16ms	64ms	256ms	1s	4s	16s	gt	max	tag
10.086	89.865	0.046	0.002	nonzero	0.000	0.000	0.000	0.000	0.000	0.037	fbmy5635_rel.cay9c
6.084	93.834	0.078	0.005	nonzero	0.000	0.000	0.000	0.000	0.000	0.016	fbmy8028_rel_native_lto.cay9c
Insert response time histogram
256us	1ms	4ms	16ms	64ms	256ms	1s	4s	16s	gt	max	tag
0.000	0.000	95.989	3.986	0.025	0.000	0.000	0.000	0.000	0.000	0.048	fbmy5635_rel.cay9c
0.000	0.000	95.583	4.318	0.099	0.000	0.000	0.000	0.000	0.000	0.063	fbmy8028_rel_native_lto.cay9c
q1000.1
- q1000.1: range queries with 1000 insert/s per client
- Legend for results is here.
- Each entry lists the percentage of responses that fit in that bucket (slower than max time for previous bucket, faster than min time for next bucket).
Query response time histogram
256us	1ms	4ms	16ms	64ms	256ms	1s	4s	16s	gt	max	tag
8.616	91.266	0.112	0.006	nonzero	0.000	0.000	0.000	0.000	0.000	0.020	fbmy5635_rel.cay9c
4.209	95.621	0.160	0.009	nonzero	0.000	0.000	0.000	0.000	0.000	0.029	fbmy8028_rel_native_lto.cay9c
Insert response time histogram
256us	1ms	4ms	16ms	64ms	256ms	1s	4s	16s	gt	max	tag
0.000	0.000	90.794	9.166	0.037	0.002	0.000	0.000	0.000	0.000	0.069	fbmy5635_rel.cay9c
0.000	0.000	96.306	3.590	0.103	0.001	0.000	0.000	0.000	0.000	0.068	fbmy8028_rel_native_lto.cay9c