Introduction
This is a report for the insert benchmark with 20M docs and 4 client(s). It is generated by scripts (bash, awk, sed) and Tufte might not be impressed. An overview of the insert benchmark is here and a short update is here. Below, by DBMS, I mean DBMS+version.config. An example is my8020.c10b40 where my means MySQL, 8020 is version 8.0.20 and c10b40 is the name for the configuration file.
The test server has 8 AMD cores, 16G RAM and an NVMe SSD. It is described here as the Beelink. The benchmark was run with 1 client and there were 1 or 2 connections per client (1 for queries, 1 for inserts). The benchmark loads 20M rows without secondary indexes, creates secondary indexes, loads another 20M rows then does 3 read+write tests for one hour each that do queries as fast as possible with 100, 500 and then 1000 writes/second/client concurrent with the queries. The database is cached by the storage engine and the only IO is for writes. Clients and the DBMS share one server. The per-database configs are in the per-database subdirectories here.
The tested DBMS are:
- fbmy5635_rel_withdbg.cay9c - MyRocks 5.6.35, the cay9c config and compiled with CMAKE_BUILD_TYPE=RelWithDebInfo and -O2
- fbmy5635_rel_o2.cay9c - MyRocks 5.6.35, the cay9c config and compiled with CMAKE_BUILD_TYPE=Release and -O2
- fbmy5635_rel.cay9c - MyRocks 5.6.35, the cay9c config and compiled with CMAKE_BUILD_TYPE=Release and -O3
Contents
- Summary
- l.i0: load without secondary indexes
- l.x: create secondary indexes
- l.i1: continue load after secondary indexes created
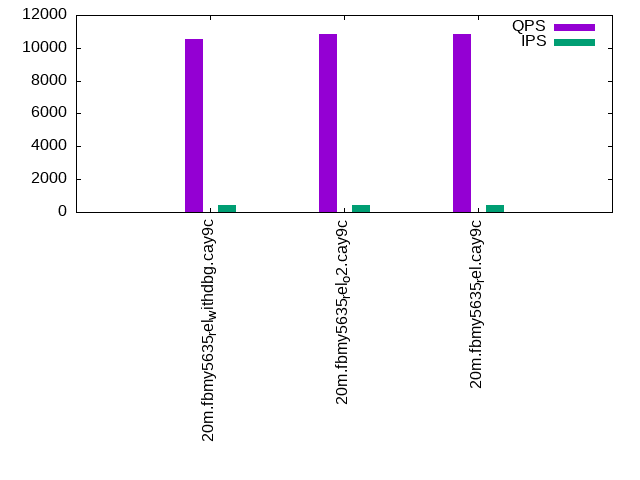
- q100.1: range queries with 100 insert/s per client
- q500.1: range queries with 500 insert/s per client
- q1000.1: range queries with 1000 insert/s per client
Summary
The numbers are inserts/s for l.i0 and l.i1, indexed docs (or rows) /s for l.x and queries/s for q*.2. The values are the average rate over the entire test for inserts (IPS) and queries (QPS). The range of values for IPS and QPS is split into 3 parts: bottom 25%, middle 50%, top 25%. Values in the bottom 25% have a red background, values in the top 25% have a green background and values in the middle have no color. A gray background is used for values that can be ignored because the DBMS did not sustain the target insert rate. Red backgrounds are not used when the minimum value is within 80% of the max value.
| dbms | l.i0 | l.x | l.i1 | q100.1 | q500.1 | q1000.1 |
|---|---|---|---|---|---|---|
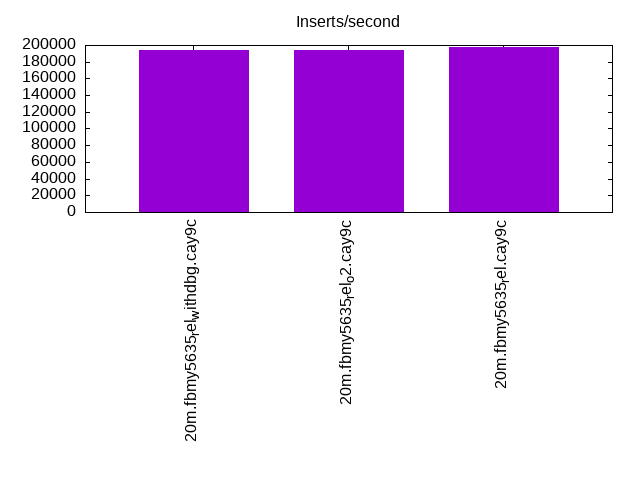
| 20m.fbmy5635_rel_withdbg.cay9c | 194175 | 300000 | 92592 | 10558 | 10626 | 10614 |
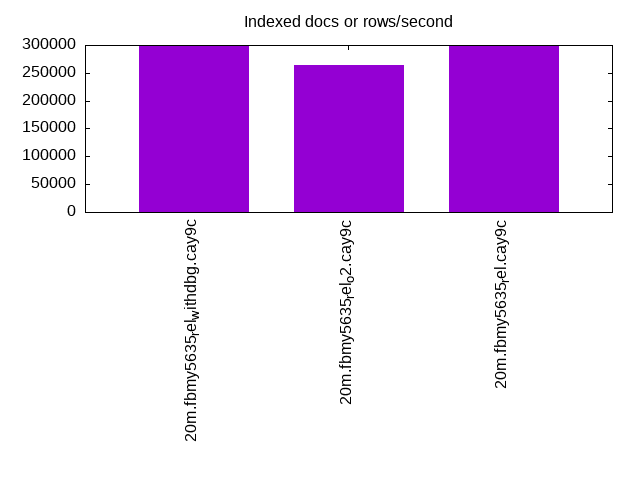
| 20m.fbmy5635_rel_o2.cay9c | 194175 | 264474 | 91324 | 10847 | 10692 | 10781 |
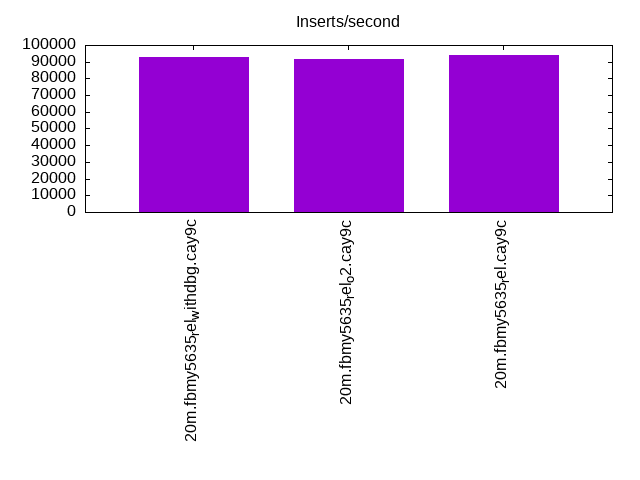
| 20m.fbmy5635_rel.cay9c | 198020 | 300000 | 93897 | 10862 | 10637 | 10712 |
This lists the average rate of inserts/s for the tests that do inserts concurrent with queries. For such tests the query rate is listed in the table above. The read+write tests are setup so that the insert rate should match the target rate every second. Cells that are not at least 95% of the target have a red background to indicate a failure to satisfy the target.
| dbms | q100.1 | q500.1 | q1000.1 |
|---|---|---|---|
| fbmy5635_rel_withdbg.cay9c | 399 | 1993 | 3989 |
| fbmy5635_rel_o2.cay9c | 399 | 1994 | 3989 |
| fbmy5635_rel.cay9c | 399 | 1994 | 3989 |
| target | 400 | 2000 | 4000 |
l.i0
l.i0: load without secondary indexes. Graphs for performance per 1-second interval are here.
Average throughput:
Insert response time histogram: each cell has the percentage of responses that take <= the time in the header and max is the max response time in seconds. For the max column values in the top 25% of the range have a red background and in the bottom 25% of the range have a green background. The red background is not used when the min value is within 80% of the max value.
| dbms | 256us | 1ms | 4ms | 16ms | 64ms | 256ms | 1s | 4s | 16s | gt | max |
|---|---|---|---|---|---|---|---|---|---|---|---|
| fbmy5635_rel_withdbg.cay9c | 99.761 | 0.224 | 0.003 | 0.013 | 0.100 | ||||||
| fbmy5635_rel_o2.cay9c | 99.769 | 0.215 | 0.003 | 0.013 | 0.099 | ||||||
| fbmy5635_rel.cay9c | 99.755 | 0.229 | 0.003 | 0.013 | 0.102 |
Performance metrics for the DBMS listed above. Some are normalized by throughput, others are not. Legend for results is here.
ips	qps	rps	rmbps	wps	wmbps	rpq	rkbpq	wpi	wkbpi	csps	cpups	cspq	cpupq	dbgb1	dbgb2	rss	maxop	p50	p99	tag
194175	0	0	0.0	123.9	52.6	0.000	0.000	0.001	0.277	20068	73.4	0.103	30	0.7	1.7	0.4	0.100	54159	33264	20m.fbmy5635_rel_withdbg.cay9c
194175	0	0	0.0	121.1	51.2	0.000	0.000	0.001	0.270	19959	73.0	0.103	30	0.8	1.9	0.4	0.099	53742	46050	20m.fbmy5635_rel_o2.cay9c
198020	0	0	0.0	121.1	51.6	0.000	0.000	0.001	0.267	19918	72.6	0.101	29	0.9	1.9	0.4	0.102	55359	34462	20m.fbmy5635_rel.cay9c
l.x
l.x: create secondary indexes.
Average throughput:
Performance metrics for the DBMS listed above. Some are normalized by throughput, others are not. Legend for results is here.
ips	qps	rps	rmbps	wps	wmbps	rpq	rkbpq	wpi	wkbpi	csps	cpups	cspq	cpupq	dbgb1	dbgb2	rss	maxop	p50	p99	tag
300000	0	1	0.0	120.3	50.1	0.000	0.000	0.000	0.171	502	47.2	0.002	13	1.4	2.5	1.6	0.003	NA	NA	20m.fbmy5635_rel_withdbg.cay9c
264474	0	1	0.0	116.2	48.9	0.000	0.000	0.000	0.189	526	48.9	0.002	15	1.4	2.4	2.1	0.013	NA	NA	20m.fbmy5635_rel_o2.cay9c
300000	0	1	0.0	134.0	56.1	0.000	0.000	0.000	0.191	834	48.4	0.003	13	1.4	2.4	2.1	0.003	NA	NA	20m.fbmy5635_rel.cay9c
l.i1
l.i1: continue load after secondary indexes created. Graphs for performance per 1-second interval are here.
Average throughput:
Insert response time histogram: each cell has the percentage of responses that take <= the time in the header and max is the max response time in seconds. For the max column values in the top 25% of the range have a red background and in the bottom 25% of the range have a green background. The red background is not used when the min value is within 80% of the max value.
| dbms | 256us | 1ms | 4ms | 16ms | 64ms | 256ms | 1s | 4s | 16s | gt | max |
|---|---|---|---|---|---|---|---|---|---|---|---|
| fbmy5635_rel_withdbg.cay9c | 99.656 | 0.332 | 0.006 | 0.007 | 0.112 | ||||||
| fbmy5635_rel_o2.cay9c | 99.635 | 0.354 | 0.004 | 0.007 | 0.103 | ||||||
| fbmy5635_rel.cay9c | 99.635 | 0.353 | 0.004 | 0.007 | 0.108 |
Performance metrics for the DBMS listed above. Some are normalized by throughput, others are not. Legend for results is here.
ips	qps	rps	rmbps	wps	wmbps	rpq	rkbpq	wpi	wkbpi	csps	cpups	cspq	cpupq	dbgb1	dbgb2	rss	maxop	p50	p99	tag
92592	0	8	1.0	173.2	70.7	0.000	0.011	0.002	0.782	20219	74.7	0.218	65	4.2	5.9	1.9	0.112	23924	17131	20m.fbmy5635_rel_withdbg.cay9c
91324	0	13	1.6	168.1	69.1	0.000	0.017	0.002	0.774	20019	74.9	0.219	66	5.2	7.0	2.3	0.103	23633	17082	20m.fbmy5635_rel_o2.cay9c
93897	0	10	1.2	169.6	69.4	0.000	0.013	0.002	0.756	20530	74.4	0.219	63	4.7	6.5	2.3	0.108	24039	16688	20m.fbmy5635_rel.cay9c
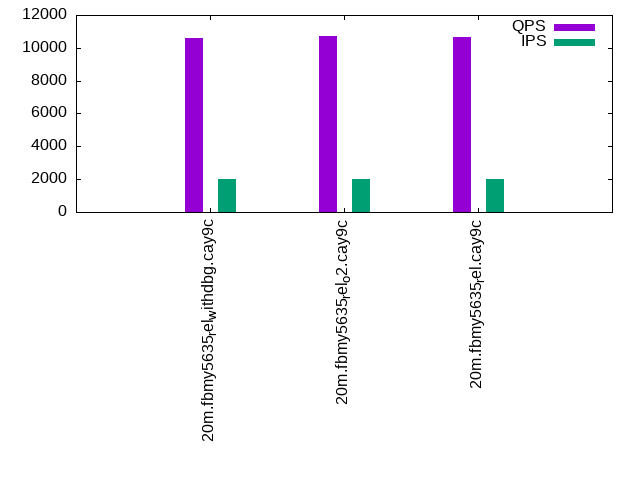
q100.1
q100.1: range queries with 100 insert/s per client. Graphs for performance per 1-second interval are here.
Average throughput:
Query response time histogram: each cell has the percentage of responses that take <= the time in the header and max is the max response time in seconds. For max values in the top 25% of the range have a red background and in the bottom 25% of the range have a green background. The red background is not used when the min value is within 80% of the max value.
| dbms | 256us | 1ms | 4ms | 16ms | 64ms | 256ms | 1s | 4s | 16s | gt | max |
|---|---|---|---|---|---|---|---|---|---|---|---|
| fbmy5635_rel_withdbg.cay9c | 10.294 | 89.696 | 0.009 | 0.001 | 0.009 | ||||||
| fbmy5635_rel_o2.cay9c | 12.267 | 87.727 | 0.006 | nonzero | 0.013 | ||||||
| fbmy5635_rel.cay9c | 12.373 | 87.619 | 0.008 | 0.001 | 0.009 |
Insert response time histogram: each cell has the percentage of responses that take <= the time in the header and max is the max response time in seconds. For max values in the top 25% of the range have a red background and in the bottom 25% of the range have a green background. The red background is not used when the min value is within 80% of the max value.
| dbms | 256us | 1ms | 4ms | 16ms | 64ms | 256ms | 1s | 4s | 16s | gt | max |
|---|---|---|---|---|---|---|---|---|---|---|---|
| fbmy5635_rel_withdbg.cay9c | 99.681 | 0.319 | 0.010 | ||||||||
| fbmy5635_rel_o2.cay9c | 99.431 | 0.569 | 0.014 | ||||||||
| fbmy5635_rel.cay9c | 99.771 | 0.229 | 0.014 |
Performance metrics for the DBMS listed above. Some are normalized by throughput, others are not. Legend for results is here.
ips	qps	rps	rmbps	wps	wmbps	rpq	rkbpq	wpi	wkbpi	csps	cpups	cspq	cpupq	dbgb1	dbgb2	rss	maxop	p50	p99	tag
399	10558	32	0.3	7.0	1.8	0.003	0.028	0.018	4.580	39855	50.5	3.775	383	2.9	4.7	6.2	0.009	2605	2222	20m.fbmy5635_rel_withdbg.cay9c
399	10847	18	0.2	7.1	1.8	0.002	0.022	0.018	4.629	40744	50.6	3.756	373	2.9	4.7	5.9	0.013	2670	2381	20m.fbmy5635_rel_o2.cay9c
399	10862	23	0.3	7.7	2.1	0.002	0.025	0.019	5.313	40805	50.6	3.757	373	2.9	4.7	6.7	0.009	2701	2397	20m.fbmy5635_rel.cay9c
q500.1
q500.1: range queries with 500 insert/s per client. Graphs for performance per 1-second interval are here.
Average throughput:
Query response time histogram: each cell has the percentage of responses that take <= the time in the header and max is the max response time in seconds. For max values in the top 25% of the range have a red background and in the bottom 25% of the range have a green background. The red background is not used when the min value is within 80% of the max value.
| dbms | 256us | 1ms | 4ms | 16ms | 64ms | 256ms | 1s | 4s | 16s | gt | max |
|---|---|---|---|---|---|---|---|---|---|---|---|
| fbmy5635_rel_withdbg.cay9c | 10.094 | 89.865 | 0.040 | 0.002 | nonzero | 0.025 | |||||
| fbmy5635_rel_o2.cay9c | 10.700 | 89.268 | 0.031 | 0.002 | nonzero | 0.019 | |||||
| fbmy5635_rel.cay9c | 10.160 | 89.802 | 0.036 | 0.002 | nonzero | 0.019 |
Insert response time histogram: each cell has the percentage of responses that take <= the time in the header and max is the max response time in seconds. For max values in the top 25% of the range have a red background and in the bottom 25% of the range have a green background. The red background is not used when the min value is within 80% of the max value.
| dbms | 256us | 1ms | 4ms | 16ms | 64ms | 256ms | 1s | 4s | 16s | gt | max |
|---|---|---|---|---|---|---|---|---|---|---|---|
| fbmy5635_rel_withdbg.cay9c | 98.451 | 1.524 | 0.025 | 0.049 | |||||||
| fbmy5635_rel_o2.cay9c | 97.465 | 2.519 | 0.015 | 0.045 | |||||||
| fbmy5635_rel.cay9c | 97.094 | 2.881 | 0.025 | 0.047 |
Performance metrics for the DBMS listed above. Some are normalized by throughput, others are not. Legend for results is here.
ips	qps	rps	rmbps	wps	wmbps	rpq	rkbpq	wpi	wkbpi	csps	cpups	cspq	cpupq	dbgb1	dbgb2	rss	maxop	p50	p99	tag
1993	10626	1	0.0	8.6	2.5	0.000	0.005	0.004	1.292	39809	51.3	3.746	386	3.1	3.4	8.7	0.025	2637	2349	20m.fbmy5635_rel_withdbg.cay9c
1994	10692	0	0.0	7.1	1.9	0.000	0.000	0.004	0.957	40096	51.2	3.750	383	3.2	3.5	8.2	0.019	2653	2349	20m.fbmy5635_rel_o2.cay9c
1994	10637	0	0.0	7.8	2.2	0.000	0.002	0.004	1.104	39838	51.2	3.745	385	3.1	3.4	8.9	0.019	2622	2349	20m.fbmy5635_rel.cay9c
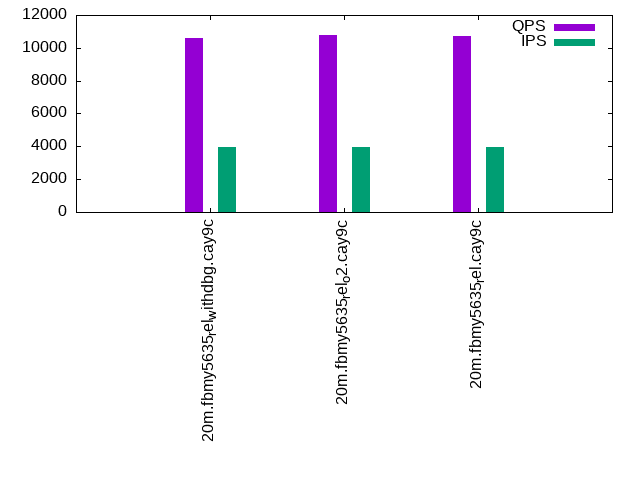
q1000.1
q1000.1: range queries with 1000 insert/s per client. Graphs for performance per 1-second interval are here.
Average throughput:
Query response time histogram: each cell has the percentage of responses that take <= the time in the header and max is the max response time in seconds. For max values in the top 25% of the range have a red background and in the bottom 25% of the range have a green background. The red background is not used when the min value is within 80% of the max value.
| dbms | 256us | 1ms | 4ms | 16ms | 64ms | 256ms | 1s | 4s | 16s | gt | max |
|---|---|---|---|---|---|---|---|---|---|---|---|
| fbmy5635_rel_withdbg.cay9c | 8.903 | 90.991 | 0.099 | 0.006 | nonzero | 0.020 | |||||
| fbmy5635_rel_o2.cay9c | 9.401 | 90.519 | 0.072 | 0.007 | nonzero | 0.020 | |||||
| fbmy5635_rel.cay9c | 9.188 | 90.704 | 0.099 | 0.009 | nonzero | 0.025 |
Insert response time histogram: each cell has the percentage of responses that take <= the time in the header and max is the max response time in seconds. For max values in the top 25% of the range have a red background and in the bottom 25% of the range have a green background. The red background is not used when the min value is within 80% of the max value.
| dbms | 256us | 1ms | 4ms | 16ms | 64ms | 256ms | 1s | 4s | 16s | gt | max |
|---|---|---|---|---|---|---|---|---|---|---|---|
| fbmy5635_rel_withdbg.cay9c | 88.706 | 11.235 | 0.059 | 0.051 | |||||||
| fbmy5635_rel_o2.cay9c | 93.047 | 6.913 | 0.040 | 0.056 | |||||||
| fbmy5635_rel.cay9c | 88.571 | 11.376 | 0.053 | 0.048 |
Performance metrics for the DBMS listed above. Some are normalized by throughput, others are not. Legend for results is here.
ips	qps	rps	rmbps	wps	wmbps	rpq	rkbpq	wpi	wkbpi	csps	cpups	cspq	cpupq	dbgb1	dbgb2	rss	maxop	p50	p99	tag
3989	10614	5	0.5	13.7	4.2	0.000	0.045	0.003	1.077	39185	52.8	3.692	398	3.7	4.9	10.5	0.020	2638	2317	20m.fbmy5635_rel_withdbg.cay9c
3989	10781	18	0.9	16.3	5.2	0.002	0.082	0.004	1.336	39281	53.5	3.644	397	3.7	4.9	10.5	0.020	2637	2254	20m.fbmy5635_rel_o2.cay9c
3989	10712	14	0.8	16.0	5.1	0.001	0.075	0.004	1.300	39242	53.2	3.664	397	3.8	5.0	10.5	0.025	2637	2301	20m.fbmy5635_rel.cay9c
l.i0
l.i0: load without secondary indexes
Performance metrics for all DBMS, not just the ones listed above. Some are normalized by throughput, others are not. Legend for results is here.
ips	qps	rps	rmbps	wps	wmbps	rpq	rkbpq	wpi	wkbpi	csps	cpups	cspq	cpupq	dbgb1	dbgb2	rss	maxop	p50	p99	tag
194175	0	0	0.0	123.9	52.6	0.000	0.000	0.001	0.277	20068	73.4	0.103	30	0.7	1.7	0.4	0.100	54159	33264	20m.fbmy5635_rel_withdbg.cay9c
194175	0	0	0.0	121.1	51.2	0.000	0.000	0.001	0.270	19959	73.0	0.103	30	0.8	1.9	0.4	0.099	53742	46050	20m.fbmy5635_rel_o2.cay9c
198020	0	0	0.0	121.1	51.6	0.000	0.000	0.001	0.267	19918	72.6	0.101	29	0.9	1.9	0.4	0.102	55359	34462	20m.fbmy5635_rel.cay9c
l.x
l.x: create secondary indexes
Performance metrics for all DBMS, not just the ones listed above. Some are normalized by throughput, others are not. Legend for results is here.
ips	qps	rps	rmbps	wps	wmbps	rpq	rkbpq	wpi	wkbpi	csps	cpups	cspq	cpupq	dbgb1	dbgb2	rss	maxop	p50	p99	tag
300000	0	1	0.0	120.3	50.1	0.000	0.000	0.000	0.171	502	47.2	0.002	13	1.4	2.5	1.6	0.003	NA	NA	20m.fbmy5635_rel_withdbg.cay9c
264474	0	1	0.0	116.2	48.9	0.000	0.000	0.000	0.189	526	48.9	0.002	15	1.4	2.4	2.1	0.013	NA	NA	20m.fbmy5635_rel_o2.cay9c
300000	0	1	0.0	134.0	56.1	0.000	0.000	0.000	0.191	834	48.4	0.003	13	1.4	2.4	2.1	0.003	NA	NA	20m.fbmy5635_rel.cay9c
l.i1
l.i1: continue load after secondary indexes created
Performance metrics for all DBMS, not just the ones listed above. Some are normalized by throughput, others are not. Legend for results is here.
ips	qps	rps	rmbps	wps	wmbps	rpq	rkbpq	wpi	wkbpi	csps	cpups	cspq	cpupq	dbgb1	dbgb2	rss	maxop	p50	p99	tag
92592	0	8	1.0	173.2	70.7	0.000	0.011	0.002	0.782	20219	74.7	0.218	65	4.2	5.9	1.9	0.112	23924	17131	20m.fbmy5635_rel_withdbg.cay9c
91324	0	13	1.6	168.1	69.1	0.000	0.017	0.002	0.774	20019	74.9	0.219	66	5.2	7.0	2.3	0.103	23633	17082	20m.fbmy5635_rel_o2.cay9c
93897	0	10	1.2	169.6	69.4	0.000	0.013	0.002	0.756	20530	74.4	0.219	63	4.7	6.5	2.3	0.108	24039	16688	20m.fbmy5635_rel.cay9c
q100.1
q100.1: range queries with 100 insert/s per client
Performance metrics for all DBMS, not just the ones listed above. Some are normalized by throughput, others are not. Legend for results is here.
ips	qps	rps	rmbps	wps	wmbps	rpq	rkbpq	wpi	wkbpi	csps	cpups	cspq	cpupq	dbgb1	dbgb2	rss	maxop	p50	p99	tag
399	10558	32	0.3	7.0	1.8	0.003	0.028	0.018	4.580	39855	50.5	3.775	383	2.9	4.7	6.2	0.009	2605	2222	20m.fbmy5635_rel_withdbg.cay9c
399	10847	18	0.2	7.1	1.8	0.002	0.022	0.018	4.629	40744	50.6	3.756	373	2.9	4.7	5.9	0.013	2670	2381	20m.fbmy5635_rel_o2.cay9c
399	10862	23	0.3	7.7	2.1	0.002	0.025	0.019	5.313	40805	50.6	3.757	373	2.9	4.7	6.7	0.009	2701	2397	20m.fbmy5635_rel.cay9c
q500.1
q500.1: range queries with 500 insert/s per client
Performance metrics for all DBMS, not just the ones listed above. Some are normalized by throughput, others are not. Legend for results is here.
ips	qps	rps	rmbps	wps	wmbps	rpq	rkbpq	wpi	wkbpi	csps	cpups	cspq	cpupq	dbgb1	dbgb2	rss	maxop	p50	p99	tag
1993	10626	1	0.0	8.6	2.5	0.000	0.005	0.004	1.292	39809	51.3	3.746	386	3.1	3.4	8.7	0.025	2637	2349	20m.fbmy5635_rel_withdbg.cay9c
1994	10692	0	0.0	7.1	1.9	0.000	0.000	0.004	0.957	40096	51.2	3.750	383	3.2	3.5	8.2	0.019	2653	2349	20m.fbmy5635_rel_o2.cay9c
1994	10637	0	0.0	7.8	2.2	0.000	0.002	0.004	1.104	39838	51.2	3.745	385	3.1	3.4	8.9	0.019	2622	2349	20m.fbmy5635_rel.cay9c
q1000.1
q1000.1: range queries with 1000 insert/s per client
Performance metrics for all DBMS, not just the ones listed above. Some are normalized by throughput, others are not. Legend for results is here.
ips	qps	rps	rmbps	wps	wmbps	rpq	rkbpq	wpi	wkbpi	csps	cpups	cspq	cpupq	dbgb1	dbgb2	rss	maxop	p50	p99	tag
3989	10614	5	0.5	13.7	4.2	0.000	0.045	0.003	1.077	39185	52.8	3.692	398	3.7	4.9	10.5	0.020	2638	2317	20m.fbmy5635_rel_withdbg.cay9c
3989	10781	18	0.9	16.3	5.2	0.002	0.082	0.004	1.336	39281	53.5	3.644	397	3.7	4.9	10.5	0.020	2637	2254	20m.fbmy5635_rel_o2.cay9c
3989	10712	14	0.8	16.0	5.1	0.001	0.075	0.004	1.300	39242	53.2	3.664	397	3.8	5.0	10.5	0.025	2637	2301	20m.fbmy5635_rel.cay9c
l.i0
- l.i0: load without secondary indexes
- Legend for results is here.
- Each entry lists the percentage of responses that fit in that bucket (slower than max time for previous bucket, faster than min time for next bucket).
Insert response time histogram
256us	1ms	4ms	16ms	64ms	256ms	1s	4s	16s	gt	max	tag
0.000	0.000	99.761	0.224	0.003	0.013	0.000	0.000	0.000	0.000	0.100	fbmy5635_rel_withdbg.cay9c
0.000	0.000	99.769	0.215	0.003	0.013	0.000	0.000	0.000	0.000	0.099	fbmy5635_rel_o2.cay9c
0.000	0.000	99.755	0.229	0.003	0.013	0.000	0.000	0.000	0.000	0.102	fbmy5635_rel.cay9c
l.x
- l.x: create secondary indexes
- Legend for results is here.
- Each entry lists the percentage of responses that fit in that bucket (slower than max time for previous bucket, faster than min time for next bucket).
TODO - determine whether there is data for create index response time
l.i1
- l.i1: continue load after secondary indexes created
- Legend for results is here.
- Each entry lists the percentage of responses that fit in that bucket (slower than max time for previous bucket, faster than min time for next bucket).
Insert response time histogram
256us	1ms	4ms	16ms	64ms	256ms	1s	4s	16s	gt	max	tag
0.000	0.000	99.656	0.332	0.006	0.007	0.000	0.000	0.000	0.000	0.112	fbmy5635_rel_withdbg.cay9c
0.000	0.000	99.635	0.354	0.004	0.007	0.000	0.000	0.000	0.000	0.103	fbmy5635_rel_o2.cay9c
0.000	0.000	99.635	0.353	0.004	0.007	0.000	0.000	0.000	0.000	0.108	fbmy5635_rel.cay9c
q100.1
- q100.1: range queries with 100 insert/s per client
- Legend for results is here.
- Each entry lists the percentage of responses that fit in that bucket (slower than max time for previous bucket, faster than min time for next bucket).
Query response time histogram
256us	1ms	4ms	16ms	64ms	256ms	1s	4s	16s	gt	max	tag
10.294	89.696	0.009	0.001	0.000	0.000	0.000	0.000	0.000	0.000	0.009	fbmy5635_rel_withdbg.cay9c
12.267	87.727	0.006	nonzero	0.000	0.000	0.000	0.000	0.000	0.000	0.013	fbmy5635_rel_o2.cay9c
12.373	87.619	0.008	0.001	0.000	0.000	0.000	0.000	0.000	0.000	0.009	fbmy5635_rel.cay9c
Insert response time histogram
256us	1ms	4ms	16ms	64ms	256ms	1s	4s	16s	gt	max	tag
0.000	0.000	99.681	0.319	0.000	0.000	0.000	0.000	0.000	0.000	0.010	fbmy5635_rel_withdbg.cay9c
0.000	0.000	99.431	0.569	0.000	0.000	0.000	0.000	0.000	0.000	0.014	fbmy5635_rel_o2.cay9c
0.000	0.000	99.771	0.229	0.000	0.000	0.000	0.000	0.000	0.000	0.014	fbmy5635_rel.cay9c
q500.1
- q500.1: range queries with 500 insert/s per client
- Legend for results is here.
- Each entry lists the percentage of responses that fit in that bucket (slower than max time for previous bucket, faster than min time for next bucket).
Query response time histogram
256us	1ms	4ms	16ms	64ms	256ms	1s	4s	16s	gt	max	tag
10.094	89.865	0.040	0.002	nonzero	0.000	0.000	0.000	0.000	0.000	0.025	fbmy5635_rel_withdbg.cay9c
10.700	89.268	0.031	0.002	nonzero	0.000	0.000	0.000	0.000	0.000	0.019	fbmy5635_rel_o2.cay9c
10.160	89.802	0.036	0.002	nonzero	0.000	0.000	0.000	0.000	0.000	0.019	fbmy5635_rel.cay9c
Insert response time histogram
256us	1ms	4ms	16ms	64ms	256ms	1s	4s	16s	gt	max	tag
0.000	0.000	98.451	1.524	0.025	0.000	0.000	0.000	0.000	0.000	0.049	fbmy5635_rel_withdbg.cay9c
0.000	0.000	97.465	2.519	0.015	0.000	0.000	0.000	0.000	0.000	0.045	fbmy5635_rel_o2.cay9c
0.000	0.000	97.094	2.881	0.025	0.000	0.000	0.000	0.000	0.000	0.047	fbmy5635_rel.cay9c
q1000.1
- q1000.1: range queries with 1000 insert/s per client
- Legend for results is here.
- Each entry lists the percentage of responses that fit in that bucket (slower than max time for previous bucket, faster than min time for next bucket).
Query response time histogram
256us	1ms	4ms	16ms	64ms	256ms	1s	4s	16s	gt	max	tag
8.903	90.991	0.099	0.006	nonzero	0.000	0.000	0.000	0.000	0.000	0.020	fbmy5635_rel_withdbg.cay9c
9.401	90.519	0.072	0.007	nonzero	0.000	0.000	0.000	0.000	0.000	0.020	fbmy5635_rel_o2.cay9c
9.188	90.704	0.099	0.009	nonzero	0.000	0.000	0.000	0.000	0.000	0.025	fbmy5635_rel.cay9c
Insert response time histogram
256us	1ms	4ms	16ms	64ms	256ms	1s	4s	16s	gt	max	tag
0.000	0.000	88.706	11.235	0.059	0.000	0.000	0.000	0.000	0.000	0.051	fbmy5635_rel_withdbg.cay9c
0.000	0.000	93.047	6.913	0.040	0.000	0.000	0.000	0.000	0.000	0.056	fbmy5635_rel_o2.cay9c
0.000	0.000	88.571	11.376	0.053	0.000	0.000	0.000	0.000	0.000	0.048	fbmy5635_rel.cay9c