Introduction
This is a report for the insert benchmark with 500M docs and 1 client(s). It is generated by scripts (bash, awk, sed) and Tufte might not be impressed. An overview of the insert benchmark is here and a short update is here. Below, by DBMS, I mean DBMS+version.config. An example is my8020.c10b40 where my means MySQL, 8020 is version 8.0.20 and c10b40 is the name for the configuration file.
The test server is an Intel NUC with 4 cores, 16G RAM and a Samsung 970 EVO. More details are here. Clients and the DBMS share one server. The per-database configs are in the per-database subdirectories here.
The tested DBMS are:
- my8032.cy9 - MySQL 8.0.32 with InnoDB and the cy9 config
- my8032.cy9a - MySQL 8.0.32 with InnoDB and the cy9a config (same as cy9 except adaptive hash index is enabled)
- my8032.cy9b - MySQL 8.0.32 with InnoDB and the cy9b config (same as cy9 except the change buffer is disabled)
Contents
- Summary
- l.i0: load without secondary indexes
- l.x: create secondary indexes
- l.i1: continue load after secondary indexes created
- q100.1: range queries with 100 insert/s per client
- q500.1: range queries with 500 insert/s per client
- q1000.1: range queries with 1000 insert/s per client
Summary
The numbers are inserts/s for l.i0 and l.i1, indexed docs (or rows) /s for l.x and queries/s for q*.2. The values are the average rate over the entire test for inserts (IPS) and queries (QPS). The range of values for IPS and QPS is split into 3 parts: bottom 25%, middle 50%, top 25%. Values in the bottom 25% have a red background, values in the top 25% have a green background and values in the middle have no color. A gray background is used for values that can be ignored because the DBMS did not sustain the target insert rate. Red backgrounds are not used when the minimum value is within 80% of the max value.
| dbms | l.i0 | l.x | l.i1 | q100.1 | q500.1 | q1000.1 |
|---|---|---|---|---|---|---|
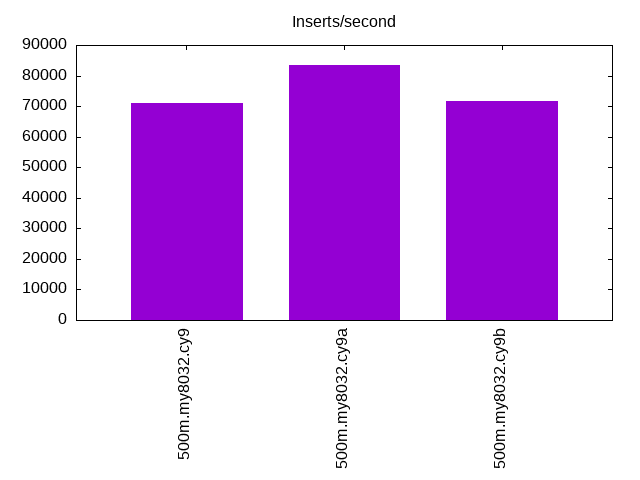
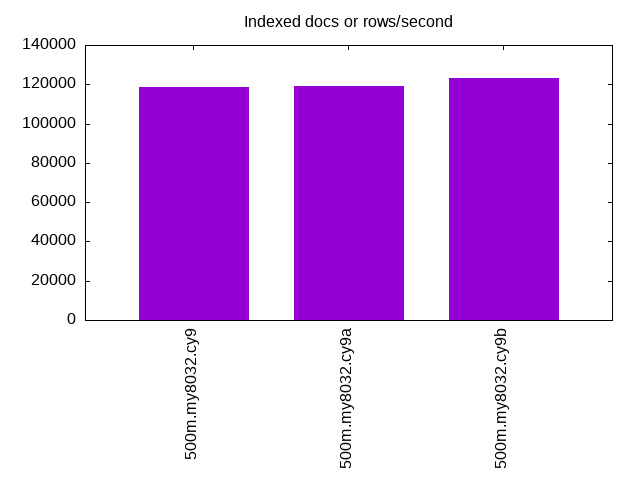
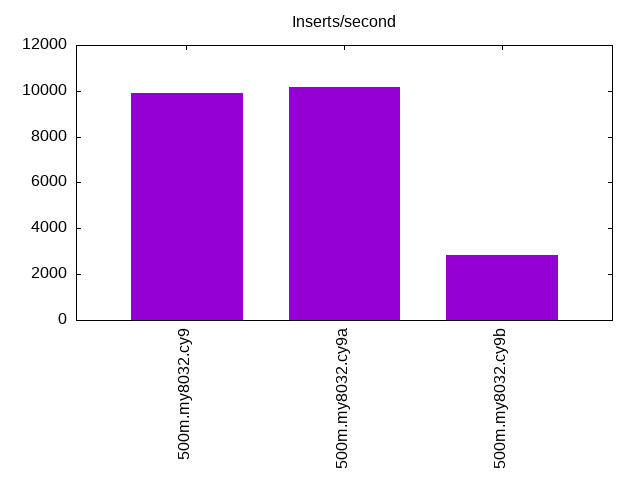
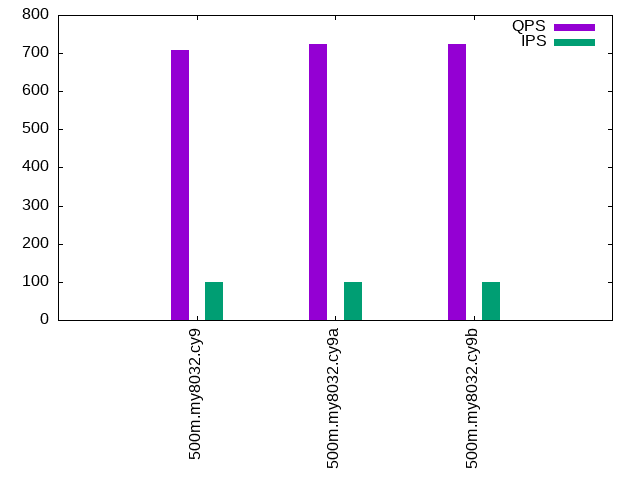
| 500m.my8032.cy9 | 71098 | 118443 | 9920 | 709 | 777 | 779 |
| 500m.my8032.cy9a | 83438 | 119290 | 10184 | 725 | 779 | 783 |
| 500m.my8032.cy9b | 71813 | 123450 | 2852 | 723 | 732 | 688 |
This lists the average rate of inserts/s for the tests that do inserts concurrent with queries. For such tests the query rate is listed in the table above. The read+write tests are setup so that the insert rate should match the target rate every second. Cells that are not at least 95% of the target have a red background to indicate a failure to satisfy the target.
| dbms | q100.1 | q500.1 | q1000.1 |
|---|---|---|---|
| my8032.cy9 | 100 | 499 | 999 |
| my8032.cy9a | 100 | 499 | 999 |
| my8032.cy9b | 100 | 499 | 999 |
| target | 100 | 500 | 1000 |
l.i0
l.i0: load without secondary indexes. Graphs for performance per 1-second interval are here.
Average throughput:
Insert response time histogram: each cell has the percentage of responses that take <= the time in the header and max is the max response time in seconds. For the max column values in the top 25% of the range have a red background and in the bottom 25% of the range have a green background. The red background is not used when the min value is within 80% of the max value.
| dbms | 256us | 1ms | 4ms | 16ms | 64ms | 256ms | 1s | 4s | 16s | gt | max |
|---|---|---|---|---|---|---|---|---|---|---|---|
| my8032.cy9 | 99.635 | 0.281 | 0.084 | nonzero | 0.084 | ||||||
| my8032.cy9a | 99.652 | 0.269 | 0.077 | 0.002 | 0.118 | ||||||
| my8032.cy9b | 99.623 | 0.280 | 0.096 | nonzero | 0.091 |
Performance metrics for the DBMS listed above. Some are normalized by throughput, others are not. Legend for results is here.
ips	qps	rps	rmbps	wps	wmbps	rpq	rkbpq	wpi	wkbpi	csps	cpups	cspq	cpupq	dbgb1	dbgb2	rss	maxop	p50	p99	tag
71098	0	0	0.0	415.9	26.6	0.000	0.000	0.006	0.383	8248	35.6	0.116	20	26.2	35.8	11.1	0.084	71022	67348	500m.my8032.cy9
83438	0	0	0.0	484.8	31.1	0.000	0.000	0.006	0.382	9696	36.9	0.116	18	26.2	35.8	11.1	0.118	83644	75558	500m.my8032.cy9a
71813	0	0	0.0	420.0	26.9	0.000	0.000	0.006	0.383	8332	34.6	0.116	19	26.2	35.8	11.1	0.091	71821	67679	500m.my8032.cy9b
l.x
l.x: create secondary indexes.
Average throughput:
Performance metrics for the DBMS listed above. Some are normalized by throughput, others are not. Legend for results is here.
ips	qps	rps	rmbps	wps	wmbps	rpq	rkbpq	wpi	wkbpi	csps	cpups	cspq	cpupq	dbgb1	dbgb2	rss	maxop	p50	p99	tag
118443	0	1869	168.8	2424.0	152.9	0.016	1.460	0.020	1.322	8842	73.2	0.075	25	58.6	68.2	10.4	0.014	NA	NA	500m.my8032.cy9
119290	0	1876	169.0	2412.9	153.6	0.016	1.450	0.020	1.319	8823	72.9	0.074	24	58.6	68.2	10.4	0.010	NA	NA	500m.my8032.cy9a
123450	0	1948	174.6	2551.9	159.3	0.016	1.448	0.021	1.322	9407	70.6	0.076	23	58.6	68.2	10.4	0.013	NA	NA	500m.my8032.cy9b
l.i1
l.i1: continue load after secondary indexes created. Graphs for performance per 1-second interval are here.
Average throughput:
Insert response time histogram: each cell has the percentage of responses that take <= the time in the header and max is the max response time in seconds. For the max column values in the top 25% of the range have a red background and in the bottom 25% of the range have a green background. The red background is not used when the min value is within 80% of the max value.
| dbms | 256us | 1ms | 4ms | 16ms | 64ms | 256ms | 1s | 4s | 16s | gt | max |
|---|---|---|---|---|---|---|---|---|---|---|---|
| my8032.cy9 | 68.510 | 28.524 | 2.831 | 0.107 | 0.028 | 0.742 | |||||
| my8032.cy9a | 71.633 | 25.556 | 2.690 | 0.091 | 0.031 | 0.815 | |||||
| my8032.cy9b | 80.943 | 16.916 | 2.107 | 0.035 | 0.826 |
Performance metrics for the DBMS listed above. Some are normalized by throughput, others are not. Legend for results is here.
ips	qps	rps	rmbps	wps	wmbps	rpq	rkbpq	wpi	wkbpi	csps	cpups	cspq	cpupq	dbgb1	dbgb2	rss	maxop	p50	p99	tag
9920	0	1331	20.8	2896.0	83.4	0.134	2.147	0.292	8.613	12070	29.4	1.217	119	91.9	105.3	10.7	0.742	10843	499	500m.my8032.cy9
10184	0	1377	21.5	2958.7	85.3	0.135	2.163	0.291	8.579	12342	29.7	1.212	117	91.9	105.3	10.7	0.815	11088	350	500m.my8032.cy9a
2852	0	4458	69.7	6046.2	153.0	1.563	25.013	2.120	54.955	27447	16.0	9.624	224	91.8	101.4	10.5	0.826	2949	749	500m.my8032.cy9b
q100.1
q100.1: range queries with 100 insert/s per client. Graphs for performance per 1-second interval are here.
Average throughput:
Query response time histogram: each cell has the percentage of responses that take <= the time in the header and max is the max response time in seconds. For max values in the top 25% of the range have a red background and in the bottom 25% of the range have a green background. The red background is not used when the min value is within 80% of the max value.
| dbms | 256us | 1ms | 4ms | 16ms | 64ms | 256ms | 1s | 4s | 16s | gt | max |
|---|---|---|---|---|---|---|---|---|---|---|---|
| my8032.cy9 | 7.105 | 39.419 | 52.053 | 1.097 | 0.317 | 0.009 | 0.142 | ||||
| my8032.cy9a | 7.010 | 39.605 | 52.071 | 1.060 | 0.243 | 0.010 | 0.141 | ||||
| my8032.cy9b | 4.556 | 41.151 | 53.699 | 0.475 | 0.117 | nonzero | 0.117 |
Insert response time histogram: each cell has the percentage of responses that take <= the time in the header and max is the max response time in seconds. For max values in the top 25% of the range have a red background and in the bottom 25% of the range have a green background. The red background is not used when the min value is within 80% of the max value.
| dbms | 256us | 1ms | 4ms | 16ms | 64ms | 256ms | 1s | 4s | 16s | gt | max |
|---|---|---|---|---|---|---|---|---|---|---|---|
| my8032.cy9 | 0.139 | 74.292 | 25.375 | 0.194 | 0.079 | ||||||
| my8032.cy9a | 0.181 | 74.611 | 24.306 | 0.903 | 0.129 | ||||||
| my8032.cy9b | 15.903 | 83.653 | 0.444 | 0.101 |
Performance metrics for the DBMS listed above. Some are normalized by throughput, others are not. Legend for results is here.
ips	qps	rps	rmbps	wps	wmbps	rpq	rkbpq	wpi	wkbpi	csps	cpups	cspq	cpupq	dbgb1	dbgb2	rss	maxop	p50	p99	tag
100	709	3591	56.1	842.3	21.3	5.063	81.011	8.440	218.820	12148	15.9	17.127	897	91.9	105.4	10.7	0.142	735	64	500m.my8032.cy9
100	725	3663	57.2	846.6	21.4	5.053	80.848	8.483	219.956	12339	16.1	17.020	888	91.9	105.4	10.7	0.141	735	64	500m.my8032.cy9a
100	723	3553	55.5	502.6	12.3	4.914	78.624	5.036	126.484	11325	15.9	15.661	880	91.9	101.5	10.5	0.117	719	160	500m.my8032.cy9b
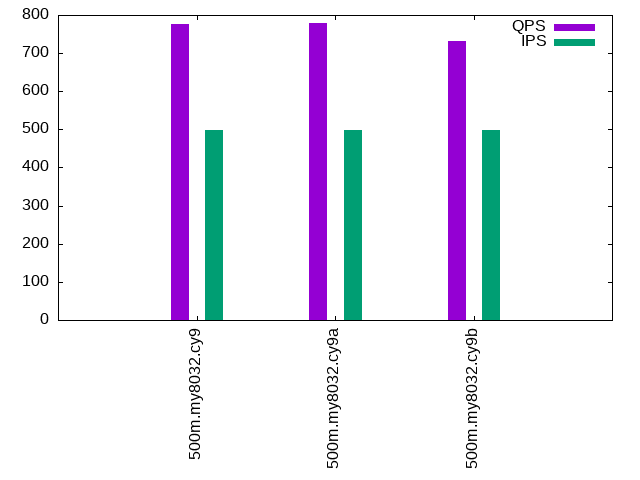
q500.1
q500.1: range queries with 500 insert/s per client. Graphs for performance per 1-second interval are here.
Average throughput:
Query response time histogram: each cell has the percentage of responses that take <= the time in the header and max is the max response time in seconds. For max values in the top 25% of the range have a red background and in the bottom 25% of the range have a green background. The red background is not used when the min value is within 80% of the max value.
| dbms | 256us | 1ms | 4ms | 16ms | 64ms | 256ms | 1s | 4s | 16s | gt | max |
|---|---|---|---|---|---|---|---|---|---|---|---|
| my8032.cy9 | 8.991 | 37.440 | 52.787 | 0.586 | 0.196 | 0.056 | |||||
| my8032.cy9a | 8.658 | 37.571 | 52.975 | 0.609 | 0.187 | 0.051 | |||||
| my8032.cy9b | 5.035 | 39.492 | 54.836 | 0.456 | 0.182 | nonzero | 0.071 |
Insert response time histogram: each cell has the percentage of responses that take <= the time in the header and max is the max response time in seconds. For max values in the top 25% of the range have a red background and in the bottom 25% of the range have a green background. The red background is not used when the min value is within 80% of the max value.
| dbms | 256us | 1ms | 4ms | 16ms | 64ms | 256ms | 1s | 4s | 16s | gt | max |
|---|---|---|---|---|---|---|---|---|---|---|---|
| my8032.cy9 | 33.833 | 64.267 | 1.900 | 0.048 | |||||||
| my8032.cy9a | 35.136 | 62.953 | 1.911 | 0.051 | |||||||
| my8032.cy9b | 31.350 | 67.211 | 1.439 | 0.097 |
Performance metrics for the DBMS listed above. Some are normalized by throughput, others are not. Legend for results is here.
ips	qps	rps	rmbps	wps	wmbps	rpq	rkbpq	wpi	wkbpi	csps	cpups	cspq	cpupq	dbgb1	dbgb2	rss	maxop	p50	p99	tag
499	777	3796	59.3	687.2	17.5	4.888	78.206	1.376	35.838	12417	16.2	15.989	834	92.1	105.6	10.7	0.056	783	64	500m.my8032.cy9
499	779	3809	59.5	688.7	17.5	4.888	78.210	1.379	35.905	12453	16.3	15.981	837	92.1	105.6	10.7	0.051	783	64	500m.my8032.cy9a
499	732	4350	68.0	1282.4	32.0	5.947	95.157	2.568	65.605	15142	17.9	20.700	979	92.1	101.7	10.5	0.071	719	512	500m.my8032.cy9b
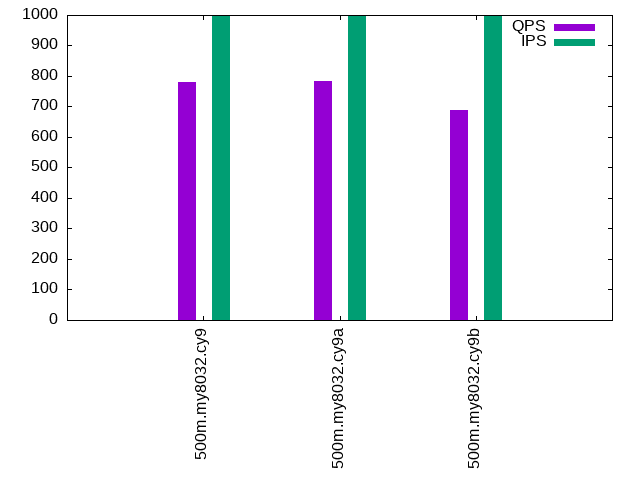
q1000.1
q1000.1: range queries with 1000 insert/s per client. Graphs for performance per 1-second interval are here.
Average throughput:
Query response time histogram: each cell has the percentage of responses that take <= the time in the header and max is the max response time in seconds. For max values in the top 25% of the range have a red background and in the bottom 25% of the range have a green background. The red background is not used when the min value is within 80% of the max value.
| dbms | 256us | 1ms | 4ms | 16ms | 64ms | 256ms | 1s | 4s | 16s | gt | max |
|---|---|---|---|---|---|---|---|---|---|---|---|
| my8032.cy9 | 10.933 | 34.415 | 53.832 | 0.651 | 0.170 | nonzero | 0.065 | ||||
| my8032.cy9a | 10.535 | 34.647 | 54.007 | 0.645 | 0.166 | 0.061 | |||||
| my8032.cy9b | 3.630 | 38.340 | 57.203 | 0.588 | 0.196 | 0.044 | 0.100 |
Insert response time histogram: each cell has the percentage of responses that take <= the time in the header and max is the max response time in seconds. For max values in the top 25% of the range have a red background and in the bottom 25% of the range have a green background. The red background is not used when the min value is within 80% of the max value.
| dbms | 256us | 1ms | 4ms | 16ms | 64ms | 256ms | 1s | 4s | 16s | gt | max |
|---|---|---|---|---|---|---|---|---|---|---|---|
| my8032.cy9 | 62.960 | 35.814 | 1.226 | 0.054 | |||||||
| my8032.cy9a | 63.636 | 35.185 | 1.178 | 0.001 | 0.065 | ||||||
| my8032.cy9b | 37.314 | 60.724 | 1.962 | 0.147 |
Performance metrics for the DBMS listed above. Some are normalized by throughput, others are not. Legend for results is here.
ips	qps	rps	rmbps	wps	wmbps	rpq	rkbpq	wpi	wkbpi	csps	cpups	cspq	cpupq	dbgb1	dbgb2	rss	maxop	p50	p99	tag
999	779	3827	59.8	1043.3	26.8	4.913	78.608	1.045	27.487	13578	17.4	17.430	893	92.6	106.0	10.7	0.065	767	575	500m.my8032.cy9
999	783	3844	60.1	1043.7	26.8	4.910	78.565	1.045	27.475	13619	17.3	17.396	884	92.6	106.0	10.7	0.061	783	575	500m.my8032.cy9a
999	688	4992	78.0	2324.0	58.3	7.257	116.112	2.327	59.769	19317	20.7	28.082	1204	92.6	102.1	10.5	0.100	687	320	500m.my8032.cy9b
l.i0
l.i0: load without secondary indexes
Performance metrics for all DBMS, not just the ones listed above. Some are normalized by throughput, others are not. Legend for results is here.
ips	qps	rps	rmbps	wps	wmbps	rpq	rkbpq	wpi	wkbpi	csps	cpups	cspq	cpupq	dbgb1	dbgb2	rss	maxop	p50	p99	tag
71098	0	0	0.0	415.9	26.6	0.000	0.000	0.006	0.383	8248	35.6	0.116	20	26.2	35.8	11.1	0.084	71022	67348	500m.my8032.cy9
83438	0	0	0.0	484.8	31.1	0.000	0.000	0.006	0.382	9696	36.9	0.116	18	26.2	35.8	11.1	0.118	83644	75558	500m.my8032.cy9a
71813	0	0	0.0	420.0	26.9	0.000	0.000	0.006	0.383	8332	34.6	0.116	19	26.2	35.8	11.1	0.091	71821	67679	500m.my8032.cy9b
l.x
l.x: create secondary indexes
Performance metrics for all DBMS, not just the ones listed above. Some are normalized by throughput, others are not. Legend for results is here.
ips	qps	rps	rmbps	wps	wmbps	rpq	rkbpq	wpi	wkbpi	csps	cpups	cspq	cpupq	dbgb1	dbgb2	rss	maxop	p50	p99	tag
118443	0	1869	168.8	2424.0	152.9	0.016	1.460	0.020	1.322	8842	73.2	0.075	25	58.6	68.2	10.4	0.014	NA	NA	500m.my8032.cy9
119290	0	1876	169.0	2412.9	153.6	0.016	1.450	0.020	1.319	8823	72.9	0.074	24	58.6	68.2	10.4	0.010	NA	NA	500m.my8032.cy9a
123450	0	1948	174.6	2551.9	159.3	0.016	1.448	0.021	1.322	9407	70.6	0.076	23	58.6	68.2	10.4	0.013	NA	NA	500m.my8032.cy9b
l.i1
l.i1: continue load after secondary indexes created
Performance metrics for all DBMS, not just the ones listed above. Some are normalized by throughput, others are not. Legend for results is here.
ips	qps	rps	rmbps	wps	wmbps	rpq	rkbpq	wpi	wkbpi	csps	cpups	cspq	cpupq	dbgb1	dbgb2	rss	maxop	p50	p99	tag
9920	0	1331	20.8	2896.0	83.4	0.134	2.147	0.292	8.613	12070	29.4	1.217	119	91.9	105.3	10.7	0.742	10843	499	500m.my8032.cy9
10184	0	1377	21.5	2958.7	85.3	0.135	2.163	0.291	8.579	12342	29.7	1.212	117	91.9	105.3	10.7	0.815	11088	350	500m.my8032.cy9a
2852	0	4458	69.7	6046.2	153.0	1.563	25.013	2.120	54.955	27447	16.0	9.624	224	91.8	101.4	10.5	0.826	2949	749	500m.my8032.cy9b
q100.1
q100.1: range queries with 100 insert/s per client
Performance metrics for all DBMS, not just the ones listed above. Some are normalized by throughput, others are not. Legend for results is here.
ips	qps	rps	rmbps	wps	wmbps	rpq	rkbpq	wpi	wkbpi	csps	cpups	cspq	cpupq	dbgb1	dbgb2	rss	maxop	p50	p99	tag
100	709	3591	56.1	842.3	21.3	5.063	81.011	8.440	218.820	12148	15.9	17.127	897	91.9	105.4	10.7	0.142	735	64	500m.my8032.cy9
100	725	3663	57.2	846.6	21.4	5.053	80.848	8.483	219.956	12339	16.1	17.020	888	91.9	105.4	10.7	0.141	735	64	500m.my8032.cy9a
100	723	3553	55.5	502.6	12.3	4.914	78.624	5.036	126.484	11325	15.9	15.661	880	91.9	101.5	10.5	0.117	719	160	500m.my8032.cy9b
q500.1
q500.1: range queries with 500 insert/s per client
Performance metrics for all DBMS, not just the ones listed above. Some are normalized by throughput, others are not. Legend for results is here.
ips	qps	rps	rmbps	wps	wmbps	rpq	rkbpq	wpi	wkbpi	csps	cpups	cspq	cpupq	dbgb1	dbgb2	rss	maxop	p50	p99	tag
499	777	3796	59.3	687.2	17.5	4.888	78.206	1.376	35.838	12417	16.2	15.989	834	92.1	105.6	10.7	0.056	783	64	500m.my8032.cy9
499	779	3809	59.5	688.7	17.5	4.888	78.210	1.379	35.905	12453	16.3	15.981	837	92.1	105.6	10.7	0.051	783	64	500m.my8032.cy9a
499	732	4350	68.0	1282.4	32.0	5.947	95.157	2.568	65.605	15142	17.9	20.700	979	92.1	101.7	10.5	0.071	719	512	500m.my8032.cy9b
q1000.1
q1000.1: range queries with 1000 insert/s per client
Performance metrics for all DBMS, not just the ones listed above. Some are normalized by throughput, others are not. Legend for results is here.
ips	qps	rps	rmbps	wps	wmbps	rpq	rkbpq	wpi	wkbpi	csps	cpups	cspq	cpupq	dbgb1	dbgb2	rss	maxop	p50	p99	tag
999	779	3827	59.8	1043.3	26.8	4.913	78.608	1.045	27.487	13578	17.4	17.430	893	92.6	106.0	10.7	0.065	767	575	500m.my8032.cy9
999	783	3844	60.1	1043.7	26.8	4.910	78.565	1.045	27.475	13619	17.3	17.396	884	92.6	106.0	10.7	0.061	783	575	500m.my8032.cy9a
999	688	4992	78.0	2324.0	58.3	7.257	116.112	2.327	59.769	19317	20.7	28.082	1204	92.6	102.1	10.5	0.100	687	320	500m.my8032.cy9b
l.i0
- l.i0: load without secondary indexes
- Legend for results is here.
- Each entry lists the percentage of responses that fit in that bucket (slower than max time for previous bucket, faster than min time for next bucket).
Insert response time histogram
256us	1ms	4ms	16ms	64ms	256ms	1s	4s	16s	gt	max	tag
0.000	0.000	99.635	0.281	0.084	nonzero	0.000	0.000	0.000	0.000	0.084	my8032.cy9
0.000	0.000	99.652	0.269	0.077	0.002	0.000	0.000	0.000	0.000	0.118	my8032.cy9a
0.000	0.000	99.623	0.280	0.096	nonzero	0.000	0.000	0.000	0.000	0.091	my8032.cy9b
l.x
- l.x: create secondary indexes
- Legend for results is here.
- Each entry lists the percentage of responses that fit in that bucket (slower than max time for previous bucket, faster than min time for next bucket).
TODO - determine whether there is data for create index response time
l.i1
- l.i1: continue load after secondary indexes created
- Legend for results is here.
- Each entry lists the percentage of responses that fit in that bucket (slower than max time for previous bucket, faster than min time for next bucket).
Insert response time histogram
256us	1ms	4ms	16ms	64ms	256ms	1s	4s	16s	gt	max	tag
0.000	0.000	68.510	28.524	2.831	0.107	0.028	0.000	0.000	0.000	0.742	my8032.cy9
0.000	0.000	71.633	25.556	2.690	0.091	0.031	0.000	0.000	0.000	0.815	my8032.cy9a
0.000	0.000	0.000	80.943	16.916	2.107	0.035	0.000	0.000	0.000	0.826	my8032.cy9b
q100.1
- q100.1: range queries with 100 insert/s per client
- Legend for results is here.
- Each entry lists the percentage of responses that fit in that bucket (slower than max time for previous bucket, faster than min time for next bucket).
Query response time histogram
256us	1ms	4ms	16ms	64ms	256ms	1s	4s	16s	gt	max	tag
7.105	39.419	52.053	1.097	0.317	0.009	0.000	0.000	0.000	0.000	0.142	my8032.cy9
7.010	39.605	52.071	1.060	0.243	0.010	0.000	0.000	0.000	0.000	0.141	my8032.cy9a
4.556	41.151	53.699	0.475	0.117	nonzero	0.000	0.000	0.000	0.000	0.117	my8032.cy9b
Insert response time histogram
256us	1ms	4ms	16ms	64ms	256ms	1s	4s	16s	gt	max	tag
0.000	0.000	0.139	74.292	25.375	0.194	0.000	0.000	0.000	0.000	0.079	my8032.cy9
0.000	0.000	0.181	74.611	24.306	0.903	0.000	0.000	0.000	0.000	0.129	my8032.cy9a
0.000	0.000	0.000	15.903	83.653	0.444	0.000	0.000	0.000	0.000	0.101	my8032.cy9b
q500.1
- q500.1: range queries with 500 insert/s per client
- Legend for results is here.
- Each entry lists the percentage of responses that fit in that bucket (slower than max time for previous bucket, faster than min time for next bucket).
Query response time histogram
256us	1ms	4ms	16ms	64ms	256ms	1s	4s	16s	gt	max	tag
8.991	37.440	52.787	0.586	0.196	0.000	0.000	0.000	0.000	0.000	0.056	my8032.cy9
8.658	37.571	52.975	0.609	0.187	0.000	0.000	0.000	0.000	0.000	0.051	my8032.cy9a
5.035	39.492	54.836	0.456	0.182	nonzero	0.000	0.000	0.000	0.000	0.071	my8032.cy9b
Insert response time histogram
256us	1ms	4ms	16ms	64ms	256ms	1s	4s	16s	gt	max	tag
0.000	0.000	33.833	64.267	1.900	0.000	0.000	0.000	0.000	0.000	0.048	my8032.cy9
0.000	0.000	35.136	62.953	1.911	0.000	0.000	0.000	0.000	0.000	0.051	my8032.cy9a
0.000	0.000	0.000	31.350	67.211	1.439	0.000	0.000	0.000	0.000	0.097	my8032.cy9b
q1000.1
- q1000.1: range queries with 1000 insert/s per client
- Legend for results is here.
- Each entry lists the percentage of responses that fit in that bucket (slower than max time for previous bucket, faster than min time for next bucket).
Query response time histogram
256us	1ms	4ms	16ms	64ms	256ms	1s	4s	16s	gt	max	tag
10.933	34.415	53.832	0.651	0.170	nonzero	0.000	0.000	0.000	0.000	0.065	my8032.cy9
10.535	34.647	54.007	0.645	0.166	0.000	0.000	0.000	0.000	0.000	0.061	my8032.cy9a
3.630	38.340	57.203	0.588	0.196	0.044	0.000	0.000	0.000	0.000	0.100	my8032.cy9b
Insert response time histogram
256us	1ms	4ms	16ms	64ms	256ms	1s	4s	16s	gt	max	tag
0.000	0.000	62.960	35.814	1.226	0.000	0.000	0.000	0.000	0.000	0.054	my8032.cy9
0.000	0.000	63.636	35.185	1.178	0.001	0.000	0.000	0.000	0.000	0.065	my8032.cy9a
0.000	0.000	0.000	37.314	60.724	1.962	0.000	0.000	0.000	0.000	0.147	my8032.cy9b