Introduction
This is a report for the insert benchmark with 50M docs and 8 client(s). It is generated by scripts (bash, awk, sed) and Tufte might not be impressed. An overview of the insert benchmark is here and a short update is here. Below, by DBMS, I mean DBMS+version.config. An example is my8020.c10b40 where my means MySQL, 8020 is version 8.0.20 and c10b40 is the name for the configuration file.
The test server is a c7g.4xl with 16 cores, 32G RAM and io2 storage (1T, 32K IOPs). The benchmark was run with 8 clients and there was 1 or 2 connections per client (1 for queries, 1 for inserts). The benchmark loads 25M rows without secondary indexes, creates secondary indexes, loads another 25M rows then does 3 read+write tests for one hour each that do queries as fast as possible with 100, 500 and then 1000 writes/second/client concurrent with the queries. The database is cached by the storage engine and the only IO is for writes. Clients and the DBMS share one server. The per-database configs are in the per-database subdirectories here.
The tested DBMS are:
- my8031.cy8_c16r32_32kio - MySQL 8.0.31 with InnoDB and the cy8_c16r32_32kio config
- fbmy8028.cy9c_c16r32_32kio - FB MySQL 8.0.28 with MyRocks and the cy9c_c16r32_32kio config
- pg151.cx7_c16r32_32kio - Postgres 15.1 and the cx7_c16r32_32kio config
Contents
- Summary
- l.i0: load without secondary indexes
- l.x: create secondary indexes
- l.i1: continue load after secondary indexes created
- q100.1: range queries with 100 insert/s per client
- q500.1: range queries with 500 insert/s per client
- q1000.1: range queries with 1000 insert/s per client
Summary
The numbers are inserts/s for l.i0 and l.i1, indexed docs (or rows) /s for l.x and queries/s for q*.2. The values are the average rate over the entire test for inserts (IPS) and queries (QPS). The range of values for IPS and QPS is split into 3 parts: bottom 25%, middle 50%, top 25%. Values in the bottom 25% have a red background, values in the top 25% have a green background and values in the middle have no color. A gray background is used for values that can be ignored because the DBMS did not sustain the target insert rate. Red backgrounds are not used when the minimum value is within 80% of the max value.
| dbms | l.i0 | l.x | l.i1 | q100.1 | q500.1 | q1000.1 |
|---|---|---|---|---|---|---|
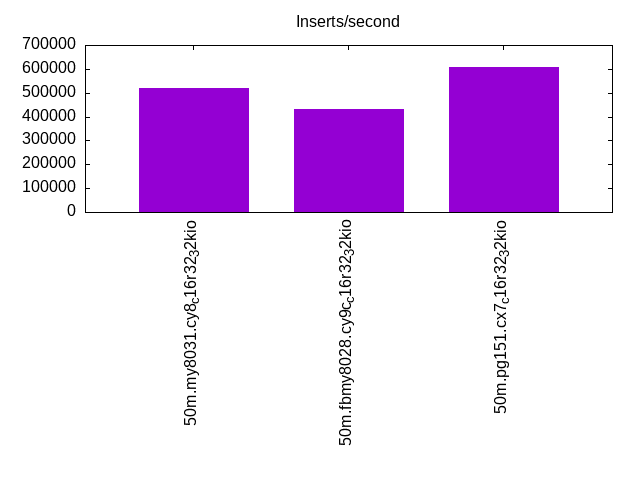
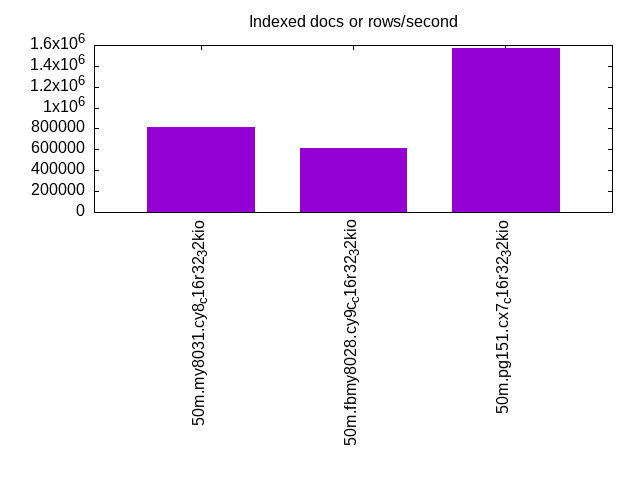
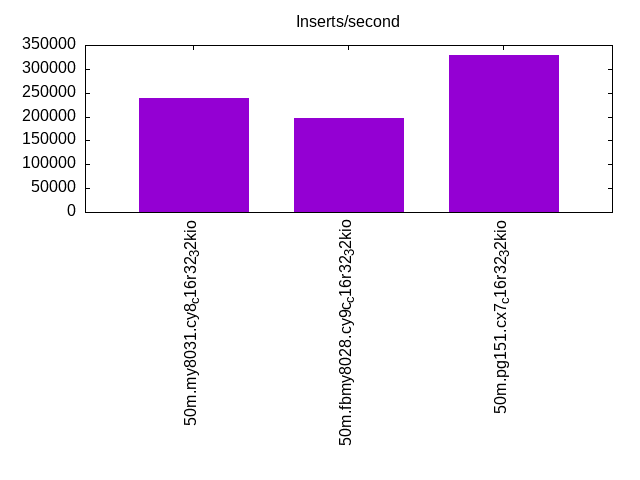
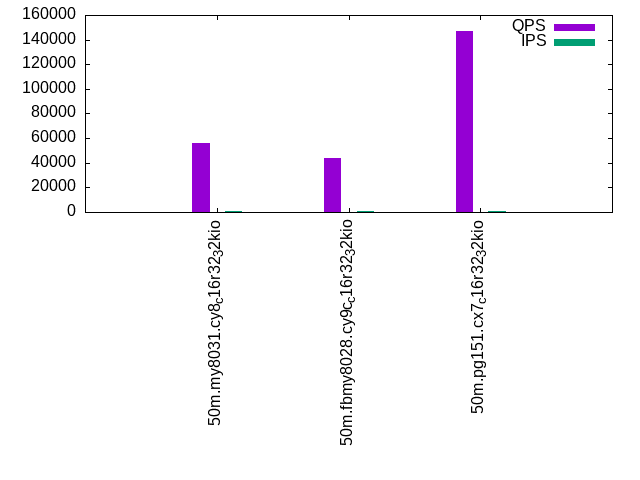
| 50m.my8031.cy8_c16r32_32kio | 520833 | 809677 | 238095 | 56314 | 55275 | 54388 |
| 50m.fbmy8028.cy9c_c16r32_32kio | 431034 | 612195 | 196850 | 44071 | 43179 | 41730 |
| 50m.pg151.cx7_c16r32_32kio | 609756 | 1568750 | 328947 | 146993 | 145331 | 141142 |
This lists the average rate of inserts/s for the tests that do inserts concurrent with queries. For such tests the query rate is listed in the table above. The read+write tests are setup so that the insert rate should match the target rate every second. Cells that are not at least 95% of the target have a red background to indicate a failure to satisfy the target.
| dbms | q100.1 | q500.1 | q1000.1 |
|---|---|---|---|
| my8031.cy8_c16r32_32kio | 797 | 3988 | 7976 |
| fbmy8028.cy9c_c16r32_32kio | 798 | 3988 | 7976 |
| pg151.cx7_c16r32_32kio | 798 | 3987 | 7976 |
| target | 800 | 4000 | 8000 |
l.i0
l.i0: load without secondary indexes. Graphs for performance per 1-second interval are here.
Average throughput:
Insert response time histogram: each cell has the percentage of responses that take <= the time in the header and max is the max response time in seconds. For the max column values in the top 25% of the range have a red background and in the bottom 25% of the range have a green background. The red background is not used when the min value is within 80% of the max value.
| dbms | 256us | 1ms | 4ms | 16ms | 64ms | 256ms | 1s | 4s | 16s | gt | max |
|---|---|---|---|---|---|---|---|---|---|---|---|
| my8031.cy8_c16r32_32kio | 88.571 | 11.233 | 0.169 | 0.028 | 0.063 | ||||||
| fbmy8028.cy9c_c16r32_32kio | 19.017 | 80.845 | 0.113 | 0.025 | 0.047 | ||||||
| pg151.cx7_c16r32_32kio | 98.226 | 1.772 | 0.002 | 0.006 |
Performance metrics for the DBMS listed above. Some are normalized by throughput, others are not. Legend for results is here.
ips	qps	rps	rmbps	wps	wmbps	rpq	rkbpq	wpi	wkbpi	csps	cpups	cspq	cpupq	dbgb1	dbgb2	rss	maxop	p50	p99	tag
520833	0	0	0.0	683.3	136.2	0.000	0.000	0.001	0.268	79757	54.3	0.153	17	1.7	66.3	4.0	0.063	99591	34163	50m.my8031.cy8_c16r32_32kio
431034	0	0	0.0	544.3	122.3	0.000	0.000	0.001	0.290	51266	52.2	0.119	19	0.9	2.4	0.9	0.047	74919	16592	50m.fbmy8028.cy9c_c16r32_32kio
609756	0	0	0.0	940.8	214.1	0.000	0.000	0.002	0.360	66673	47.9	0.109	13	2.4	6.5	0.0	0.006	137653	15388	50m.pg151.cx7_c16r32_32kio
l.x
l.x: create secondary indexes.
Average throughput:
Performance metrics for the DBMS listed above. Some are normalized by throughput, others are not. Legend for results is here.
ips	qps	rps	rmbps	wps	wmbps	rpq	rkbpq	wpi	wkbpi	csps	cpups	cspq	cpupq	dbgb1	dbgb2	rss	maxop	p50	p99	tag
809677	0	4581	292.4	15718.6	738.8	0.006	0.370	0.019	0.934	73676	33.3	0.091	7	3.8	68.3	5.3	0.017	NA	NA	50m.my8031.cy8_c16r32_32kio
612195	0	2	0.1	467.7	104.7	0.000	0.000	0.001	0.175	3648	40.4	0.006	11	1.8	3.3	3.1	0.008	NA	NA	50m.fbmy8028.cy9c_c16r32_32kio
1568750	0	0	0.0	2192.7	528.3	0.000	0.000	0.001	0.345	18755	25.8	0.012	3	4.6	10.7	2.2	0.003	NA	NA	50m.pg151.cx7_c16r32_32kio
l.i1
l.i1: continue load after secondary indexes created. Graphs for performance per 1-second interval are here.
Average throughput:
Insert response time histogram: each cell has the percentage of responses that take <= the time in the header and max is the max response time in seconds. For the max column values in the top 25% of the range have a red background and in the bottom 25% of the range have a green background. The red background is not used when the min value is within 80% of the max value.
| dbms | 256us | 1ms | 4ms | 16ms | 64ms | 256ms | 1s | 4s | 16s | gt | max |
|---|---|---|---|---|---|---|---|---|---|---|---|
| my8031.cy8_c16r32_32kio | 99.476 | 0.363 | 0.114 | 0.047 | 0.141 | ||||||
| fbmy8028.cy9c_c16r32_32kio | 0.731 | 99.122 | 0.133 | 0.015 | 0.044 | ||||||
| pg151.cx7_c16r32_32kio | 24.230 | 75.764 | 0.006 | 0.009 |
Performance metrics for the DBMS listed above. Some are normalized by throughput, others are not. Legend for results is here.
ips	qps	rps	rmbps	wps	wmbps	rpq	rkbpq	wpi	wkbpi	csps	cpups	cspq	cpupq	dbgb1	dbgb2	rss	maxop	p50	p99	tag
238095	0	1080	16.9	1634.9	187.5	0.005	0.073	0.007	0.807	84922	56.3	0.357	38	9.9	74.5	11.3	0.141	34013	450	50m.my8031.cy8_c16r32_32kio
196850	0	61	7.5	771.8	175.5	0.000	0.039	0.004	0.913	58445	51.7	0.297	42	4.9	5.8	3.7	0.044	25672	5649	50m.fbmy8028.cy9c_c16r32_32kio
328947	0	0	0.0	1462.1	334.7	0.000	0.000	0.004	1.042	81471	57.5	0.248	28	9.6	26.0	0.0	0.009	46800	28928	50m.pg151.cx7_c16r32_32kio
q100.1
q100.1: range queries with 100 insert/s per client. Graphs for performance per 1-second interval are here.
Average throughput:
Query response time histogram: each cell has the percentage of responses that take <= the time in the header and max is the max response time in seconds. For max values in the top 25% of the range have a red background and in the bottom 25% of the range have a green background. The red background is not used when the min value is within 80% of the max value.
| dbms | 256us | 1ms | 4ms | 16ms | 64ms | 256ms | 1s | 4s | 16s | gt | max |
|---|---|---|---|---|---|---|---|---|---|---|---|
| my8031.cy8_c16r32_32kio | 99.945 | 0.053 | 0.002 | nonzero | nonzero | 0.024 | |||||
| fbmy8028.cy9c_c16r32_32kio | 99.834 | 0.165 | 0.001 | nonzero | nonzero | 0.022 | |||||
| pg151.cx7_c16r32_32kio | 99.997 | 0.002 | 0.001 | nonzero | 0.011 |
Insert response time histogram: each cell has the percentage of responses that take <= the time in the header and max is the max response time in seconds. For max values in the top 25% of the range have a red background and in the bottom 25% of the range have a green background. The red background is not used when the min value is within 80% of the max value.
| dbms | 256us | 1ms | 4ms | 16ms | 64ms | 256ms | 1s | 4s | 16s | gt | max |
|---|---|---|---|---|---|---|---|---|---|---|---|
| my8031.cy8_c16r32_32kio | 99.155 | 0.845 | 0.010 | ||||||||
| fbmy8028.cy9c_c16r32_32kio | 3.068 | 96.929 | 0.003 | 0.008 | |||||||
| pg151.cx7_c16r32_32kio | 99.875 | 0.125 | 0.014 |
Performance metrics for the DBMS listed above. Some are normalized by throughput, others are not. Legend for results is here.
ips	qps	rps	rmbps	wps	wmbps	rpq	rkbpq	wpi	wkbpi	csps	cpups	cspq	cpupq	dbgb1	dbgb2	rss	maxop	p50	p99	tag
797	56314	0	0.0	147.3	4.3	0.000	0.000	0.185	5.489	216497	51.2	3.844	145	11.5	76.0	12.7	0.024	7064	6793	50m.my8031.cy8_c16r32_32kio
798	44071	0	0.0	11.6	2.1	0.000	0.000	0.015	2.725	168756	51.3	3.829	186	3.7	5.0	10.5	0.022	5530	5019	50m.fbmy8028.cy9c_c16r32_32kio
798	146993	0	0.0	518.4	21.4	0.000	0.000	0.650	27.445	561722	50.2	3.821	55	10.6	26.4	0.0	0.011	18765	18428	50m.pg151.cx7_c16r32_32kio
q500.1
q500.1: range queries with 500 insert/s per client. Graphs for performance per 1-second interval are here.
Average throughput:

Query response time histogram: each cell has the percentage of responses that take <= the time in the header and max is the max response time in seconds. For max values in the top 25% of the range have a red background and in the bottom 25% of the range have a green background. The red background is not used when the min value is within 80% of the max value.
| dbms | 256us | 1ms | 4ms | 16ms | 64ms | 256ms | 1s | 4s | 16s | gt | max |
|---|---|---|---|---|---|---|---|---|---|---|---|
| my8031.cy8_c16r32_32kio | 99.848 | 0.142 | 0.010 | nonzero | nonzero | 0.021 | |||||
| fbmy8028.cy9c_c16r32_32kio | 99.372 | 0.617 | 0.011 | nonzero | nonzero | 0.020 | |||||
| pg151.cx7_c16r32_32kio | 99.984 | 0.008 | 0.008 | nonzero | 0.013 |
Insert response time histogram: each cell has the percentage of responses that take <= the time in the header and max is the max response time in seconds. For max values in the top 25% of the range have a red background and in the bottom 25% of the range have a green background. The red background is not used when the min value is within 80% of the max value.
| dbms | 256us | 1ms | 4ms | 16ms | 64ms | 256ms | 1s | 4s | 16s | gt | max |
|---|---|---|---|---|---|---|---|---|---|---|---|
| my8031.cy8_c16r32_32kio | 98.475 | 1.525 | 0.012 | ||||||||
| fbmy8028.cy9c_c16r32_32kio | 2.394 | 97.458 | 0.145 | 0.003 | 0.018 | ||||||
| pg151.cx7_c16r32_32kio | 0.013 | 98.954 | 1.031 | 0.002 | 0.017 |
Performance metrics for the DBMS listed above. Some are normalized by throughput, others are not. Legend for results is here.
ips	qps	rps	rmbps	wps	wmbps	rpq	rkbpq	wpi	wkbpi	csps	cpups	cspq	cpupq	dbgb1	dbgb2	rss	maxop	p50	p99	tag
3988	55275	0	0.0	159.4	5.4	0.000	0.000	0.040	1.395	212796	51.6	3.850	149	12.8	77.3	13.9	0.021	6904	6665	50m.my8031.cy8_c16r32_32kio
3988	43179	0	0.0	31.9	6.9	0.000	0.000	0.008	1.759	165993	52.3	3.844	194	4.8	5.9	21.5	0.020	5402	4923	50m.fbmy8028.cy9c_c16r32_32kio
3987	145331	0	0.0	604.1	40.9	0.000	0.000	0.152	10.494	556052	50.9	3.826	56	15.2	27.3	0.0	0.013	18492	16723	50m.pg151.cx7_c16r32_32kio
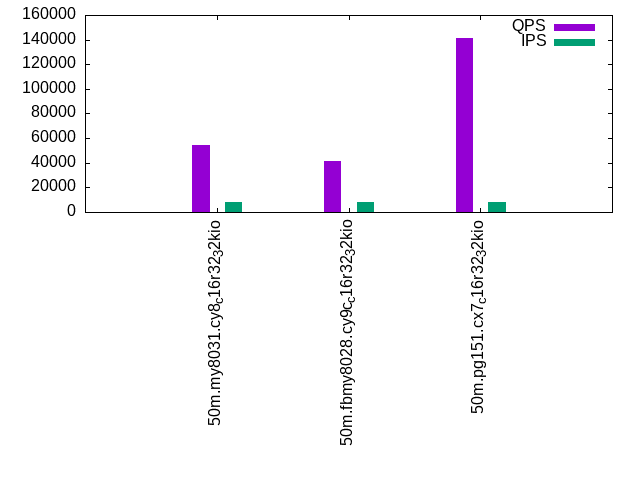
q1000.1
q1000.1: range queries with 1000 insert/s per client. Graphs for performance per 1-second interval are here.
Average throughput:
Query response time histogram: each cell has the percentage of responses that take <= the time in the header and max is the max response time in seconds. For max values in the top 25% of the range have a red background and in the bottom 25% of the range have a green background. The red background is not used when the min value is within 80% of the max value.
| dbms | 256us | 1ms | 4ms | 16ms | 64ms | 256ms | 1s | 4s | 16s | gt | max |
|---|---|---|---|---|---|---|---|---|---|---|---|
| my8031.cy8_c16r32_32kio | 99.721 | 0.264 | 0.015 | 0.001 | nonzero | 0.028 | |||||
| fbmy8028.cy9c_c16r32_32kio | 98.527 | 1.457 | 0.016 | nonzero | nonzero | 0.016 | |||||
| pg151.cx7_c16r32_32kio | 99.958 | 0.025 | 0.017 | nonzero | nonzero | 0.026 |
Insert response time histogram: each cell has the percentage of responses that take <= the time in the header and max is the max response time in seconds. For max values in the top 25% of the range have a red background and in the bottom 25% of the range have a green background. The red background is not used when the min value is within 80% of the max value.
| dbms | 256us | 1ms | 4ms | 16ms | 64ms | 256ms | 1s | 4s | 16s | gt | max |
|---|---|---|---|---|---|---|---|---|---|---|---|
| my8031.cy8_c16r32_32kio | 98.571 | 1.428 | 0.001 | 0.026 | |||||||
| fbmy8028.cy9c_c16r32_32kio | 2.720 | 97.019 | 0.256 | 0.006 | 0.024 | ||||||
| pg151.cx7_c16r32_32kio | 0.051 | 96.582 | 3.337 | 0.030 | 0.042 |
Performance metrics for the DBMS listed above. Some are normalized by throughput, others are not. Legend for results is here.
ips	qps	rps	rmbps	wps	wmbps	rpq	rkbpq	wpi	wkbpi	csps	cpups	cspq	cpupq	dbgb1	dbgb2	rss	maxop	p50	p99	tag
7976	54388	0	0.0	293.7	11.1	0.000	0.000	0.037	1.430	210178	52.5	3.864	154	17.2	81.8	18.1	0.028	6729	6505	50m.my8031.cy8_c16r32_32kio
7976	41730	8	1.0	64.4	14.1	0.000	0.025	0.008	1.816	161180	53.7	3.862	206	6.9	7.7	23.9	0.016	5242	4763	50m.fbmy8028.cy9c_c16r32_32kio
7976	141142	0	0.0	596.9	56.2	0.000	0.000	0.075	7.213	539999	51.4	3.826	58	19.0	35.4	0.0	0.026	17854	15711	50m.pg151.cx7_c16r32_32kio
l.i0
l.i0: load without secondary indexes
Performance metrics for all DBMS, not just the ones listed above. Some are normalized by throughput, others are not. Legend for results is here.
ips	qps	rps	rmbps	wps	wmbps	rpq	rkbpq	wpi	wkbpi	csps	cpups	cspq	cpupq	dbgb1	dbgb2	rss	maxop	p50	p99	tag
520833	0	0	0.0	683.3	136.2	0.000	0.000	0.001	0.268	79757	54.3	0.153	17	1.7	66.3	4.0	0.063	99591	34163	50m.my8031.cy8_c16r32_32kio
431034	0	0	0.0	544.3	122.3	0.000	0.000	0.001	0.290	51266	52.2	0.119	19	0.9	2.4	0.9	0.047	74919	16592	50m.fbmy8028.cy9c_c16r32_32kio
609756	0	0	0.0	940.8	214.1	0.000	0.000	0.002	0.360	66673	47.9	0.109	13	2.4	6.5	0.0	0.006	137653	15388	50m.pg151.cx7_c16r32_32kio
l.x
l.x: create secondary indexes
Performance metrics for all DBMS, not just the ones listed above. Some are normalized by throughput, others are not. Legend for results is here.
ips	qps	rps	rmbps	wps	wmbps	rpq	rkbpq	wpi	wkbpi	csps	cpups	cspq	cpupq	dbgb1	dbgb2	rss	maxop	p50	p99	tag
809677	0	4581	292.4	15718.6	738.8	0.006	0.370	0.019	0.934	73676	33.3	0.091	7	3.8	68.3	5.3	0.017	NA	NA	50m.my8031.cy8_c16r32_32kio
612195	0	2	0.1	467.7	104.7	0.000	0.000	0.001	0.175	3648	40.4	0.006	11	1.8	3.3	3.1	0.008	NA	NA	50m.fbmy8028.cy9c_c16r32_32kio
1568750	0	0	0.0	2192.7	528.3	0.000	0.000	0.001	0.345	18755	25.8	0.012	3	4.6	10.7	2.2	0.003	NA	NA	50m.pg151.cx7_c16r32_32kio
l.i1
l.i1: continue load after secondary indexes created
Performance metrics for all DBMS, not just the ones listed above. Some are normalized by throughput, others are not. Legend for results is here.
ips	qps	rps	rmbps	wps	wmbps	rpq	rkbpq	wpi	wkbpi	csps	cpups	cspq	cpupq	dbgb1	dbgb2	rss	maxop	p50	p99	tag
238095	0	1080	16.9	1634.9	187.5	0.005	0.073	0.007	0.807	84922	56.3	0.357	38	9.9	74.5	11.3	0.141	34013	450	50m.my8031.cy8_c16r32_32kio
196850	0	61	7.5	771.8	175.5	0.000	0.039	0.004	0.913	58445	51.7	0.297	42	4.9	5.8	3.7	0.044	25672	5649	50m.fbmy8028.cy9c_c16r32_32kio
328947	0	0	0.0	1462.1	334.7	0.000	0.000	0.004	1.042	81471	57.5	0.248	28	9.6	26.0	0.0	0.009	46800	28928	50m.pg151.cx7_c16r32_32kio
q100.1
q100.1: range queries with 100 insert/s per client
Performance metrics for all DBMS, not just the ones listed above. Some are normalized by throughput, others are not. Legend for results is here.
ips	qps	rps	rmbps	wps	wmbps	rpq	rkbpq	wpi	wkbpi	csps	cpups	cspq	cpupq	dbgb1	dbgb2	rss	maxop	p50	p99	tag
797	56314	0	0.0	147.3	4.3	0.000	0.000	0.185	5.489	216497	51.2	3.844	145	11.5	76.0	12.7	0.024	7064	6793	50m.my8031.cy8_c16r32_32kio
798	44071	0	0.0	11.6	2.1	0.000	0.000	0.015	2.725	168756	51.3	3.829	186	3.7	5.0	10.5	0.022	5530	5019	50m.fbmy8028.cy9c_c16r32_32kio
798	146993	0	0.0	518.4	21.4	0.000	0.000	0.650	27.445	561722	50.2	3.821	55	10.6	26.4	0.0	0.011	18765	18428	50m.pg151.cx7_c16r32_32kio
q500.1
q500.1: range queries with 500 insert/s per client
Performance metrics for all DBMS, not just the ones listed above. Some are normalized by throughput, others are not. Legend for results is here.
ips	qps	rps	rmbps	wps	wmbps	rpq	rkbpq	wpi	wkbpi	csps	cpups	cspq	cpupq	dbgb1	dbgb2	rss	maxop	p50	p99	tag
3988	55275	0	0.0	159.4	5.4	0.000	0.000	0.040	1.395	212796	51.6	3.850	149	12.8	77.3	13.9	0.021	6904	6665	50m.my8031.cy8_c16r32_32kio
3988	43179	0	0.0	31.9	6.9	0.000	0.000	0.008	1.759	165993	52.3	3.844	194	4.8	5.9	21.5	0.020	5402	4923	50m.fbmy8028.cy9c_c16r32_32kio
3987	145331	0	0.0	604.1	40.9	0.000	0.000	0.152	10.494	556052	50.9	3.826	56	15.2	27.3	0.0	0.013	18492	16723	50m.pg151.cx7_c16r32_32kio
q1000.1
q1000.1: range queries with 1000 insert/s per client
Performance metrics for all DBMS, not just the ones listed above. Some are normalized by throughput, others are not. Legend for results is here.
ips	qps	rps	rmbps	wps	wmbps	rpq	rkbpq	wpi	wkbpi	csps	cpups	cspq	cpupq	dbgb1	dbgb2	rss	maxop	p50	p99	tag
7976	54388	0	0.0	293.7	11.1	0.000	0.000	0.037	1.430	210178	52.5	3.864	154	17.2	81.8	18.1	0.028	6729	6505	50m.my8031.cy8_c16r32_32kio
7976	41730	8	1.0	64.4	14.1	0.000	0.025	0.008	1.816	161180	53.7	3.862	206	6.9	7.7	23.9	0.016	5242	4763	50m.fbmy8028.cy9c_c16r32_32kio
7976	141142	0	0.0	596.9	56.2	0.000	0.000	0.075	7.213	539999	51.4	3.826	58	19.0	35.4	0.0	0.026	17854	15711	50m.pg151.cx7_c16r32_32kio
l.i0
- l.i0: load without secondary indexes
- Legend for results is here.
- Each entry lists the percentage of responses that fit in that bucket (slower than max time for previous bucket, faster than min time for next bucket).
Insert response time histogram
256us	1ms	4ms	16ms	64ms	256ms	1s	4s	16s	gt	max	tag
0.000	88.571	11.233	0.169	0.028	0.000	0.000	0.000	0.000	0.000	0.063	my8031.cy8_c16r32_32kio
0.000	19.017	80.845	0.113	0.025	0.000	0.000	0.000	0.000	0.000	0.047	fbmy8028.cy9c_c16r32_32kio
0.000	98.226	1.772	0.002	0.000	0.000	0.000	0.000	0.000	0.000	0.006	pg151.cx7_c16r32_32kio
l.x
- l.x: create secondary indexes
- Legend for results is here.
- Each entry lists the percentage of responses that fit in that bucket (slower than max time for previous bucket, faster than min time for next bucket).
TODO - determine whether there is data for create index response time
l.i1
- l.i1: continue load after secondary indexes created
- Legend for results is here.
- Each entry lists the percentage of responses that fit in that bucket (slower than max time for previous bucket, faster than min time for next bucket).
Insert response time histogram
256us	1ms	4ms	16ms	64ms	256ms	1s	4s	16s	gt	max	tag
0.000	0.000	99.476	0.363	0.114	0.047	0.000	0.000	0.000	0.000	0.141	my8031.cy8_c16r32_32kio
0.000	0.731	99.122	0.133	0.015	0.000	0.000	0.000	0.000	0.000	0.044	fbmy8028.cy9c_c16r32_32kio
0.000	24.230	75.764	0.006	0.000	0.000	0.000	0.000	0.000	0.000	0.009	pg151.cx7_c16r32_32kio
q100.1
- q100.1: range queries with 100 insert/s per client
- Legend for results is here.
- Each entry lists the percentage of responses that fit in that bucket (slower than max time for previous bucket, faster than min time for next bucket).
Query response time histogram
256us	1ms	4ms	16ms	64ms	256ms	1s	4s	16s	gt	max	tag
99.945	0.053	0.002	nonzero	nonzero	0.000	0.000	0.000	0.000	0.000	0.024	my8031.cy8_c16r32_32kio
99.834	0.165	0.001	nonzero	nonzero	0.000	0.000	0.000	0.000	0.000	0.022	fbmy8028.cy9c_c16r32_32kio
99.997	0.002	0.001	nonzero	0.000	0.000	0.000	0.000	0.000	0.000	0.011	pg151.cx7_c16r32_32kio
Insert response time histogram
256us	1ms	4ms	16ms	64ms	256ms	1s	4s	16s	gt	max	tag
0.000	0.000	99.155	0.845	0.000	0.000	0.000	0.000	0.000	0.000	0.010	my8031.cy8_c16r32_32kio
0.000	3.068	96.929	0.003	0.000	0.000	0.000	0.000	0.000	0.000	0.008	fbmy8028.cy9c_c16r32_32kio
0.000	0.000	99.875	0.125	0.000	0.000	0.000	0.000	0.000	0.000	0.014	pg151.cx7_c16r32_32kio
q500.1
- q500.1: range queries with 500 insert/s per client
- Legend for results is here.
- Each entry lists the percentage of responses that fit in that bucket (slower than max time for previous bucket, faster than min time for next bucket).
Query response time histogram
256us	1ms	4ms	16ms	64ms	256ms	1s	4s	16s	gt	max	tag
99.848	0.142	0.010	nonzero	nonzero	0.000	0.000	0.000	0.000	0.000	0.021	my8031.cy8_c16r32_32kio
99.372	0.617	0.011	nonzero	nonzero	0.000	0.000	0.000	0.000	0.000	0.020	fbmy8028.cy9c_c16r32_32kio
99.984	0.008	0.008	nonzero	0.000	0.000	0.000	0.000	0.000	0.000	0.013	pg151.cx7_c16r32_32kio
Insert response time histogram
256us	1ms	4ms	16ms	64ms	256ms	1s	4s	16s	gt	max	tag
0.000	0.000	98.475	1.525	0.000	0.000	0.000	0.000	0.000	0.000	0.012	my8031.cy8_c16r32_32kio
0.000	2.394	97.458	0.145	0.003	0.000	0.000	0.000	0.000	0.000	0.018	fbmy8028.cy9c_c16r32_32kio
0.000	0.013	98.954	1.031	0.002	0.000	0.000	0.000	0.000	0.000	0.017	pg151.cx7_c16r32_32kio
q1000.1
- q1000.1: range queries with 1000 insert/s per client
- Legend for results is here.
- Each entry lists the percentage of responses that fit in that bucket (slower than max time for previous bucket, faster than min time for next bucket).
Query response time histogram
256us	1ms	4ms	16ms	64ms	256ms	1s	4s	16s	gt	max	tag
99.721	0.264	0.015	0.001	nonzero	0.000	0.000	0.000	0.000	0.000	0.028	my8031.cy8_c16r32_32kio
98.527	1.457	0.016	nonzero	nonzero	0.000	0.000	0.000	0.000	0.000	0.016	fbmy8028.cy9c_c16r32_32kio
99.958	0.025	0.017	nonzero	nonzero	0.000	0.000	0.000	0.000	0.000	0.026	pg151.cx7_c16r32_32kio
Insert response time histogram
256us	1ms	4ms	16ms	64ms	256ms	1s	4s	16s	gt	max	tag
0.000	0.000	98.571	1.428	0.001	0.000	0.000	0.000	0.000	0.000	0.026	my8031.cy8_c16r32_32kio
0.000	2.720	97.019	0.256	0.006	0.000	0.000	0.000	0.000	0.000	0.024	fbmy8028.cy9c_c16r32_32kio
0.000	0.051	96.582	3.337	0.030	0.000	0.000	0.000	0.000	0.000	0.042	pg151.cx7_c16r32_32kio