Introduction
This is a report for the insert benchmark with 50M docs and 4 client(s). It is generated by scripts (bash, awk, sed) and Tufte might not be impressed. An overview of the insert benchmark is here and a short update is here. Below, by DBMS, I mean DBMS+version.config. An example is my8020.c10b40 where my means MySQL, 8020 is version 8.0.20 and c10b40 is the name for the configuration file.
The test server is a c7g.4xl with 16 cores, 32G RAM and io2 storage (1T, 32K IOPs). The benchmark was run with 4 clients and there was 1 or 2 connections per client (1 for queries, 1 for inserts). The benchmark loads 25M rows without secondary indexes, creates secondary indexes, loads another 25M rows then does 3 read+write tests for one hour each that do queries as fast as possible with 100, 500 and then 1000 writes/second/client concurrent with the queries. The database is cached by the storage engine and the only IO is for writes. Clients and the DBMS share one server. The per-database configs are in the per-database subdirectories here.
The tested DBMS are:
- my8031.cy8_c16r32_32kio - MySQL 8.0.31 with InnoDB and the cy8_c16r32_32kio config
- fbmy8028.cy9c_c16r32_32kio - FB MySQL 8.0.28 with MyRocks and the cy9c_c16r32_32kio config
- pg151.cx7_c16r32_32kio - Postgres 15.1 and the cx7_c16r32_32kio config
Contents
- Summary
- l.i0: load without secondary indexes
- l.x: create secondary indexes
- l.i1: continue load after secondary indexes created
- q100.1: range queries with 100 insert/s per client
- q500.1: range queries with 500 insert/s per client
- q1000.1: range queries with 1000 insert/s per client
Summary
The numbers are inserts/s for l.i0 and l.i1, indexed docs (or rows) /s for l.x and queries/s for q*.2. The values are the average rate over the entire test for inserts (IPS) and queries (QPS). The range of values for IPS and QPS is split into 3 parts: bottom 25%, middle 50%, top 25%. Values in the bottom 25% have a red background, values in the top 25% have a green background and values in the middle have no color. A gray background is used for values that can be ignored because the DBMS did not sustain the target insert rate. Red backgrounds are not used when the minimum value is within 80% of the max value.
| dbms | l.i0 | l.x | l.i1 | q100.1 | q500.1 | q1000.1 |
|---|---|---|---|---|---|---|
| 50m.my8031.cy8_c16r32_32kio | 357143 | 643590 | 131579 | 29379 | 29168 | 28904 |
| 50m.fbmy8028.cy9c_c16r32_32kio | 290698 | 363768 | 161290 | 22572 | 22297 | 21984 |
| 50m.pg151.cx7_c16r32_32kio | 438596 | 1321053 | 192308 | 74621 | 74912 | 74599 |
This lists the average rate of inserts/s for the tests that do inserts concurrent with queries. For such tests the query rate is listed in the table above. The read+write tests are setup so that the insert rate should match the target rate every second. Cells that are not at least 95% of the target have a red background to indicate a failure to satisfy the target.
| dbms | q100.1 | q500.1 | q1000.1 |
|---|---|---|---|
| my8031.cy8_c16r32_32kio | 399 | 1996 | 3992 |
| fbmy8028.cy9c_c16r32_32kio | 399 | 1996 | 3992 |
| pg151.cx7_c16r32_32kio | 399 | 1997 | 3992 |
| target | 400 | 2000 | 4000 |
l.i0
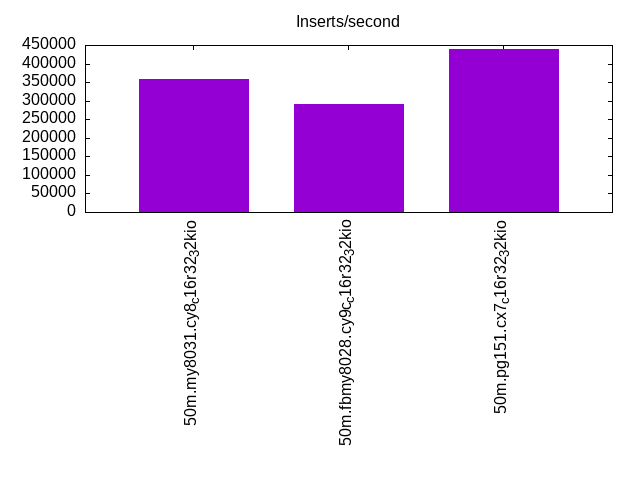
l.i0: load without secondary indexes. Graphs for performance per 1-second interval are here.
Average throughput:
Insert response time histogram: each cell has the percentage of responses that take <= the time in the header and max is the max response time in seconds. For the max column values in the top 25% of the range have a red background and in the bottom 25% of the range have a green background. The red background is not used when the min value is within 80% of the max value.
| dbms | 256us | 1ms | 4ms | 16ms | 64ms | 256ms | 1s | 4s | 16s | gt | max |
|---|---|---|---|---|---|---|---|---|---|---|---|
| my8031.cy8_c16r32_32kio | 99.551 | 0.273 | 0.162 | 0.014 | 0.050 | ||||||
| fbmy8028.cy9c_c16r32_32kio | 33.817 | 66.168 | 0.002 | 0.014 | 0.043 | ||||||
| pg151.cx7_c16r32_32kio | 99.990 | 0.010 | nonzero | 0.005 |
Performance metrics for the DBMS listed above. Some are normalized by throughput, others are not. Legend for results is here.
ips	qps	rps	rmbps	wps	wmbps	rpq	rkbpq	wpi	wkbpi	csps	cpups	cspq	cpupq	dbgb1	dbgb2	rss	maxop	p50	p99	tag
357143	0	0	0.0	494.0	89.9	0.000	0.000	0.001	0.258	66230	35.7	0.185	16	1.7	66.3	4.0	0.050	108983	73221	50m.my8031.cy8_c16r32_32kio
290698	0	0	0.0	395.4	88.1	0.000	0.000	0.001	0.310	35346	31.4	0.122	17	0.8	2.3	0.9	0.043	83411	70125	50m.fbmy8028.cy9c_c16r32_32kio
438596	0	0	0.0	801.5	182.3	0.000	0.000	0.002	0.426	55455	32.1	0.126	12	2.4	6.5	2.0	0.005	139452	63850	50m.pg151.cx7_c16r32_32kio
l.x
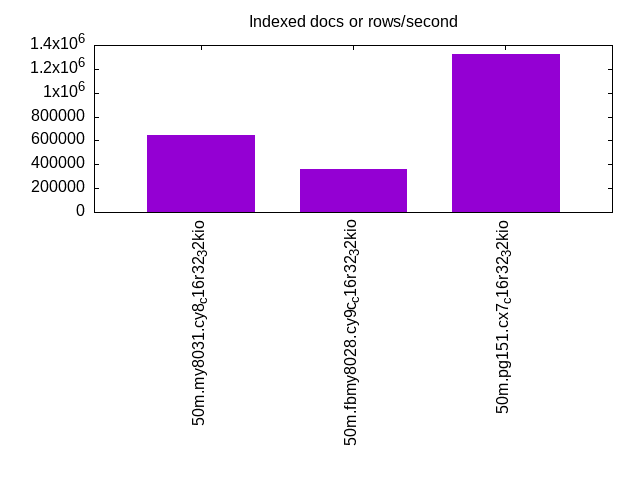
l.x: create secondary indexes.
Average throughput:
Performance metrics for the DBMS listed above. Some are normalized by throughput, others are not. Legend for results is here.
ips	qps	rps	rmbps	wps	wmbps	rpq	rkbpq	wpi	wkbpi	csps	cpups	cspq	cpupq	dbgb1	dbgb2	rss	maxop	p50	p99	tag
643590	0	3730	246.9	12699.3	657.7	0.006	0.393	0.020	1.046	53762	29.1	0.084	7	3.7	68.3	5.6	0.006	NA	NA	50m.my8031.cy8_c16r32_32kio
363768	0	1	0.0	254.9	56.2	0.000	0.000	0.001	0.158	1961	23.4	0.005	10	1.8	3.2	2.4	0.002	NA	NA	50m.fbmy8028.cy9c_c16r32_32kio
1321053	0	0	0.0	1277.3	311.8	0.000	0.000	0.001	0.242	10528	20.0	0.008	2	4.6	10.8	0.0	0.003	NA	NA	50m.pg151.cx7_c16r32_32kio
l.i1
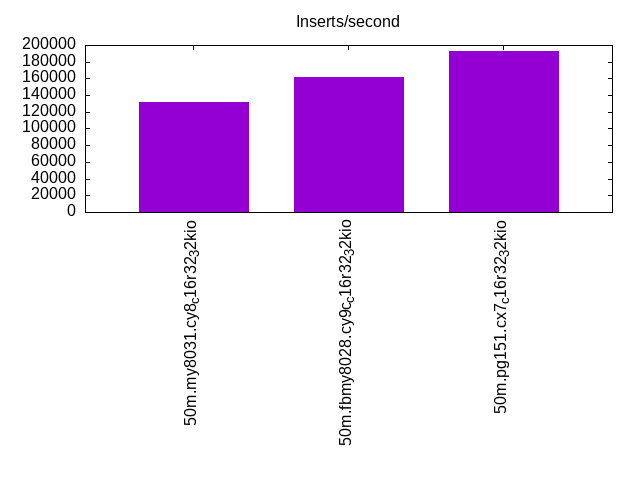
l.i1: continue load after secondary indexes created. Graphs for performance per 1-second interval are here.
Average throughput:
Insert response time histogram: each cell has the percentage of responses that take <= the time in the header and max is the max response time in seconds. For the max column values in the top 25% of the range have a red background and in the bottom 25% of the range have a green background. The red background is not used when the min value is within 80% of the max value.
| dbms | 256us | 1ms | 4ms | 16ms | 64ms | 256ms | 1s | 4s | 16s | gt | max |
|---|---|---|---|---|---|---|---|---|---|---|---|
| my8031.cy8_c16r32_32kio | 99.502 | 0.350 | 0.102 | 0.046 | 0.142 | ||||||
| fbmy8028.cy9c_c16r32_32kio | 1.776 | 98.202 | 0.014 | 0.007 | 0.050 | ||||||
| pg151.cx7_c16r32_32kio | 64.758 | 35.241 | 0.001 | 0.009 |
Performance metrics for the DBMS listed above. Some are normalized by throughput, others are not. Legend for results is here.
ips	qps	rps	rmbps	wps	wmbps	rpq	rkbpq	wpi	wkbpi	csps	cpups	cspq	cpupq	dbgb1	dbgb2	rss	maxop	p50	p99	tag
131579	0	619	9.7	1457.2	118.6	0.005	0.075	0.011	0.923	67663	33.4	0.514	41	9.9	74.5	11.3	0.142	36385	450	50m.my8031.cy8_c16r32_32kio
161290	0	48	6.0	654.0	147.7	0.000	0.038	0.004	0.938	40411	39.3	0.251	39	5.0	5.9	3.1	0.050	41120	36261	50m.fbmy8028.cy9c_c16r32_32kio
192308	0	0	0.0	887.5	202.3	0.000	0.000	0.005	1.077	48854	29.7	0.254	25	9.8	26.4	0.0	0.009	50196	14789	50m.pg151.cx7_c16r32_32kio
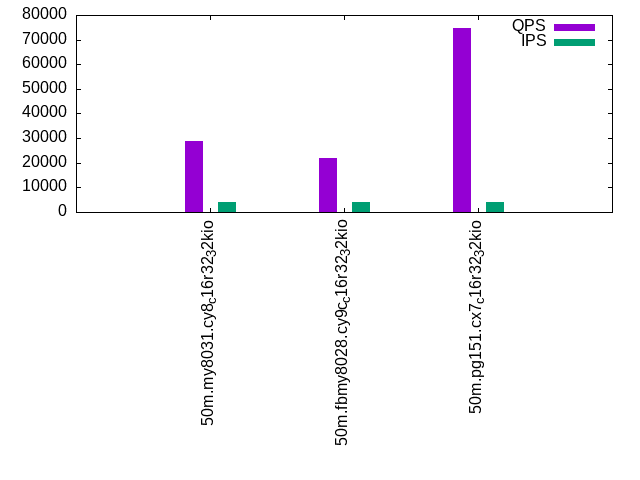
q100.1
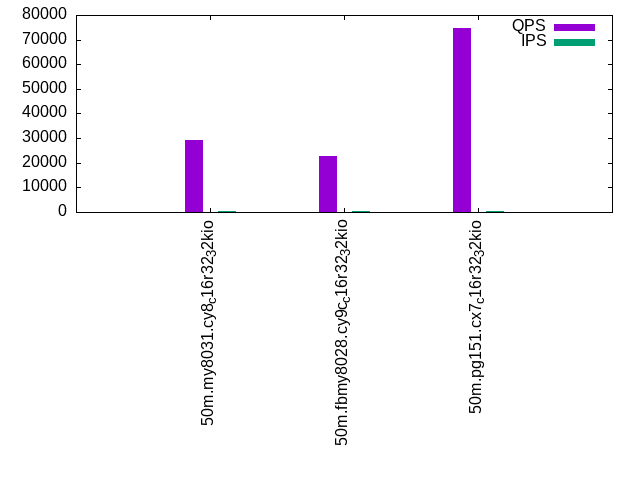
q100.1: range queries with 100 insert/s per client. Graphs for performance per 1-second interval are here.
Average throughput:
Query response time histogram: each cell has the percentage of responses that take <= the time in the header and max is the max response time in seconds. For max values in the top 25% of the range have a red background and in the bottom 25% of the range have a green background. The red background is not used when the min value is within 80% of the max value.
| dbms | 256us | 1ms | 4ms | 16ms | 64ms | 256ms | 1s | 4s | 16s | gt | max |
|---|---|---|---|---|---|---|---|---|---|---|---|
| my8031.cy8_c16r32_32kio | 99.999 | 0.001 | nonzero | nonzero | 0.006 | ||||||
| fbmy8028.cy9c_c16r32_32kio | 99.980 | 0.020 | nonzero | nonzero | nonzero | 0.016 | |||||
| pg151.cx7_c16r32_32kio | 99.999 | nonzero | nonzero | nonzero | 0.004 |
Insert response time histogram: each cell has the percentage of responses that take <= the time in the header and max is the max response time in seconds. For max values in the top 25% of the range have a red background and in the bottom 25% of the range have a green background. The red background is not used when the min value is within 80% of the max value.
| dbms | 256us | 1ms | 4ms | 16ms | 64ms | 256ms | 1s | 4s | 16s | gt | max |
|---|---|---|---|---|---|---|---|---|---|---|---|
| my8031.cy8_c16r32_32kio | 99.288 | 0.712 | 0.007 | ||||||||
| fbmy8028.cy9c_c16r32_32kio | 9.816 | 90.184 | 0.002 | ||||||||
| pg151.cx7_c16r32_32kio | 99.847 | 0.146 | 0.007 | 0.016 |
Performance metrics for the DBMS listed above. Some are normalized by throughput, others are not. Legend for results is here.
ips	qps	rps	rmbps	wps	wmbps	rpq	rkbpq	wpi	wkbpi	csps	cpups	cspq	cpupq	dbgb1	dbgb2	rss	maxop	p50	p99	tag
399	29379	0	0.0	110.9	3.0	0.000	0.000	0.278	7.641	113397	25.2	3.860	137	10.7	75.3	12.1	0.006	7304	6971	50m.my8031.cy8_c16r32_32kio
399	22572	0	0.0	9.3	1.5	0.000	0.000	0.023	3.852	86597	25.7	3.836	182	3.7	4.7	8.2	0.016	5642	5147	50m.fbmy8028.cy9c_c16r32_32kio
399	74621	0	0.0	476.2	15.0	0.000	0.000	1.193	38.359	285368	24.8	3.824	53	10.4	24.9	0.0	0.004	18939	18508	50m.pg151.cx7_c16r32_32kio
q500.1
q500.1: range queries with 500 insert/s per client. Graphs for performance per 1-second interval are here.
Average throughput:

Query response time histogram: each cell has the percentage of responses that take <= the time in the header and max is the max response time in seconds. For max values in the top 25% of the range have a red background and in the bottom 25% of the range have a green background. The red background is not used when the min value is within 80% of the max value.
| dbms | 256us | 1ms | 4ms | 16ms | 64ms | 256ms | 1s | 4s | 16s | gt | max |
|---|---|---|---|---|---|---|---|---|---|---|---|
| my8031.cy8_c16r32_32kio | 99.993 | 0.006 | 0.001 | nonzero | 0.006 | ||||||
| fbmy8028.cy9c_c16r32_32kio | 99.985 | 0.015 | nonzero | nonzero | nonzero | 0.024 | |||||
| pg151.cx7_c16r32_32kio | 99.998 | 0.002 | nonzero | nonzero | 0.005 |
Insert response time histogram: each cell has the percentage of responses that take <= the time in the header and max is the max response time in seconds. For max values in the top 25% of the range have a red background and in the bottom 25% of the range have a green background. The red background is not used when the min value is within 80% of the max value.
| dbms | 256us | 1ms | 4ms | 16ms | 64ms | 256ms | 1s | 4s | 16s | gt | max |
|---|---|---|---|---|---|---|---|---|---|---|---|
| my8031.cy8_c16r32_32kio | 99.742 | 0.258 | 0.001 | 0.016 | |||||||
| fbmy8028.cy9c_c16r32_32kio | 11.656 | 88.335 | 0.009 | 0.013 | |||||||
| pg151.cx7_c16r32_32kio | 0.019 | 99.820 | 0.158 | 0.002 | 0.016 |
Performance metrics for the DBMS listed above. Some are normalized by throughput, others are not. Legend for results is here.
ips	qps	rps	rmbps	wps	wmbps	rpq	rkbpq	wpi	wkbpi	csps	cpups	cspq	cpupq	dbgb1	dbgb2	rss	maxop	p50	p99	tag
1996	29168	0	0.0	25.7	1.5	0.000	0.000	0.013	0.775	112938	25.5	3.872	140	12.1	76.7	13.3	0.006	7272	6937	50m.my8031.cy8_c16r32_32kio
1996	22297	0	0.0	17.4	3.3	0.000	0.000	0.009	1.715	85937	26.1	3.854	187	4.1	6.1	15.2	0.024	5530	5098	50m.fbmy8028.cy9c_c16r32_32kio
1997	74912	0	0.0	640.9	30.2	0.000	0.000	0.321	15.506	286969	24.9	3.831	53	13.2	23.1	0.0	0.005	18795	18444	50m.pg151.cx7_c16r32_32kio
q1000.1
q1000.1: range queries with 1000 insert/s per client. Graphs for performance per 1-second interval are here.
Average throughput:
Query response time histogram: each cell has the percentage of responses that take <= the time in the header and max is the max response time in seconds. For max values in the top 25% of the range have a red background and in the bottom 25% of the range have a green background. The red background is not used when the min value is within 80% of the max value.
| dbms | 256us | 1ms | 4ms | 16ms | 64ms | 256ms | 1s | 4s | 16s | gt | max |
|---|---|---|---|---|---|---|---|---|---|---|---|
| my8031.cy8_c16r32_32kio | 99.986 | 0.012 | 0.001 | nonzero | 0.005 | ||||||
| fbmy8028.cy9c_c16r32_32kio | 99.968 | 0.032 | 0.001 | nonzero | 0.007 | ||||||
| pg151.cx7_c16r32_32kio | 99.995 | 0.004 | 0.001 | nonzero | 0.007 |
Insert response time histogram: each cell has the percentage of responses that take <= the time in the header and max is the max response time in seconds. For max values in the top 25% of the range have a red background and in the bottom 25% of the range have a green background. The red background is not used when the min value is within 80% of the max value.
| dbms | 256us | 1ms | 4ms | 16ms | 64ms | 256ms | 1s | 4s | 16s | gt | max |
|---|---|---|---|---|---|---|---|---|---|---|---|
| my8031.cy8_c16r32_32kio | 99.901 | 0.099 | 0.010 | ||||||||
| fbmy8028.cy9c_c16r32_32kio | 8.899 | 91.091 | 0.011 | 0.009 | |||||||
| pg151.cx7_c16r32_32kio | 0.330 | 99.162 | 0.506 | 0.001 | 0.018 |
Performance metrics for the DBMS listed above. Some are normalized by throughput, others are not. Legend for results is here.
ips	qps	rps	rmbps	wps	wmbps	rpq	rkbpq	wpi	wkbpi	csps	cpups	cspq	cpupq	dbgb1	dbgb2	rss	maxop	p50	p99	tag
3992	28904	0	0.0	185.6	6.0	0.000	0.000	0.046	1.544	113153	26.3	3.915	146	13.2	77.8	14.4	0.005	7199	6856	50m.my8031.cy8_c16r32_32kio
3992	21984	3	0.4	31.8	6.6	0.000	0.016	0.008	1.695	85330	26.6	3.882	194	5.2	7.0	21.8	0.007	5501	5051	50m.fbmy8028.cy9c_c16r32_32kio
3992	74599	0	0.0	689.0	42.8	0.000	0.000	0.173	10.979	286453	25.4	3.840	54	15.5	28.0	0.0	0.007	18672	17981	50m.pg151.cx7_c16r32_32kio
l.i0
l.i0: load without secondary indexes
Performance metrics for all DBMS, not just the ones listed above. Some are normalized by throughput, others are not. Legend for results is here.
ips	qps	rps	rmbps	wps	wmbps	rpq	rkbpq	wpi	wkbpi	csps	cpups	cspq	cpupq	dbgb1	dbgb2	rss	maxop	p50	p99	tag
357143	0	0	0.0	494.0	89.9	0.000	0.000	0.001	0.258	66230	35.7	0.185	16	1.7	66.3	4.0	0.050	108983	73221	50m.my8031.cy8_c16r32_32kio
290698	0	0	0.0	395.4	88.1	0.000	0.000	0.001	0.310	35346	31.4	0.122	17	0.8	2.3	0.9	0.043	83411	70125	50m.fbmy8028.cy9c_c16r32_32kio
438596	0	0	0.0	801.5	182.3	0.000	0.000	0.002	0.426	55455	32.1	0.126	12	2.4	6.5	2.0	0.005	139452	63850	50m.pg151.cx7_c16r32_32kio
l.x
l.x: create secondary indexes
Performance metrics for all DBMS, not just the ones listed above. Some are normalized by throughput, others are not. Legend for results is here.
ips	qps	rps	rmbps	wps	wmbps	rpq	rkbpq	wpi	wkbpi	csps	cpups	cspq	cpupq	dbgb1	dbgb2	rss	maxop	p50	p99	tag
643590	0	3730	246.9	12699.3	657.7	0.006	0.393	0.020	1.046	53762	29.1	0.084	7	3.7	68.3	5.6	0.006	NA	NA	50m.my8031.cy8_c16r32_32kio
363768	0	1	0.0	254.9	56.2	0.000	0.000	0.001	0.158	1961	23.4	0.005	10	1.8	3.2	2.4	0.002	NA	NA	50m.fbmy8028.cy9c_c16r32_32kio
1321053	0	0	0.0	1277.3	311.8	0.000	0.000	0.001	0.242	10528	20.0	0.008	2	4.6	10.8	0.0	0.003	NA	NA	50m.pg151.cx7_c16r32_32kio
l.i1
l.i1: continue load after secondary indexes created
Performance metrics for all DBMS, not just the ones listed above. Some are normalized by throughput, others are not. Legend for results is here.
ips	qps	rps	rmbps	wps	wmbps	rpq	rkbpq	wpi	wkbpi	csps	cpups	cspq	cpupq	dbgb1	dbgb2	rss	maxop	p50	p99	tag
131579	0	619	9.7	1457.2	118.6	0.005	0.075	0.011	0.923	67663	33.4	0.514	41	9.9	74.5	11.3	0.142	36385	450	50m.my8031.cy8_c16r32_32kio
161290	0	48	6.0	654.0	147.7	0.000	0.038	0.004	0.938	40411	39.3	0.251	39	5.0	5.9	3.1	0.050	41120	36261	50m.fbmy8028.cy9c_c16r32_32kio
192308	0	0	0.0	887.5	202.3	0.000	0.000	0.005	1.077	48854	29.7	0.254	25	9.8	26.4	0.0	0.009	50196	14789	50m.pg151.cx7_c16r32_32kio
q100.1
q100.1: range queries with 100 insert/s per client
Performance metrics for all DBMS, not just the ones listed above. Some are normalized by throughput, others are not. Legend for results is here.
ips	qps	rps	rmbps	wps	wmbps	rpq	rkbpq	wpi	wkbpi	csps	cpups	cspq	cpupq	dbgb1	dbgb2	rss	maxop	p50	p99	tag
399	29379	0	0.0	110.9	3.0	0.000	0.000	0.278	7.641	113397	25.2	3.860	137	10.7	75.3	12.1	0.006	7304	6971	50m.my8031.cy8_c16r32_32kio
399	22572	0	0.0	9.3	1.5	0.000	0.000	0.023	3.852	86597	25.7	3.836	182	3.7	4.7	8.2	0.016	5642	5147	50m.fbmy8028.cy9c_c16r32_32kio
399	74621	0	0.0	476.2	15.0	0.000	0.000	1.193	38.359	285368	24.8	3.824	53	10.4	24.9	0.0	0.004	18939	18508	50m.pg151.cx7_c16r32_32kio
q500.1
q500.1: range queries with 500 insert/s per client
Performance metrics for all DBMS, not just the ones listed above. Some are normalized by throughput, others are not. Legend for results is here.
ips	qps	rps	rmbps	wps	wmbps	rpq	rkbpq	wpi	wkbpi	csps	cpups	cspq	cpupq	dbgb1	dbgb2	rss	maxop	p50	p99	tag
1996	29168	0	0.0	25.7	1.5	0.000	0.000	0.013	0.775	112938	25.5	3.872	140	12.1	76.7	13.3	0.006	7272	6937	50m.my8031.cy8_c16r32_32kio
1996	22297	0	0.0	17.4	3.3	0.000	0.000	0.009	1.715	85937	26.1	3.854	187	4.1	6.1	15.2	0.024	5530	5098	50m.fbmy8028.cy9c_c16r32_32kio
1997	74912	0	0.0	640.9	30.2	0.000	0.000	0.321	15.506	286969	24.9	3.831	53	13.2	23.1	0.0	0.005	18795	18444	50m.pg151.cx7_c16r32_32kio
q1000.1
q1000.1: range queries with 1000 insert/s per client
Performance metrics for all DBMS, not just the ones listed above. Some are normalized by throughput, others are not. Legend for results is here.
ips	qps	rps	rmbps	wps	wmbps	rpq	rkbpq	wpi	wkbpi	csps	cpups	cspq	cpupq	dbgb1	dbgb2	rss	maxop	p50	p99	tag
3992	28904	0	0.0	185.6	6.0	0.000	0.000	0.046	1.544	113153	26.3	3.915	146	13.2	77.8	14.4	0.005	7199	6856	50m.my8031.cy8_c16r32_32kio
3992	21984	3	0.4	31.8	6.6	0.000	0.016	0.008	1.695	85330	26.6	3.882	194	5.2	7.0	21.8	0.007	5501	5051	50m.fbmy8028.cy9c_c16r32_32kio
3992	74599	0	0.0	689.0	42.8	0.000	0.000	0.173	10.979	286453	25.4	3.840	54	15.5	28.0	0.0	0.007	18672	17981	50m.pg151.cx7_c16r32_32kio
l.i0
- l.i0: load without secondary indexes
- Legend for results is here.
- Each entry lists the percentage of responses that fit in that bucket (slower than max time for previous bucket, faster than min time for next bucket).
Insert response time histogram
256us	1ms	4ms	16ms	64ms	256ms	1s	4s	16s	gt	max	tag
0.000	99.551	0.273	0.162	0.014	0.000	0.000	0.000	0.000	0.000	0.050	my8031.cy8_c16r32_32kio
0.000	33.817	66.168	0.002	0.014	0.000	0.000	0.000	0.000	0.000	0.043	fbmy8028.cy9c_c16r32_32kio
0.000	99.990	0.010	nonzero	0.000	0.000	0.000	0.000	0.000	0.000	0.005	pg151.cx7_c16r32_32kio
l.x
- l.x: create secondary indexes
- Legend for results is here.
- Each entry lists the percentage of responses that fit in that bucket (slower than max time for previous bucket, faster than min time for next bucket).
TODO - determine whether there is data for create index response time
l.i1
- l.i1: continue load after secondary indexes created
- Legend for results is here.
- Each entry lists the percentage of responses that fit in that bucket (slower than max time for previous bucket, faster than min time for next bucket).
Insert response time histogram
256us	1ms	4ms	16ms	64ms	256ms	1s	4s	16s	gt	max	tag
0.000	0.000	99.502	0.350	0.102	0.046	0.000	0.000	0.000	0.000	0.142	my8031.cy8_c16r32_32kio
0.000	1.776	98.202	0.014	0.007	0.000	0.000	0.000	0.000	0.000	0.050	fbmy8028.cy9c_c16r32_32kio
0.000	64.758	35.241	0.001	0.000	0.000	0.000	0.000	0.000	0.000	0.009	pg151.cx7_c16r32_32kio
q100.1
- q100.1: range queries with 100 insert/s per client
- Legend for results is here.
- Each entry lists the percentage of responses that fit in that bucket (slower than max time for previous bucket, faster than min time for next bucket).
Query response time histogram
256us	1ms	4ms	16ms	64ms	256ms	1s	4s	16s	gt	max	tag
99.999	0.001	nonzero	nonzero	0.000	0.000	0.000	0.000	0.000	0.000	0.006	my8031.cy8_c16r32_32kio
99.980	0.020	nonzero	nonzero	nonzero	0.000	0.000	0.000	0.000	0.000	0.016	fbmy8028.cy9c_c16r32_32kio
99.999	nonzero	nonzero	nonzero	0.000	0.000	0.000	0.000	0.000	0.000	0.004	pg151.cx7_c16r32_32kio
Insert response time histogram
256us	1ms	4ms	16ms	64ms	256ms	1s	4s	16s	gt	max	tag
0.000	0.000	99.288	0.712	0.000	0.000	0.000	0.000	0.000	0.000	0.007	my8031.cy8_c16r32_32kio
0.000	9.816	90.184	0.000	0.000	0.000	0.000	0.000	0.000	0.000	0.002	fbmy8028.cy9c_c16r32_32kio
0.000	0.000	99.847	0.146	0.007	0.000	0.000	0.000	0.000	0.000	0.016	pg151.cx7_c16r32_32kio
q500.1
- q500.1: range queries with 500 insert/s per client
- Legend for results is here.
- Each entry lists the percentage of responses that fit in that bucket (slower than max time for previous bucket, faster than min time for next bucket).
Query response time histogram
256us	1ms	4ms	16ms	64ms	256ms	1s	4s	16s	gt	max	tag
99.993	0.006	0.001	nonzero	0.000	0.000	0.000	0.000	0.000	0.000	0.006	my8031.cy8_c16r32_32kio
99.985	0.015	nonzero	nonzero	nonzero	0.000	0.000	0.000	0.000	0.000	0.024	fbmy8028.cy9c_c16r32_32kio
99.998	0.002	nonzero	nonzero	0.000	0.000	0.000	0.000	0.000	0.000	0.005	pg151.cx7_c16r32_32kio
Insert response time histogram
256us	1ms	4ms	16ms	64ms	256ms	1s	4s	16s	gt	max	tag
0.000	0.000	99.742	0.258	0.001	0.000	0.000	0.000	0.000	0.000	0.016	my8031.cy8_c16r32_32kio
0.000	11.656	88.335	0.009	0.000	0.000	0.000	0.000	0.000	0.000	0.013	fbmy8028.cy9c_c16r32_32kio
0.000	0.019	99.820	0.158	0.002	0.000	0.000	0.000	0.000	0.000	0.016	pg151.cx7_c16r32_32kio
q1000.1
- q1000.1: range queries with 1000 insert/s per client
- Legend for results is here.
- Each entry lists the percentage of responses that fit in that bucket (slower than max time for previous bucket, faster than min time for next bucket).
Query response time histogram
256us	1ms	4ms	16ms	64ms	256ms	1s	4s	16s	gt	max	tag
99.986	0.012	0.001	nonzero	0.000	0.000	0.000	0.000	0.000	0.000	0.005	my8031.cy8_c16r32_32kio
99.968	0.032	0.001	nonzero	0.000	0.000	0.000	0.000	0.000	0.000	0.007	fbmy8028.cy9c_c16r32_32kio
99.995	0.004	0.001	nonzero	0.000	0.000	0.000	0.000	0.000	0.000	0.007	pg151.cx7_c16r32_32kio
Insert response time histogram
256us	1ms	4ms	16ms	64ms	256ms	1s	4s	16s	gt	max	tag
0.000	0.000	99.901	0.099	0.000	0.000	0.000	0.000	0.000	0.000	0.010	my8031.cy8_c16r32_32kio
0.000	8.899	91.091	0.011	0.000	0.000	0.000	0.000	0.000	0.000	0.009	fbmy8028.cy9c_c16r32_32kio
0.000	0.330	99.162	0.506	0.001	0.000	0.000	0.000	0.000	0.000	0.018	pg151.cx7_c16r32_32kio