Introduction
This is a report for the insert benchmark with 50M docs and 8 client(s). It is generated by scripts (bash, awk, sed) and Tufte might not be impressed. An overview of the insert benchmark is here and a short update is here. Below, by DBMS, I mean DBMS+version.config. An example is my8020.c10b40 where my means MySQL, 8020 is version 8.0.20 and c10b40 is the name for the configuration file.
The test server is an c6i.4xl with 8 cores, 8 HW threads (hyperthread disabled), 32G RAM and io2 storage (1T, 32K IOPs). The benchmark was run with 8 clients and there was 1 or 2 connections per client (1 for queries, 1 for inserts). The benchmark loads 25M rows without secondary indexes, creates secondary indexes, loads another 25M rows then does 3 read+write tests for one hour each that do queries as fast as possible with 100, 500 and then 1000 writes/second/client concurrent with the queries. The database is cached by the storage engine and the only IO is for writes. Clients and the DBMS share one server. The per-database configs are in the per-database subdirectories here.
The tested DBMS are:
- my8031.cy8_c16r32_32kio - MySQL 8.0.31 with InnoDB and the cy8_c16r32_32kio config
- fbmy8028.cy9c_c16r32_32kio - FB MySQL 8.0.28 with MyRocks and the cy9c_c16r32_32kio config
- pg151.cx7_c16r32_32kio - Postgres 15.1 and the cx7_c16r32_32kio config
Contents
- Summary
- l.i0: load without secondary indexes
- l.x: create secondary indexes
- l.i1: continue load after secondary indexes created
- q100.1: range queries with 100 insert/s per client
- q500.1: range queries with 500 insert/s per client
- q1000.1: range queries with 1000 insert/s per client
Summary
The numbers are inserts/s for l.i0 and l.i1, indexed docs (or rows) /s for l.x and queries/s for q*.2. The values are the average rate over the entire test for inserts (IPS) and queries (QPS). The range of values for IPS and QPS is split into 3 parts: bottom 25%, middle 50%, top 25%. Values in the bottom 25% have a red background, values in the top 25% have a green background and values in the middle have no color. A gray background is used for values that can be ignored because the DBMS did not sustain the target insert rate. Red backgrounds are not used when the minimum value is within 80% of the max value.
| dbms | l.i0 | l.x | l.i1 | q100.1 | q500.1 | q1000.1 |
|---|---|---|---|---|---|---|
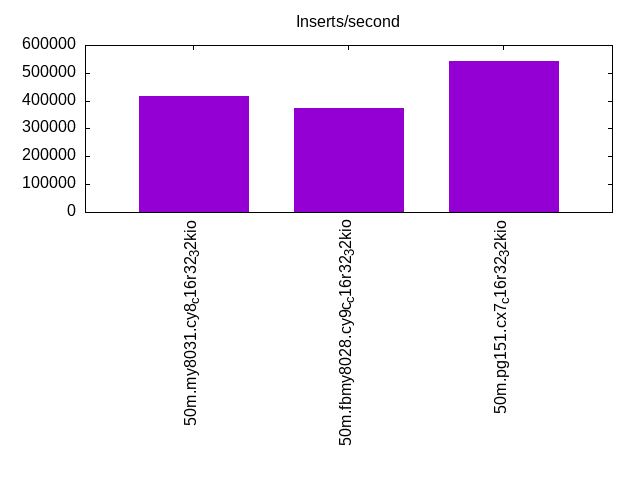
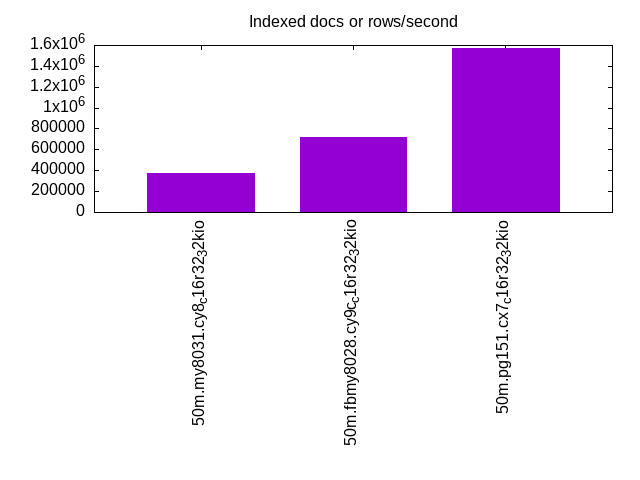
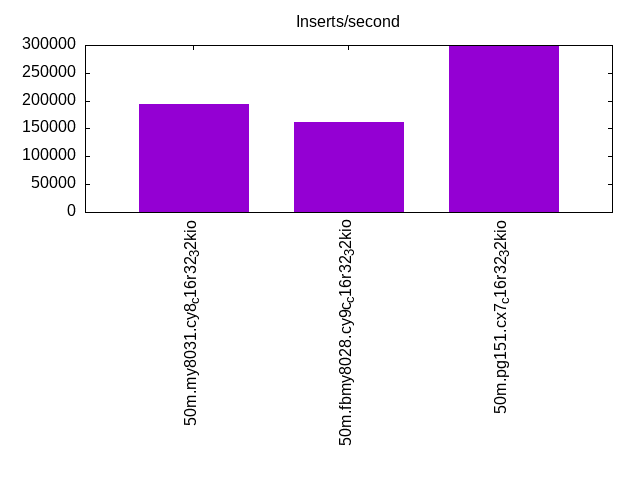
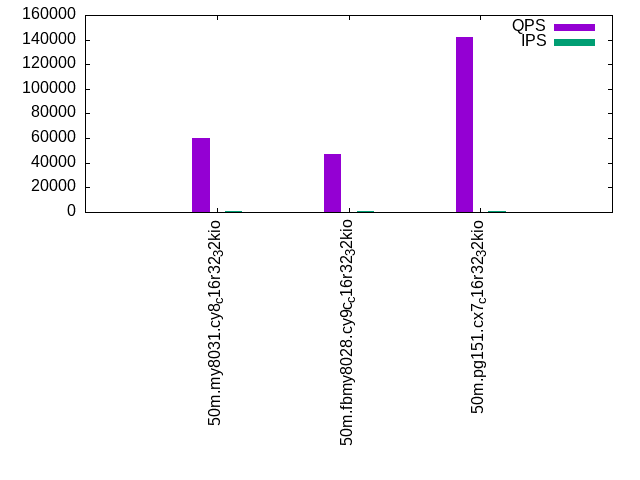
| 50m.my8031.cy8_c16r32_32kio | 416667 | 369118 | 193798 | 60062 | 58976 | 57582 |
| 50m.fbmy8028.cy9c_c16r32_32kio | 373134 | 717143 | 161290 | 47306 | 45931 | 44085 |
| 50m.pg151.cx7_c16r32_32kio | 543478 | 1568750 | 297619 | 142056 | 141376 | 136668 |
This lists the average rate of inserts/s for the tests that do inserts concurrent with queries. For such tests the query rate is listed in the table above. The read+write tests are setup so that the insert rate should match the target rate every second. Cells that are not at least 95% of the target have a red background to indicate a failure to satisfy the target.
| dbms | q100.1 | q500.1 | q1000.1 |
|---|---|---|---|
| my8031.cy8_c16r32_32kio | 798 | 3988 | 7976 |
| fbmy8028.cy9c_c16r32_32kio | 798 | 3989 | 7976 |
| pg151.cx7_c16r32_32kio | 798 | 3988 | 7978 |
| target | 800 | 4000 | 8000 |
l.i0
l.i0: load without secondary indexes. Graphs for performance per 1-second interval are here.
Average throughput:
Insert response time histogram: each cell has the percentage of responses that take <= the time in the header and max is the max response time in seconds. For the max column values in the top 25% of the range have a red background and in the bottom 25% of the range have a green background. The red background is not used when the min value is within 80% of the max value.
| dbms | 256us | 1ms | 4ms | 16ms | 64ms | 256ms | 1s | 4s | 16s | gt | max |
|---|---|---|---|---|---|---|---|---|---|---|---|
| my8031.cy8_c16r32_32kio | 20.703 | 78.910 | 0.360 | 0.027 | nonzero | 0.065 | |||||
| fbmy8028.cy9c_c16r32_32kio | 13.659 | 85.310 | 0.996 | 0.036 | 0.055 | ||||||
| pg151.cx7_c16r32_32kio | 40.721 | 59.192 | 0.086 | 0.013 |
Performance metrics for the DBMS listed above. Some are normalized by throughput, others are not. Legend for results is here.
ips	qps	rps	rmbps	wps	wmbps	rpq	rkbpq	wpi	wkbpi	csps	cpups	cspq	cpupq	dbgb1	dbgb2	rss	maxop	p50	p99	tag
416667	0	0	0.0	550.1	104.7	0.000	0.000	0.001	0.257	115511	74.9	0.277	14	1.7	66.3	4.0	0.065	58537	6596	50m.my8031.cy8_c16r32_32kio
373134	0	0	0.0	485.2	109.6	0.000	0.000	0.001	0.301	26578	75.6	0.071	16	0.9	2.3	0.9	0.055	60554	47050	50m.fbmy8028.cy9c_c16r32_32kio
543478	0	0	0.0	860.3	195.5	0.000	0.000	0.002	0.368	40129	72.8	0.074	11	2.4	6.5	0.0	0.013	148144	15783	50m.pg151.cx7_c16r32_32kio
l.x
l.x: create secondary indexes.
Average throughput:
Performance metrics for the DBMS listed above. Some are normalized by throughput, others are not. Legend for results is here.
ips	qps	rps	rmbps	wps	wmbps	rpq	rkbpq	wpi	wkbpi	csps	cpups	cspq	cpupq	dbgb1	dbgb2	rss	maxop	p50	p99	tag
369118	0	2156	136.8	7009.6	337.4	0.006	0.379	0.019	0.936	36648	35.9	0.099	8	3.8	68.3	5.5	0.004	NA	NA	50m.my8031.cy8_c16r32_32kio
717143	0	3	0.1	516.1	114.6	0.000	0.000	0.001	0.164	1807	74.1	0.003	8	1.8	3.3	2.9	0.002	NA	NA	50m.fbmy8028.cy9c_c16r32_32kio
1568750	0	0	0.0	1835.0	443.5	0.000	0.000	0.001	0.289	9215	45.5	0.006	2	4.6	10.7	2.3	0.023	NA	NA	50m.pg151.cx7_c16r32_32kio
l.i1
l.i1: continue load after secondary indexes created. Graphs for performance per 1-second interval are here.
Average throughput:
Insert response time histogram: each cell has the percentage of responses that take <= the time in the header and max is the max response time in seconds. For the max column values in the top 25% of the range have a red background and in the bottom 25% of the range have a green background. The red background is not used when the min value is within 80% of the max value.
| dbms | 256us | 1ms | 4ms | 16ms | 64ms | 256ms | 1s | 4s | 16s | gt | max |
|---|---|---|---|---|---|---|---|---|---|---|---|
| my8031.cy8_c16r32_32kio | 0.022 | 98.578 | 1.253 | 0.124 | 0.024 | 0.202 | |||||
| fbmy8028.cy9c_c16r32_32kio | 5.163 | 89.466 | 5.324 | 0.047 | nonzero | 0.067 | |||||
| pg151.cx7_c16r32_32kio | 12.486 | 87.281 | 0.190 | 0.042 | 0.002 | 0.086 |
Performance metrics for the DBMS listed above. Some are normalized by throughput, others are not. Legend for results is here.
ips	qps	rps	rmbps	wps	wmbps	rpq	rkbpq	wpi	wkbpi	csps	cpups	cspq	cpupq	dbgb1	dbgb2	rss	maxop	p50	p99	tag
193798	0	908	14.2	1365.3	152.0	0.005	0.075	0.007	0.803	108954	78.9	0.562	33	9.9	74.5	11.3	0.202	25779	549	50m.my8031.cy8_c16r32_32kio
161290	0	49	6.1	756.7	172.0	0.000	0.039	0.005	1.092	28051	75.4	0.174	37	4.2	5.1	3.2	0.067	21427	2199	50m.fbmy8028.cy9c_c16r32_32kio
297619	0	0	0.0	1356.6	311.1	0.000	0.000	0.005	1.070	36698	90.5	0.123	24	9.6	26.1	0.0	0.086	40617	9989	50m.pg151.cx7_c16r32_32kio
q100.1
q100.1: range queries with 100 insert/s per client. Graphs for performance per 1-second interval are here.
Average throughput:
Query response time histogram: each cell has the percentage of responses that take <= the time in the header and max is the max response time in seconds. For max values in the top 25% of the range have a red background and in the bottom 25% of the range have a green background. The red background is not used when the min value is within 80% of the max value.
| dbms | 256us | 1ms | 4ms | 16ms | 64ms | 256ms | 1s | 4s | 16s | gt | max |
|---|---|---|---|---|---|---|---|---|---|---|---|
| my8031.cy8_c16r32_32kio | 99.911 | 0.070 | 0.016 | 0.002 | nonzero | 0.030 | |||||
| fbmy8028.cy9c_c16r32_32kio | 99.656 | 0.320 | 0.019 | 0.004 | nonzero | 0.052 | |||||
| pg151.cx7_c16r32_32kio | 99.972 | 0.021 | 0.006 | 0.001 | nonzero | 0.026 |
Insert response time histogram: each cell has the percentage of responses that take <= the time in the header and max is the max response time in seconds. For max values in the top 25% of the range have a red background and in the bottom 25% of the range have a green background. The red background is not used when the min value is within 80% of the max value.
| dbms | 256us | 1ms | 4ms | 16ms | 64ms | 256ms | 1s | 4s | 16s | gt | max |
|---|---|---|---|---|---|---|---|---|---|---|---|
| my8031.cy8_c16r32_32kio | 97.998 | 2.000 | 0.002 | 0.026 | |||||||
| fbmy8028.cy9c_c16r32_32kio | 45.403 | 54.557 | 0.040 | 0.009 | |||||||
| pg151.cx7_c16r32_32kio | 0.017 | 99.856 | 0.127 | 0.008 |
Performance metrics for the DBMS listed above. Some are normalized by throughput, others are not. Legend for results is here.
ips	qps	rps	rmbps	wps	wmbps	rpq	rkbpq	wpi	wkbpi	csps	cpups	cspq	cpupq	dbgb1	dbgb2	rss	maxop	p50	p99	tag
798	60062	0	0.0	143.2	4.2	0.000	0.000	0.179	5.346	116391	95.0	1.938	127	11.5	76.0	12.7	0.030	7576	6441	50m.my8031.cy8_c16r32_32kio
798	47306	0	0.0	10.1	1.7	0.000	0.000	0.013	2.243	90791	95.2	1.919	161	3.8	5.0	9.1	0.052	5898	5194	50m.fbmy8028.cy9c_c16r32_32kio
798	142056	0	0.0	521.7	21.4	0.000	0.000	0.654	27.417	271802	95.2	1.913	54	10.6	26.4	0.0	0.026	17661	16974	50m.pg151.cx7_c16r32_32kio
q500.1
q500.1: range queries with 500 insert/s per client. Graphs for performance per 1-second interval are here.
Average throughput:
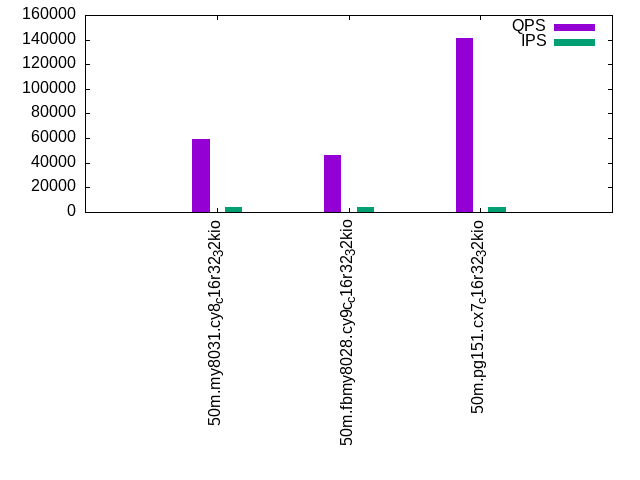
Query response time histogram: each cell has the percentage of responses that take <= the time in the header and max is the max response time in seconds. For max values in the top 25% of the range have a red background and in the bottom 25% of the range have a green background. The red background is not used when the min value is within 80% of the max value.
| dbms | 256us | 1ms | 4ms | 16ms | 64ms | 256ms | 1s | 4s | 16s | gt | max |
|---|---|---|---|---|---|---|---|---|---|---|---|
| my8031.cy8_c16r32_32kio | 99.821 | 0.118 | 0.045 | 0.015 | 0.001 | nonzero | 0.113 | ||||
| fbmy8028.cy9c_c16r32_32kio | 98.923 | 1.033 | 0.021 | 0.021 | 0.003 | nonzero | 0.074 | ||||
| pg151.cx7_c16r32_32kio | 99.967 | 0.021 | 0.006 | 0.005 | nonzero | 0.047 |
Insert response time histogram: each cell has the percentage of responses that take <= the time in the header and max is the max response time in seconds. For max values in the top 25% of the range have a red background and in the bottom 25% of the range have a green background. The red background is not used when the min value is within 80% of the max value.
| dbms | 256us | 1ms | 4ms | 16ms | 64ms | 256ms | 1s | 4s | 16s | gt | max |
|---|---|---|---|---|---|---|---|---|---|---|---|
| my8031.cy8_c16r32_32kio | 86.408 | 13.442 | 0.149 | 0.046 | |||||||
| fbmy8028.cy9c_c16r32_32kio | 38.564 | 58.136 | 3.089 | 0.211 | 0.051 | ||||||
| pg151.cx7_c16r32_32kio | 8.935 | 89.761 | 1.198 | 0.105 | 0.060 |
Performance metrics for the DBMS listed above. Some are normalized by throughput, others are not. Legend for results is here.
ips	qps	rps	rmbps	wps	wmbps	rpq	rkbpq	wpi	wkbpi	csps	cpups	cspq	cpupq	dbgb1	dbgb2	rss	maxop	p50	p99	tag
3988	58976	0	0.0	160.5	5.4	0.000	0.000	0.040	1.398	114886	95.0	1.948	129	12.8	77.3	13.9	0.113	7418	6393	50m.my8031.cy8_c16r32_32kio
3989	45931	0	0.0	31.7	6.8	0.000	0.000	0.008	1.751	88582	95.2	1.929	166	4.8	5.9	21.1	0.074	5740	4349	50m.fbmy8028.cy9c_c16r32_32kio
3988	141376	0	0.0	604.0	40.9	0.000	0.000	0.151	10.491	270910	95.1	1.916	54	15.2	27.2	0.0	0.047	17725	16773	50m.pg151.cx7_c16r32_32kio
q1000.1
q1000.1: range queries with 1000 insert/s per client. Graphs for performance per 1-second interval are here.
Average throughput:
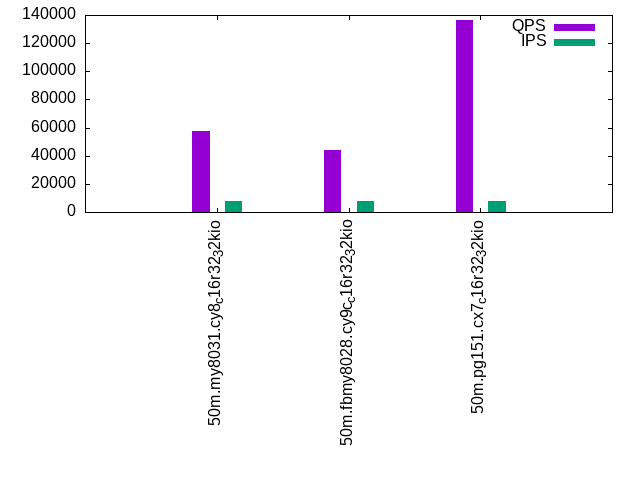
Query response time histogram: each cell has the percentage of responses that take <= the time in the header and max is the max response time in seconds. For max values in the top 25% of the range have a red background and in the bottom 25% of the range have a green background. The red background is not used when the min value is within 80% of the max value.
| dbms | 256us | 1ms | 4ms | 16ms | 64ms | 256ms | 1s | 4s | 16s | gt | max |
|---|---|---|---|---|---|---|---|---|---|---|---|
| my8031.cy8_c16r32_32kio | 99.460 | 0.394 | 0.125 | 0.020 | 0.001 | nonzero | 0.108 | ||||
| fbmy8028.cy9c_c16r32_32kio | 97.488 | 2.376 | 0.102 | 0.027 | 0.006 | nonzero | 0.082 | ||||
| pg151.cx7_c16r32_32kio | 99.915 | 0.030 | 0.049 | 0.002 | 0.005 | nonzero | 0.068 |
Insert response time histogram: each cell has the percentage of responses that take <= the time in the header and max is the max response time in seconds. For max values in the top 25% of the range have a red background and in the bottom 25% of the range have a green background. The red background is not used when the min value is within 80% of the max value.
| dbms | 256us | 1ms | 4ms | 16ms | 64ms | 256ms | 1s | 4s | 16s | gt | max |
|---|---|---|---|---|---|---|---|---|---|---|---|
| my8031.cy8_c16r32_32kio | 76.645 | 23.066 | 0.289 | nonzero | 0.066 | ||||||
| fbmy8028.cy9c_c16r32_32kio | 14.362 | 80.615 | 4.568 | 0.455 | 0.058 | ||||||
| pg151.cx7_c16r32_32kio | 2.043 | 91.176 | 6.192 | 0.585 | 0.004 | 0.091 |
Performance metrics for the DBMS listed above. Some are normalized by throughput, others are not. Legend for results is here.
ips	qps	rps	rmbps	wps	wmbps	rpq	rkbpq	wpi	wkbpi	csps	cpups	cspq	cpupq	dbgb1	dbgb2	rss	maxop	p50	p99	tag
7976	57582	0	0.0	295.5	11.2	0.000	0.000	0.037	1.434	113447	95.0	1.970	132	17.2	81.8	18.0	0.108	7272	6313	50m.my8031.cy8_c16r32_32kio
7976	44085	2	0.3	63.0	13.9	0.000	0.006	0.008	1.787	85586	95.1	1.941	173	6.8	7.6	21.2	0.082	5578	3868	50m.fbmy8028.cy9c_c16r32_32kio
7978	136668	0	0.0	598.5	56.3	0.000	0.000	0.075	7.222	262648	95.0	1.922	56	19.0	35.5	0.0	0.068	17497	15408	50m.pg151.cx7_c16r32_32kio
l.i0
l.i0: load without secondary indexes
Performance metrics for all DBMS, not just the ones listed above. Some are normalized by throughput, others are not. Legend for results is here.
ips	qps	rps	rmbps	wps	wmbps	rpq	rkbpq	wpi	wkbpi	csps	cpups	cspq	cpupq	dbgb1	dbgb2	rss	maxop	p50	p99	tag
416667	0	0	0.0	550.1	104.7	0.000	0.000	0.001	0.257	115511	74.9	0.277	14	1.7	66.3	4.0	0.065	58537	6596	50m.my8031.cy8_c16r32_32kio
373134	0	0	0.0	485.2	109.6	0.000	0.000	0.001	0.301	26578	75.6	0.071	16	0.9	2.3	0.9	0.055	60554	47050	50m.fbmy8028.cy9c_c16r32_32kio
543478	0	0	0.0	860.3	195.5	0.000	0.000	0.002	0.368	40129	72.8	0.074	11	2.4	6.5	0.0	0.013	148144	15783	50m.pg151.cx7_c16r32_32kio
l.x
l.x: create secondary indexes
Performance metrics for all DBMS, not just the ones listed above. Some are normalized by throughput, others are not. Legend for results is here.
ips	qps	rps	rmbps	wps	wmbps	rpq	rkbpq	wpi	wkbpi	csps	cpups	cspq	cpupq	dbgb1	dbgb2	rss	maxop	p50	p99	tag
369118	0	2156	136.8	7009.6	337.4	0.006	0.379	0.019	0.936	36648	35.9	0.099	8	3.8	68.3	5.5	0.004	NA	NA	50m.my8031.cy8_c16r32_32kio
717143	0	3	0.1	516.1	114.6	0.000	0.000	0.001	0.164	1807	74.1	0.003	8	1.8	3.3	2.9	0.002	NA	NA	50m.fbmy8028.cy9c_c16r32_32kio
1568750	0	0	0.0	1835.0	443.5	0.000	0.000	0.001	0.289	9215	45.5	0.006	2	4.6	10.7	2.3	0.023	NA	NA	50m.pg151.cx7_c16r32_32kio
l.i1
l.i1: continue load after secondary indexes created
Performance metrics for all DBMS, not just the ones listed above. Some are normalized by throughput, others are not. Legend for results is here.
ips	qps	rps	rmbps	wps	wmbps	rpq	rkbpq	wpi	wkbpi	csps	cpups	cspq	cpupq	dbgb1	dbgb2	rss	maxop	p50	p99	tag
193798	0	908	14.2	1365.3	152.0	0.005	0.075	0.007	0.803	108954	78.9	0.562	33	9.9	74.5	11.3	0.202	25779	549	50m.my8031.cy8_c16r32_32kio
161290	0	49	6.1	756.7	172.0	0.000	0.039	0.005	1.092	28051	75.4	0.174	37	4.2	5.1	3.2	0.067	21427	2199	50m.fbmy8028.cy9c_c16r32_32kio
297619	0	0	0.0	1356.6	311.1	0.000	0.000	0.005	1.070	36698	90.5	0.123	24	9.6	26.1	0.0	0.086	40617	9989	50m.pg151.cx7_c16r32_32kio
q100.1
q100.1: range queries with 100 insert/s per client
Performance metrics for all DBMS, not just the ones listed above. Some are normalized by throughput, others are not. Legend for results is here.
ips	qps	rps	rmbps	wps	wmbps	rpq	rkbpq	wpi	wkbpi	csps	cpups	cspq	cpupq	dbgb1	dbgb2	rss	maxop	p50	p99	tag
798	60062	0	0.0	143.2	4.2	0.000	0.000	0.179	5.346	116391	95.0	1.938	127	11.5	76.0	12.7	0.030	7576	6441	50m.my8031.cy8_c16r32_32kio
798	47306	0	0.0	10.1	1.7	0.000	0.000	0.013	2.243	90791	95.2	1.919	161	3.8	5.0	9.1	0.052	5898	5194	50m.fbmy8028.cy9c_c16r32_32kio
798	142056	0	0.0	521.7	21.4	0.000	0.000	0.654	27.417	271802	95.2	1.913	54	10.6	26.4	0.0	0.026	17661	16974	50m.pg151.cx7_c16r32_32kio
q500.1
q500.1: range queries with 500 insert/s per client
Performance metrics for all DBMS, not just the ones listed above. Some are normalized by throughput, others are not. Legend for results is here.
ips	qps	rps	rmbps	wps	wmbps	rpq	rkbpq	wpi	wkbpi	csps	cpups	cspq	cpupq	dbgb1	dbgb2	rss	maxop	p50	p99	tag
3988	58976	0	0.0	160.5	5.4	0.000	0.000	0.040	1.398	114886	95.0	1.948	129	12.8	77.3	13.9	0.113	7418	6393	50m.my8031.cy8_c16r32_32kio
3989	45931	0	0.0	31.7	6.8	0.000	0.000	0.008	1.751	88582	95.2	1.929	166	4.8	5.9	21.1	0.074	5740	4349	50m.fbmy8028.cy9c_c16r32_32kio
3988	141376	0	0.0	604.0	40.9	0.000	0.000	0.151	10.491	270910	95.1	1.916	54	15.2	27.2	0.0	0.047	17725	16773	50m.pg151.cx7_c16r32_32kio
q1000.1
q1000.1: range queries with 1000 insert/s per client
Performance metrics for all DBMS, not just the ones listed above. Some are normalized by throughput, others are not. Legend for results is here.
ips	qps	rps	rmbps	wps	wmbps	rpq	rkbpq	wpi	wkbpi	csps	cpups	cspq	cpupq	dbgb1	dbgb2	rss	maxop	p50	p99	tag
7976	57582	0	0.0	295.5	11.2	0.000	0.000	0.037	1.434	113447	95.0	1.970	132	17.2	81.8	18.0	0.108	7272	6313	50m.my8031.cy8_c16r32_32kio
7976	44085	2	0.3	63.0	13.9	0.000	0.006	0.008	1.787	85586	95.1	1.941	173	6.8	7.6	21.2	0.082	5578	3868	50m.fbmy8028.cy9c_c16r32_32kio
7978	136668	0	0.0	598.5	56.3	0.000	0.000	0.075	7.222	262648	95.0	1.922	56	19.0	35.5	0.0	0.068	17497	15408	50m.pg151.cx7_c16r32_32kio
l.i0
- l.i0: load without secondary indexes
- Legend for results is here.
- Each entry lists the percentage of responses that fit in that bucket (slower than max time for previous bucket, faster than min time for next bucket).
Insert response time histogram
256us	1ms	4ms	16ms	64ms	256ms	1s	4s	16s	gt	max	tag
0.000	20.703	78.910	0.360	0.027	nonzero	0.000	0.000	0.000	0.000	0.065	my8031.cy8_c16r32_32kio
0.000	13.659	85.310	0.996	0.036	0.000	0.000	0.000	0.000	0.000	0.055	fbmy8028.cy9c_c16r32_32kio
0.000	40.721	59.192	0.086	0.000	0.000	0.000	0.000	0.000	0.000	0.013	pg151.cx7_c16r32_32kio
l.x
- l.x: create secondary indexes
- Legend for results is here.
- Each entry lists the percentage of responses that fit in that bucket (slower than max time for previous bucket, faster than min time for next bucket).
TODO - determine whether there is data for create index response time
l.i1
- l.i1: continue load after secondary indexes created
- Legend for results is here.
- Each entry lists the percentage of responses that fit in that bucket (slower than max time for previous bucket, faster than min time for next bucket).
Insert response time histogram
256us	1ms	4ms	16ms	64ms	256ms	1s	4s	16s	gt	max	tag
0.000	0.022	98.578	1.253	0.124	0.024	0.000	0.000	0.000	0.000	0.202	my8031.cy8_c16r32_32kio
0.000	5.163	89.466	5.324	0.047	nonzero	0.000	0.000	0.000	0.000	0.067	fbmy8028.cy9c_c16r32_32kio
0.000	12.486	87.281	0.190	0.042	0.002	0.000	0.000	0.000	0.000	0.086	pg151.cx7_c16r32_32kio
q100.1
- q100.1: range queries with 100 insert/s per client
- Legend for results is here.
- Each entry lists the percentage of responses that fit in that bucket (slower than max time for previous bucket, faster than min time for next bucket).
Query response time histogram
256us	1ms	4ms	16ms	64ms	256ms	1s	4s	16s	gt	max	tag
99.911	0.070	0.016	0.002	nonzero	0.000	0.000	0.000	0.000	0.000	0.030	my8031.cy8_c16r32_32kio
99.656	0.320	0.019	0.004	nonzero	0.000	0.000	0.000	0.000	0.000	0.052	fbmy8028.cy9c_c16r32_32kio
99.972	0.021	0.006	0.001	nonzero	0.000	0.000	0.000	0.000	0.000	0.026	pg151.cx7_c16r32_32kio
Insert response time histogram
256us	1ms	4ms	16ms	64ms	256ms	1s	4s	16s	gt	max	tag
0.000	0.000	97.998	2.000	0.002	0.000	0.000	0.000	0.000	0.000	0.026	my8031.cy8_c16r32_32kio
0.000	45.403	54.557	0.040	0.000	0.000	0.000	0.000	0.000	0.000	0.009	fbmy8028.cy9c_c16r32_32kio
0.000	0.017	99.856	0.127	0.000	0.000	0.000	0.000	0.000	0.000	0.008	pg151.cx7_c16r32_32kio
q500.1
- q500.1: range queries with 500 insert/s per client
- Legend for results is here.
- Each entry lists the percentage of responses that fit in that bucket (slower than max time for previous bucket, faster than min time for next bucket).
Query response time histogram
256us	1ms	4ms	16ms	64ms	256ms	1s	4s	16s	gt	max	tag
99.821	0.118	0.045	0.015	0.001	nonzero	0.000	0.000	0.000	0.000	0.113	my8031.cy8_c16r32_32kio
98.923	1.033	0.021	0.021	0.003	nonzero	0.000	0.000	0.000	0.000	0.074	fbmy8028.cy9c_c16r32_32kio
99.967	0.021	0.006	0.005	nonzero	0.000	0.000	0.000	0.000	0.000	0.047	pg151.cx7_c16r32_32kio
Insert response time histogram
256us	1ms	4ms	16ms	64ms	256ms	1s	4s	16s	gt	max	tag
0.000	0.000	86.408	13.442	0.149	0.000	0.000	0.000	0.000	0.000	0.046	my8031.cy8_c16r32_32kio
0.000	38.564	58.136	3.089	0.211	0.000	0.000	0.000	0.000	0.000	0.051	fbmy8028.cy9c_c16r32_32kio
0.000	8.935	89.761	1.198	0.105	0.000	0.000	0.000	0.000	0.000	0.060	pg151.cx7_c16r32_32kio
q1000.1
- q1000.1: range queries with 1000 insert/s per client
- Legend for results is here.
- Each entry lists the percentage of responses that fit in that bucket (slower than max time for previous bucket, faster than min time for next bucket).
Query response time histogram
256us	1ms	4ms	16ms	64ms	256ms	1s	4s	16s	gt	max	tag
99.460	0.394	0.125	0.020	0.001	nonzero	0.000	0.000	0.000	0.000	0.108	my8031.cy8_c16r32_32kio
97.488	2.376	0.102	0.027	0.006	nonzero	0.000	0.000	0.000	0.000	0.082	fbmy8028.cy9c_c16r32_32kio
99.915	0.030	0.049	0.002	0.005	nonzero	0.000	0.000	0.000	0.000	0.068	pg151.cx7_c16r32_32kio
Insert response time histogram
256us	1ms	4ms	16ms	64ms	256ms	1s	4s	16s	gt	max	tag
0.000	0.000	76.645	23.066	0.289	nonzero	0.000	0.000	0.000	0.000	0.066	my8031.cy8_c16r32_32kio
0.000	14.362	80.615	4.568	0.455	0.000	0.000	0.000	0.000	0.000	0.058	fbmy8028.cy9c_c16r32_32kio
0.000	2.043	91.176	6.192	0.585	0.004	0.000	0.000	0.000	0.000	0.091	pg151.cx7_c16r32_32kio