Introduction
This is a report for the insert benchmark with 500M docs and 4 client(s). It is generated by scripts (bash, awk, sed) and Tufte might not be impressed. An overview of the insert benchmark is here and a short update is here. Below, by DBMS, I mean DBMS+version.config. An example is my8020.c10b40 where my means MySQL, 8020 is version 8.0.20 and c10b40 is the name for the configuration file.
The test server has 8 AMD cores, 16G RAM and an NVMe SSD. It is described here as the Beelink. The benchmark was run with 4 clients and there were 1 or 2 connections per client (1 for queries, 1 for inserts). The benchmark loads 500M rows without secondary indexes, creates secondary indexes, loads another 10M rows then does 3 read+write tests for one hour each that do queries as fast as possible with 100, 500 and then 1000 writes/second/client concurrent with the queries. The database doesn't fit in memory and parts of the benchmark are IO-bound. Clients and the DBMS share one server. The per-database configs are in the per-database subdirectories here.
The tested DBMS are:
- pg1211.cx7 - Postgres 12.11 and the cx7 config
- pg137.cx7 - Postgres 13.7 and the cx7 config
- pg146.cx7 - Postgres 14.6 and the cx7 config
- pg151.cx7 - Postgres 15.1 and the cx7 config
Contents
- Summary
- l.i0: load without secondary indexes
- l.x: create secondary indexes
- l.i1: continue load after secondary indexes created
- q100.1: range queries with 100 insert/s per client
- q500.1: range queries with 500 insert/s per client
- q1000.1: range queries with 1000 insert/s per client
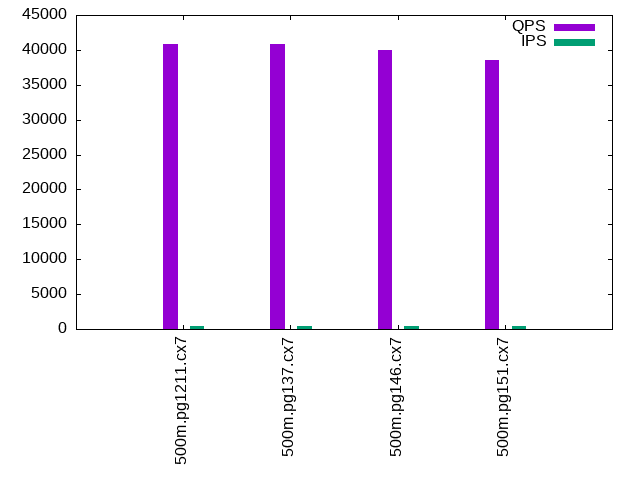
Summary
The numbers are inserts/s for l.i0 and l.i1, indexed docs (or rows) /s for l.x and queries/s for q*.2. The values are the average rate over the entire test for inserts (IPS) and queries (QPS). The range of values for IPS and QPS is split into 3 parts: bottom 25%, middle 50%, top 25%. Values in the bottom 25% have a red background, values in the top 25% have a green background and values in the middle have no color. A gray background is used for values that can be ignored because the DBMS did not sustain the target insert rate. Red backgrounds are not used when the minimum value is within 80% of the max value.
| dbms | l.i0 | l.x | l.i1 | q100.1 | q500.1 | q1000.1 |
|---|---|---|---|---|---|---|
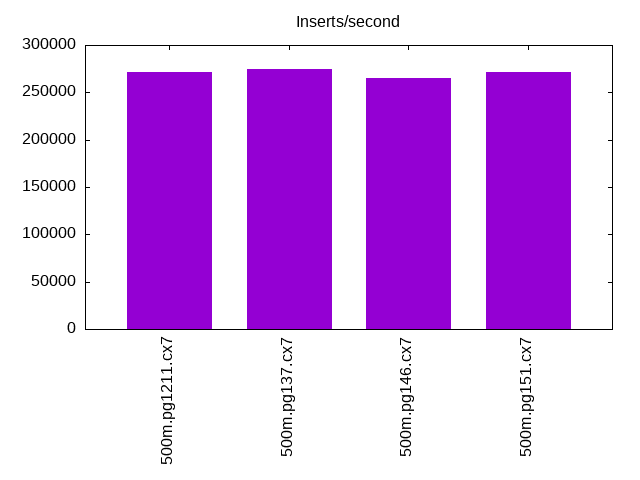
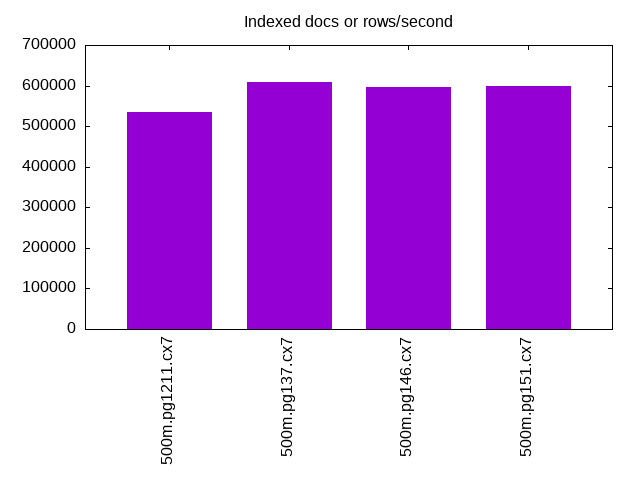
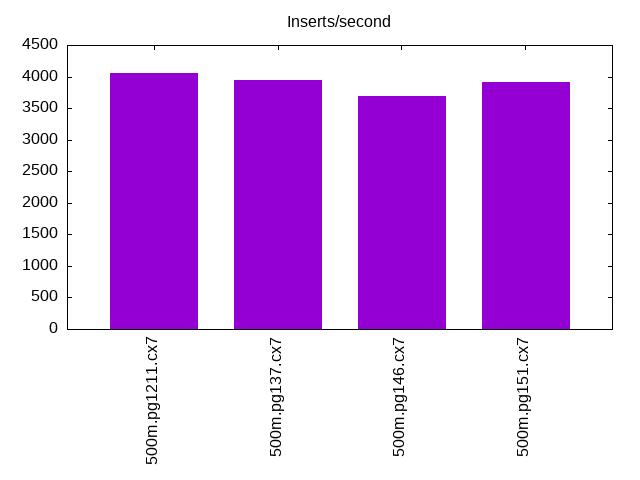
| 500m.pg1211.cx7 | 271739 | 534866 | 4063 | 40902 | 37754 | 13981 |
| 500m.pg137.cx7 | 275028 | 609878 | 3946 | 40901 | 37991 | 13974 |
| 500m.pg146.cx7 | 265252 | 596067 | 3691 | 39961 | 37908 | 10711 |
| 500m.pg151.cx7 | 271887 | 598206 | 3912 | 38615 | 37147 | 9913 |
This lists the average rate of inserts/s for the tests that do inserts concurrent with queries. For such tests the query rate is listed in the table above. The read+write tests are setup so that the insert rate should match the target rate every second. Cells that are not at least 95% of the target have a red background to indicate a failure to satisfy the target.
| dbms | q100.1 | q500.1 | q1000.1 |
|---|---|---|---|
| pg1211.cx7 | 399 | 1996 | 3599 |
| pg137.cx7 | 399 | 1994 | 3683 |
| pg146.cx7 | 399 | 1996 | 3562 |
| pg151.cx7 | 399 | 1996 | 3372 |
| target | 400 | 2000 | 4000 |
l.i0
l.i0: load without secondary indexes. Graphs for performance per 1-second interval are here.
Average throughput:
Insert response time histogram: each cell has the percentage of responses that take <= the time in the header and max is the max response time in seconds. For the max column values in the top 25% of the range have a red background and in the bottom 25% of the range have a green background. The red background is not used when the min value is within 80% of the max value.
| dbms | 256us | 1ms | 4ms | 16ms | 64ms | 256ms | 1s | 4s | 16s | gt | max |
|---|---|---|---|---|---|---|---|---|---|---|---|
| pg1211.cx7 | 99.911 | 0.087 | 0.001 | 0.001 | 0.211 | ||||||
| pg137.cx7 | 99.901 | 0.096 | 0.002 | 0.001 | nonzero | 0.310 | |||||
| pg146.cx7 | 99.880 | 0.114 | 0.002 | 0.002 | 0.001 | nonzero | 1.346 | ||||
| pg151.cx7 | 99.875 | 0.122 | 0.002 | 0.001 | nonzero | 0.316 |
Performance metrics for the DBMS listed above. Some are normalized by throughput, others are not. Legend for results is here.
ips	qps	rps	rmbps	wps	wmbps	rpq	rkbpq	wpi	wkbpi	csps	cpups	cspq	cpupq	dbgb1	dbgb2	rss	maxop	p50	p99	tag
271739	0	384	3.7	970.0	112.2	0.001	0.014	0.004	0.423	27548	79.6	0.101	23	47.8	69.5	0.0	0.211	68925	62331	500m.pg1211.cx7
275028	0	360	3.7	655.7	118.4	0.001	0.014	0.002	0.441	27820	79.6	0.101	23	47.8	72.3	3.7	0.310	69525	62133	500m.pg137.cx7
265252	0	325	2.6	771.8	119.7	0.001	0.010	0.003	0.462	26244	79.3	0.099	24	47.8	79.8	6.6	1.346	67726	42348	500m.pg146.cx7
271887	0	352	3.2	765.4	124.8	0.001	0.012	0.003	0.470	27190	79.9	0.100	24	47.8	80.4	0.0	0.316	69051	60135	500m.pg151.cx7
l.x
l.x: create secondary indexes.
Average throughput:
Performance metrics for the DBMS listed above. Some are normalized by throughput, others are not. Legend for results is here.
ips	qps	rps	rmbps	wps	wmbps	rpq	rkbpq	wpi	wkbpi	csps	cpups	cspq	cpupq	dbgb1	dbgb2	rss	maxop	p50	p99	tag
534866	0	1260	144.3	1906.8	223.7	0.002	0.276	0.004	0.428	3764	35.2	0.007	5	91.9	129.9	0.0	0.005	NA	NA	500m.pg1211.cx7
609878	0	1293	159.8	776.4	174.5	0.002	0.268	0.001	0.293	2920	37.0	0.005	5	91.9	116.4	0.0	0.021	NA	NA	500m.pg137.cx7
596067	0	1278	155.8	727.0	164.9	0.002	0.268	0.001	0.283	2731	35.5	0.005	5	91.9	123.9	0.0	0.004	NA	NA	500m.pg146.cx7
598206	0	1256	155.9	723.6	164.1	0.002	0.267	0.001	0.281	2974	35.0	0.005	5	91.9	124.5	0.0	0.004	NA	NA	500m.pg151.cx7
l.i1
l.i1: continue load after secondary indexes created. Graphs for performance per 1-second interval are here.
Average throughput:
Insert response time histogram: each cell has the percentage of responses that take <= the time in the header and max is the max response time in seconds. For the max column values in the top 25% of the range have a red background and in the bottom 25% of the range have a green background. The red background is not used when the min value is within 80% of the max value.
| dbms | 256us | 1ms | 4ms | 16ms | 64ms | 256ms | 1s | 4s | 16s | gt | max |
|---|---|---|---|---|---|---|---|---|---|---|---|
| pg1211.cx7 | 7.334 | 71.559 | 19.840 | 1.266 | 0.001 | 1.035 | |||||
| pg137.cx7 | 7.355 | 70.803 | 20.460 | 1.379 | 0.002 | 1.063 | |||||
| pg146.cx7 | 3.780 | 68.566 | 27.342 | 0.312 | 0.001 | 1.014 | |||||
| pg151.cx7 | 6.331 | 69.801 | 23.504 | 0.362 | 0.002 | 1.097 |
Performance metrics for the DBMS listed above. Some are normalized by throughput, others are not. Legend for results is here.
ips	qps	rps	rmbps	wps	wmbps	rpq	rkbpq	wpi	wkbpi	csps	cpups	cspq	cpupq	dbgb1	dbgb2	rss	maxop	p50	p99	tag
4063	0	6618	53.1	7038.9	111.6	1.629	13.374	1.732	28.122	15789	9.6	3.886	189	94.9	129.1	0.0	1.035	1049	150	500m.pg1211.cx7
3946	0	6468	52.7	7072.6	115.2	1.639	13.664	1.792	29.888	15602	9.6	3.954	195	94.9	125.3	0.0	1.063	949	150	500m.pg137.cx7
3691	0	6049	48.8	6438.3	102.2	1.639	13.534	1.744	28.339	14585	8.9	3.951	193	94.9	128.2	0.0	1.014	949	250	500m.pg146.cx7
3912	0	6351	51.0	6883.5	106.9	1.623	13.348	1.759	27.976	15292	9.3	3.909	190	94.9	128.5	0.0	1.097	1049	250	500m.pg151.cx7
q100.1
q100.1: range queries with 100 insert/s per client. Graphs for performance per 1-second interval are here.
Average throughput:
Query response time histogram: each cell has the percentage of responses that take <= the time in the header and max is the max response time in seconds. For max values in the top 25% of the range have a red background and in the bottom 25% of the range have a green background. The red background is not used when the min value is within 80% of the max value.
| dbms | 256us | 1ms | 4ms | 16ms | 64ms | 256ms | 1s | 4s | 16s | gt | max |
|---|---|---|---|---|---|---|---|---|---|---|---|
| pg1211.cx7 | 99.703 | 0.287 | 0.008 | 0.001 | nonzero | 0.054 | |||||
| pg137.cx7 | 99.735 | 0.250 | 0.012 | 0.003 | nonzero | nonzero | 0.072 | ||||
| pg146.cx7 | 99.662 | 0.314 | 0.014 | 0.008 | 0.001 | nonzero | 0.094 | ||||
| pg151.cx7 | 99.606 | 0.368 | 0.013 | 0.008 | 0.004 | nonzero | 0.120 |
Insert response time histogram: each cell has the percentage of responses that take <= the time in the header and max is the max response time in seconds. For max values in the top 25% of the range have a red background and in the bottom 25% of the range have a green background. The red background is not used when the min value is within 80% of the max value.
| dbms | 256us | 1ms | 4ms | 16ms | 64ms | 256ms | 1s | 4s | 16s | gt | max |
|---|---|---|---|---|---|---|---|---|---|---|---|
| pg1211.cx7 | 40.153 | 57.503 | 2.344 | 0.174 | |||||||
| pg137.cx7 | 49.948 | 48.618 | 1.434 | 0.226 | |||||||
| pg146.cx7 | 46.715 | 50.521 | 2.764 | 0.228 | |||||||
| pg151.cx7 | 23.799 | 67.997 | 8.125 | 0.076 | 0.003 | 1.025 |
Performance metrics for the DBMS listed above. Some are normalized by throughput, others are not. Legend for results is here.
ips	qps	rps	rmbps	wps	wmbps	rpq	rkbpq	wpi	wkbpi	csps	cpups	cspq	cpupq	dbgb1	dbgb2	rss	maxop	p50	p99	tag
399	40902	740	5.9	1051.6	16.5	0.018	0.149	2.634	42.250	157688	50.6	3.855	99	95.7	112.3	0.0	0.054	10469	5658	500m.pg1211.cx7
399	40901	760	6.1	1173.5	17.5	0.019	0.153	2.940	44.996	157706	50.6	3.856	99	95.7	107.7	0.0	0.072	10408	5358	500m.pg137.cx7
399	39961	751	6.0	1209.9	17.6	0.019	0.154	3.031	45.142	154084	50.2	3.856	100	95.7	110.4	0.0	0.094	10297	3820	500m.pg146.cx7
399	38615	752	6.0	1158.9	17.2	0.019	0.160	2.903	44.073	149096	50.0	3.861	104	95.7	110.3	0.0	0.120	9957	3021	500m.pg151.cx7
q500.1
q500.1: range queries with 500 insert/s per client. Graphs for performance per 1-second interval are here.
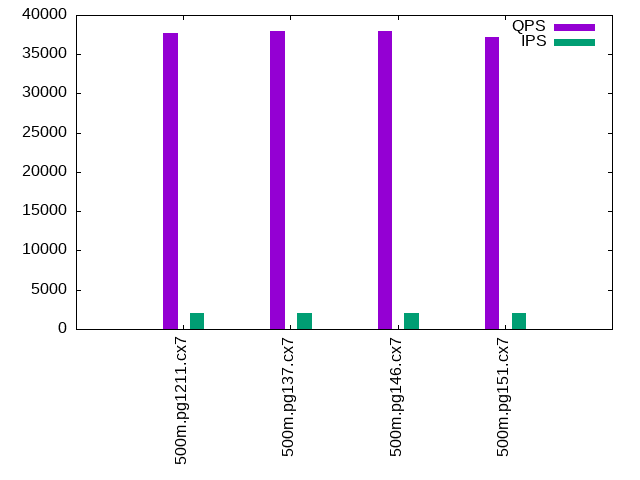
Average throughput:
Query response time histogram: each cell has the percentage of responses that take <= the time in the header and max is the max response time in seconds. For max values in the top 25% of the range have a red background and in the bottom 25% of the range have a green background. The red background is not used when the min value is within 80% of the max value.
| dbms | 256us | 1ms | 4ms | 16ms | 64ms | 256ms | 1s | 4s | 16s | gt | max |
|---|---|---|---|---|---|---|---|---|---|---|---|
| pg1211.cx7 | 99.645 | 0.318 | 0.032 | 0.004 | 0.001 | nonzero | 0.087 | ||||
| pg137.cx7 | 99.613 | 0.350 | 0.033 | 0.004 | 0.001 | nonzero | 0.151 | ||||
| pg146.cx7 | 99.478 | 0.484 | 0.033 | 0.005 | 0.001 | nonzero | 0.135 | ||||
| pg151.cx7 | 99.447 | 0.515 | 0.034 | 0.004 | 0.001 | nonzero | 0.120 |
Insert response time histogram: each cell has the percentage of responses that take <= the time in the header and max is the max response time in seconds. For max values in the top 25% of the range have a red background and in the bottom 25% of the range have a green background. The red background is not used when the min value is within 80% of the max value.
| dbms | 256us | 1ms | 4ms | 16ms | 64ms | 256ms | 1s | 4s | 16s | gt | max |
|---|---|---|---|---|---|---|---|---|---|---|---|
| pg1211.cx7 | 44.830 | 47.317 | 7.832 | 0.022 | 0.492 | ||||||
| pg137.cx7 | 40.636 | 50.832 | 8.460 | 0.072 | 0.420 | ||||||
| pg146.cx7 | 19.394 | 66.900 | 13.672 | 0.034 | 0.383 | ||||||
| pg151.cx7 | 22.477 | 70.146 | 7.376 | 0.001 | 0.257 |
Performance metrics for the DBMS listed above. Some are normalized by throughput, others are not. Legend for results is here.
ips	qps	rps	rmbps	wps	wmbps	rpq	rkbpq	wpi	wkbpi	csps	cpups	cspq	cpupq	dbgb1	dbgb2	rss	maxop	p50	p99	tag
1996	37754	2944	23.3	4437.1	65.7	0.078	0.632	2.223	33.704	147821	53.1	3.915	113	96.7	111.4	0.0	0.087	9478	8503	500m.pg1211.cx7
1994	37991	2971	23.5	4465.9	66.5	0.078	0.635	2.240	34.169	148681	53.1	3.914	112	96.7	110.6	0.0	0.151	9529	8503	500m.pg137.cx7
1996	37908	2966	23.5	4367.6	65.5	0.078	0.635	2.188	33.616	148399	53.1	3.915	112	96.7	113.7	0.0	0.135	9462	8423	500m.pg146.cx7
1996	37147	2966	23.5	4373.1	65.5	0.080	0.648	2.191	33.590	145467	53.1	3.916	114	96.7	113.8	0.0	0.120	9321	8295	500m.pg151.cx7
q1000.1
q1000.1: range queries with 1000 insert/s per client. Graphs for performance per 1-second interval are here.
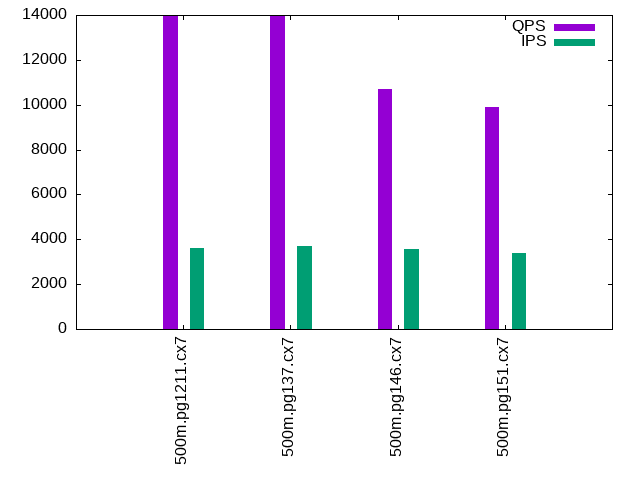
Average throughput:
Query response time histogram: each cell has the percentage of responses that take <= the time in the header and max is the max response time in seconds. For max values in the top 25% of the range have a red background and in the bottom 25% of the range have a green background. The red background is not used when the min value is within 80% of the max value.
| dbms | 256us | 1ms | 4ms | 16ms | 64ms | 256ms | 1s | 4s | 16s | gt | max |
|---|---|---|---|---|---|---|---|---|---|---|---|
| pg1211.cx7 | 87.293 | 10.821 | 0.953 | 0.793 | 0.136 | 0.005 | 0.218 | ||||
| pg137.cx7 | 86.774 | 11.258 | 1.040 | 0.804 | 0.120 | 0.005 | 0.190 | ||||
| pg146.cx7 | 80.645 | 16.569 | 1.389 | 1.164 | 0.221 | 0.011 | 0.211 | ||||
| pg151.cx7 | 79.887 | 17.158 | 1.401 | 1.238 | 0.305 | 0.011 | 0.218 |
Insert response time histogram: each cell has the percentage of responses that take <= the time in the header and max is the max response time in seconds. For max values in the top 25% of the range have a red background and in the bottom 25% of the range have a green background. The red background is not used when the min value is within 80% of the max value.
| dbms | 256us | 1ms | 4ms | 16ms | 64ms | 256ms | 1s | 4s | 16s | gt | max |
|---|---|---|---|---|---|---|---|---|---|---|---|
| pg1211.cx7 | 17.787 | 67.959 | 13.945 | 0.309 | 0.691 | ||||||
| pg137.cx7 | 20.092 | 66.543 | 13.168 | 0.197 | 0.507 | ||||||
| pg146.cx7 | 13.073 | 68.040 | 18.774 | 0.113 | 0.510 | ||||||
| pg151.cx7 | 11.138 | 64.710 | 24.020 | 0.132 | 0.461 |
Performance metrics for the DBMS listed above. Some are normalized by throughput, others are not. Legend for results is here.
ips	qps	rps	rmbps	wps	wmbps	rpq	rkbpq	wpi	wkbpi	csps	cpups	cspq	cpupq	dbgb1	dbgb2	rss	maxop	p50	p99	tag
3599	13981	6525	52.4	6840.6	104.4	0.467	3.835	1.901	29.707	64616	36.1	4.622	207	98.2	120.8	0.0	0.218	3485	863	500m.pg1211.cx7
3683	13974	6796	54.5	7066.1	107.1	0.486	3.996	1.919	29.767	65135	36.6	4.661	210	98.2	121.0	0.0	0.190	3452	895	500m.pg137.cx7
3562	10711	6528	52.4	6696.8	102.4	0.610	5.005	1.880	29.429	52552	33.1	4.907	247	98.2	125.6	0.0	0.211	2621	879	500m.pg146.cx7
3372	9913	6168	49.4	6342.9	97.8	0.622	5.107	1.881	29.701	48935	31.3	4.936	253	98.2	125.4	0.0	0.218	2430	799	500m.pg151.cx7
l.i0
l.i0: load without secondary indexes
Performance metrics for all DBMS, not just the ones listed above. Some are normalized by throughput, others are not. Legend for results is here.
ips	qps	rps	rmbps	wps	wmbps	rpq	rkbpq	wpi	wkbpi	csps	cpups	cspq	cpupq	dbgb1	dbgb2	rss	maxop	p50	p99	tag
271739	0	384	3.7	970.0	112.2	0.001	0.014	0.004	0.423	27548	79.6	0.101	23	47.8	69.5	0.0	0.211	68925	62331	500m.pg1211.cx7
275028	0	360	3.7	655.7	118.4	0.001	0.014	0.002	0.441	27820	79.6	0.101	23	47.8	72.3	3.7	0.310	69525	62133	500m.pg137.cx7
265252	0	325	2.6	771.8	119.7	0.001	0.010	0.003	0.462	26244	79.3	0.099	24	47.8	79.8	6.6	1.346	67726	42348	500m.pg146.cx7
271887	0	352	3.2	765.4	124.8	0.001	0.012	0.003	0.470	27190	79.9	0.100	24	47.8	80.4	0.0	0.316	69051	60135	500m.pg151.cx7
l.x
l.x: create secondary indexes
Performance metrics for all DBMS, not just the ones listed above. Some are normalized by throughput, others are not. Legend for results is here.
ips	qps	rps	rmbps	wps	wmbps	rpq	rkbpq	wpi	wkbpi	csps	cpups	cspq	cpupq	dbgb1	dbgb2	rss	maxop	p50	p99	tag
534866	0	1260	144.3	1906.8	223.7	0.002	0.276	0.004	0.428	3764	35.2	0.007	5	91.9	129.9	0.0	0.005	NA	NA	500m.pg1211.cx7
609878	0	1293	159.8	776.4	174.5	0.002	0.268	0.001	0.293	2920	37.0	0.005	5	91.9	116.4	0.0	0.021	NA	NA	500m.pg137.cx7
596067	0	1278	155.8	727.0	164.9	0.002	0.268	0.001	0.283	2731	35.5	0.005	5	91.9	123.9	0.0	0.004	NA	NA	500m.pg146.cx7
598206	0	1256	155.9	723.6	164.1	0.002	0.267	0.001	0.281	2974	35.0	0.005	5	91.9	124.5	0.0	0.004	NA	NA	500m.pg151.cx7
l.i1
l.i1: continue load after secondary indexes created
Performance metrics for all DBMS, not just the ones listed above. Some are normalized by throughput, others are not. Legend for results is here.
ips	qps	rps	rmbps	wps	wmbps	rpq	rkbpq	wpi	wkbpi	csps	cpups	cspq	cpupq	dbgb1	dbgb2	rss	maxop	p50	p99	tag
4063	0	6618	53.1	7038.9	111.6	1.629	13.374	1.732	28.122	15789	9.6	3.886	189	94.9	129.1	0.0	1.035	1049	150	500m.pg1211.cx7
3946	0	6468	52.7	7072.6	115.2	1.639	13.664	1.792	29.888	15602	9.6	3.954	195	94.9	125.3	0.0	1.063	949	150	500m.pg137.cx7
3691	0	6049	48.8	6438.3	102.2	1.639	13.534	1.744	28.339	14585	8.9	3.951	193	94.9	128.2	0.0	1.014	949	250	500m.pg146.cx7
3912	0	6351	51.0	6883.5	106.9	1.623	13.348	1.759	27.976	15292	9.3	3.909	190	94.9	128.5	0.0	1.097	1049	250	500m.pg151.cx7
q100.1
q100.1: range queries with 100 insert/s per client
Performance metrics for all DBMS, not just the ones listed above. Some are normalized by throughput, others are not. Legend for results is here.
ips	qps	rps	rmbps	wps	wmbps	rpq	rkbpq	wpi	wkbpi	csps	cpups	cspq	cpupq	dbgb1	dbgb2	rss	maxop	p50	p99	tag
399	40902	740	5.9	1051.6	16.5	0.018	0.149	2.634	42.250	157688	50.6	3.855	99	95.7	112.3	0.0	0.054	10469	5658	500m.pg1211.cx7
399	40901	760	6.1	1173.5	17.5	0.019	0.153	2.940	44.996	157706	50.6	3.856	99	95.7	107.7	0.0	0.072	10408	5358	500m.pg137.cx7
399	39961	751	6.0	1209.9	17.6	0.019	0.154	3.031	45.142	154084	50.2	3.856	100	95.7	110.4	0.0	0.094	10297	3820	500m.pg146.cx7
399	38615	752	6.0	1158.9	17.2	0.019	0.160	2.903	44.073	149096	50.0	3.861	104	95.7	110.3	0.0	0.120	9957	3021	500m.pg151.cx7
q500.1
q500.1: range queries with 500 insert/s per client
Performance metrics for all DBMS, not just the ones listed above. Some are normalized by throughput, others are not. Legend for results is here.
ips	qps	rps	rmbps	wps	wmbps	rpq	rkbpq	wpi	wkbpi	csps	cpups	cspq	cpupq	dbgb1	dbgb2	rss	maxop	p50	p99	tag
1996	37754	2944	23.3	4437.1	65.7	0.078	0.632	2.223	33.704	147821	53.1	3.915	113	96.7	111.4	0.0	0.087	9478	8503	500m.pg1211.cx7
1994	37991	2971	23.5	4465.9	66.5	0.078	0.635	2.240	34.169	148681	53.1	3.914	112	96.7	110.6	0.0	0.151	9529	8503	500m.pg137.cx7
1996	37908	2966	23.5	4367.6	65.5	0.078	0.635	2.188	33.616	148399	53.1	3.915	112	96.7	113.7	0.0	0.135	9462	8423	500m.pg146.cx7
1996	37147	2966	23.5	4373.1	65.5	0.080	0.648	2.191	33.590	145467	53.1	3.916	114	96.7	113.8	0.0	0.120	9321	8295	500m.pg151.cx7
q1000.1
q1000.1: range queries with 1000 insert/s per client
Performance metrics for all DBMS, not just the ones listed above. Some are normalized by throughput, others are not. Legend for results is here.
ips	qps	rps	rmbps	wps	wmbps	rpq	rkbpq	wpi	wkbpi	csps	cpups	cspq	cpupq	dbgb1	dbgb2	rss	maxop	p50	p99	tag
3599	13981	6525	52.4	6840.6	104.4	0.467	3.835	1.901	29.707	64616	36.1	4.622	207	98.2	120.8	0.0	0.218	3485	863	500m.pg1211.cx7
3683	13974	6796	54.5	7066.1	107.1	0.486	3.996	1.919	29.767	65135	36.6	4.661	210	98.2	121.0	0.0	0.190	3452	895	500m.pg137.cx7
3562	10711	6528	52.4	6696.8	102.4	0.610	5.005	1.880	29.429	52552	33.1	4.907	247	98.2	125.6	0.0	0.211	2621	879	500m.pg146.cx7
3372	9913	6168	49.4	6342.9	97.8	0.622	5.107	1.881	29.701	48935	31.3	4.936	253	98.2	125.4	0.0	0.218	2430	799	500m.pg151.cx7
l.i0
- l.i0: load without secondary indexes
- Legend for results is here.
- Each entry lists the percentage of responses that fit in that bucket (slower than max time for previous bucket, faster than min time for next bucket).
Insert response time histogram
256us	1ms	4ms	16ms	64ms	256ms	1s	4s	16s	gt	max	tag
0.000	0.000	99.911	0.087	0.001	0.001	0.000	0.000	0.000	0.000	0.211	pg1211.cx7
0.000	0.000	99.901	0.096	0.002	0.001	nonzero	0.000	0.000	0.000	0.310	pg137.cx7
0.000	0.000	99.880	0.114	0.002	0.002	0.001	nonzero	0.000	0.000	1.346	pg146.cx7
0.000	0.000	99.875	0.122	0.002	0.001	nonzero	0.000	0.000	0.000	0.316	pg151.cx7
l.x
- l.x: create secondary indexes
- Legend for results is here.
- Each entry lists the percentage of responses that fit in that bucket (slower than max time for previous bucket, faster than min time for next bucket).
TODO - determine whether there is data for create index response time
l.i1
- l.i1: continue load after secondary indexes created
- Legend for results is here.
- Each entry lists the percentage of responses that fit in that bucket (slower than max time for previous bucket, faster than min time for next bucket).
Insert response time histogram
256us	1ms	4ms	16ms	64ms	256ms	1s	4s	16s	gt	max	tag
0.000	0.000	0.000	7.334	71.559	19.840	1.266	0.001	0.000	0.000	1.035	pg1211.cx7
0.000	0.000	0.000	7.355	70.803	20.460	1.379	0.002	0.000	0.000	1.063	pg137.cx7
0.000	0.000	0.000	3.780	68.566	27.342	0.312	0.001	0.000	0.000	1.014	pg146.cx7
0.000	0.000	0.000	6.331	69.801	23.504	0.362	0.002	0.000	0.000	1.097	pg151.cx7
q100.1
- q100.1: range queries with 100 insert/s per client
- Legend for results is here.
- Each entry lists the percentage of responses that fit in that bucket (slower than max time for previous bucket, faster than min time for next bucket).
Query response time histogram
256us	1ms	4ms	16ms	64ms	256ms	1s	4s	16s	gt	max	tag
99.703	0.287	0.008	0.001	nonzero	0.000	0.000	0.000	0.000	0.000	0.054	pg1211.cx7
99.735	0.250	0.012	0.003	nonzero	nonzero	0.000	0.000	0.000	0.000	0.072	pg137.cx7
99.662	0.314	0.014	0.008	0.001	nonzero	0.000	0.000	0.000	0.000	0.094	pg146.cx7
99.606	0.368	0.013	0.008	0.004	nonzero	0.000	0.000	0.000	0.000	0.120	pg151.cx7
Insert response time histogram
256us	1ms	4ms	16ms	64ms	256ms	1s	4s	16s	gt	max	tag
0.000	0.000	0.000	40.153	57.503	2.344	0.000	0.000	0.000	0.000	0.174	pg1211.cx7
0.000	0.000	0.000	49.948	48.618	1.434	0.000	0.000	0.000	0.000	0.226	pg137.cx7
0.000	0.000	0.000	46.715	50.521	2.764	0.000	0.000	0.000	0.000	0.228	pg146.cx7
0.000	0.000	0.000	23.799	67.997	8.125	0.076	0.003	0.000	0.000	1.025	pg151.cx7
q500.1
- q500.1: range queries with 500 insert/s per client
- Legend for results is here.
- Each entry lists the percentage of responses that fit in that bucket (slower than max time for previous bucket, faster than min time for next bucket).
Query response time histogram
256us	1ms	4ms	16ms	64ms	256ms	1s	4s	16s	gt	max	tag
99.645	0.318	0.032	0.004	0.001	nonzero	0.000	0.000	0.000	0.000	0.087	pg1211.cx7
99.613	0.350	0.033	0.004	0.001	nonzero	0.000	0.000	0.000	0.000	0.151	pg137.cx7
99.478	0.484	0.033	0.005	0.001	nonzero	0.000	0.000	0.000	0.000	0.135	pg146.cx7
99.447	0.515	0.034	0.004	0.001	nonzero	0.000	0.000	0.000	0.000	0.120	pg151.cx7
Insert response time histogram
256us	1ms	4ms	16ms	64ms	256ms	1s	4s	16s	gt	max	tag
0.000	0.000	0.000	44.830	47.317	7.832	0.022	0.000	0.000	0.000	0.492	pg1211.cx7
0.000	0.000	0.000	40.636	50.832	8.460	0.072	0.000	0.000	0.000	0.420	pg137.cx7
0.000	0.000	0.000	19.394	66.900	13.672	0.034	0.000	0.000	0.000	0.383	pg146.cx7
0.000	0.000	0.000	22.477	70.146	7.376	0.001	0.000	0.000	0.000	0.257	pg151.cx7
q1000.1
- q1000.1: range queries with 1000 insert/s per client
- Legend for results is here.
- Each entry lists the percentage of responses that fit in that bucket (slower than max time for previous bucket, faster than min time for next bucket).
Query response time histogram
256us	1ms	4ms	16ms	64ms	256ms	1s	4s	16s	gt	max	tag
87.293	10.821	0.953	0.793	0.136	0.005	0.000	0.000	0.000	0.000	0.218	pg1211.cx7
86.774	11.258	1.040	0.804	0.120	0.005	0.000	0.000	0.000	0.000	0.190	pg137.cx7
80.645	16.569	1.389	1.164	0.221	0.011	0.000	0.000	0.000	0.000	0.211	pg146.cx7
79.887	17.158	1.401	1.238	0.305	0.011	0.000	0.000	0.000	0.000	0.218	pg151.cx7
Insert response time histogram
256us	1ms	4ms	16ms	64ms	256ms	1s	4s	16s	gt	max	tag
0.000	0.000	0.000	17.787	67.959	13.945	0.309	0.000	0.000	0.000	0.691	pg1211.cx7
0.000	0.000	0.000	20.092	66.543	13.168	0.197	0.000	0.000	0.000	0.507	pg137.cx7
0.000	0.000	0.000	13.073	68.040	18.774	0.113	0.000	0.000	0.000	0.510	pg146.cx7
0.000	0.000	0.000	11.138	64.710	24.020	0.132	0.000	0.000	0.000	0.461	pg151.cx7