Introduction
This is a report for the insert benchmark with 500M docs and 3 client(s). It is generated by scripts (bash, awk, sed) and Tufte might not be impressed. An overview of the insert benchmark is here and a short update is here. Below, by DBMS, I mean DBMS+version.config. An example is my8020.c10b40 where my means MySQL, 8020 is version 8.0.20 and c10b40 is the name for the configuration file.
The test server has 8 AMD cores, 16G RAM and an NVMe SSD. It is described here as the Beelink. The benchmark was run with 3 clients and there were 1 or 2 connections per client (1 for queries, 1 for inserts). The benchmark loads 500M rows without secondary indexes, creates secondary indexes, loads another 10M rows then does 3 read+write tests for one hour each that do queries as fast as possible with 100, 500 and then 1000 writes/second/client concurrent with the queries. The database doesn't fit in memory and parts of the benchmark are IO-bound. Clients and the DBMS share one server. The per-database configs are in the per-database subdirectories here.
The tested DBMS are:
- pg1211.cx7 - Postgres 12.11 and the cx7 config
- pg137.cx7 - Postgres 13.7 and the cx7 config
- pg146.cx7 - Postgres 14.6 and the cx7 config
- pg151.cx7 - Postgres 15.1 and the cx7 config
Contents
- Summary
- l.i0: load without secondary indexes
- l.x: create secondary indexes
- l.i1: continue load after secondary indexes created
- q100.1: range queries with 100 insert/s per client
- q500.1: range queries with 500 insert/s per client
- q1000.1: range queries with 1000 insert/s per client
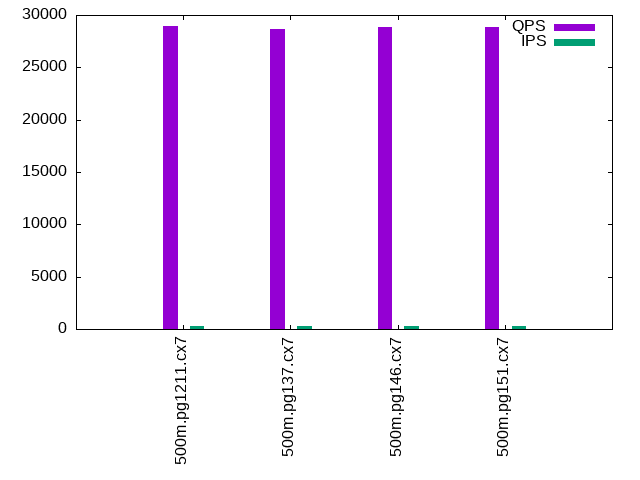
Summary
The numbers are inserts/s for l.i0 and l.i1, indexed docs (or rows) /s for l.x and queries/s for q*.2. The values are the average rate over the entire test for inserts (IPS) and queries (QPS). The range of values for IPS and QPS is split into 3 parts: bottom 25%, middle 50%, top 25%. Values in the bottom 25% have a red background, values in the top 25% have a green background and values in the middle have no color. A gray background is used for values that can be ignored because the DBMS did not sustain the target insert rate. Red backgrounds are not used when the minimum value is within 80% of the max value.
| dbms | l.i0 | l.x | l.i1 | q100.1 | q500.1 | q1000.1 |
|---|---|---|---|---|---|---|
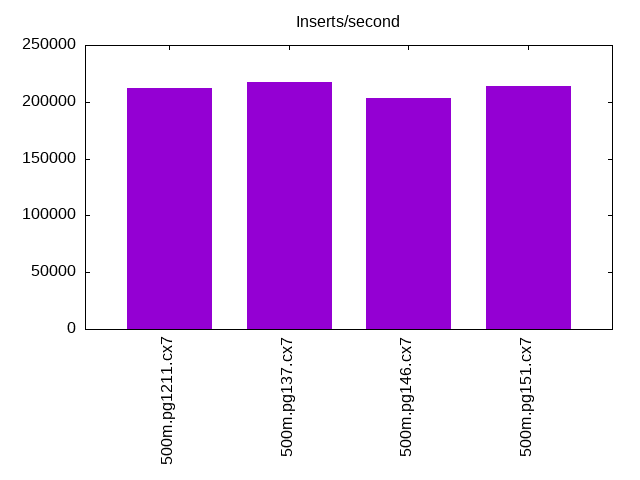
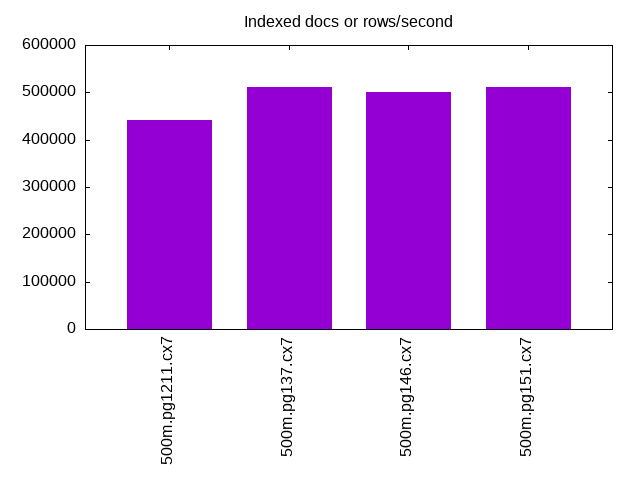
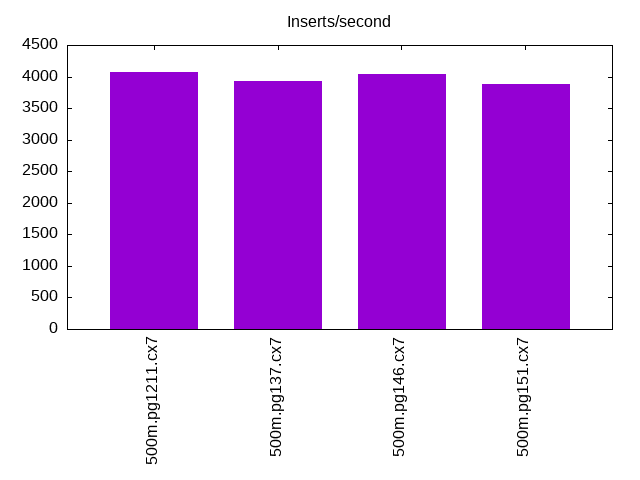
| 500m.pg1211.cx7 | 212404 | 442566 | 4075 | 28940 | 28913 | 28372 |
| 500m.pg137.cx7 | 217297 | 511873 | 3932 | 28642 | 28363 | 28612 |
| 500m.pg146.cx7 | 203252 | 501102 | 4045 | 28877 | 28808 | 28323 |
| 500m.pg151.cx7 | 213493 | 511873 | 3885 | 28833 | 29078 | 28484 |
This lists the average rate of inserts/s for the tests that do inserts concurrent with queries. For such tests the query rate is listed in the table above. The read+write tests are setup so that the insert rate should match the target rate every second. Cells that are not at least 95% of the target have a red background to indicate a failure to satisfy the target.
| dbms | q100.1 | q500.1 | q1000.1 |
|---|---|---|---|
| pg1211.cx7 | 299 | 1498 | 2894 |
| pg137.cx7 | 300 | 1498 | 2892 |
| pg146.cx7 | 300 | 1498 | 2937 |
| pg151.cx7 | 300 | 1498 | 2927 |
| target | 300 | 1500 | 3000 |
l.i0
l.i0: load without secondary indexes. Graphs for performance per 1-second interval are here.
Average throughput:
Insert response time histogram: each cell has the percentage of responses that take <= the time in the header and max is the max response time in seconds. For the max column values in the top 25% of the range have a red background and in the bottom 25% of the range have a green background. The red background is not used when the min value is within 80% of the max value.
| dbms | 256us | 1ms | 4ms | 16ms | 64ms | 256ms | 1s | 4s | 16s | gt | max |
|---|---|---|---|---|---|---|---|---|---|---|---|
| pg1211.cx7 | 99.988 | 0.011 | nonzero | 0.001 | 0.189 | ||||||
| pg137.cx7 | 99.984 | 0.015 | 0.001 | 0.001 | 0.190 | ||||||
| pg146.cx7 | 99.983 | 0.016 | 0.001 | 0.001 | 0.118 | ||||||
| pg151.cx7 | 99.982 | 0.016 | 0.001 | 0.001 | nonzero | 0.900 |
Performance metrics for the DBMS listed above. Some are normalized by throughput, others are not. Legend for results is here.
ips	qps	rps	rmbps	wps	wmbps	rpq	rkbpq	wpi	wkbpi	csps	cpups	cspq	cpupq	dbgb1	dbgb2	rss	maxop	p50	p99	tag
212404	0	246	2.2	705.4	85.9	0.001	0.011	0.003	0.414	22950	62.3	0.108	23	47.8	64.6	0.0	0.189	71322	68723	500m.pg1211.cx7
217297	0	234	2.3	501.3	95.1	0.001	0.011	0.002	0.448	23492	62.6	0.108	23	47.8	68.1	5.5	0.190	72946	70024	500m.pg137.cx7
203252	0	209	1.8	480.8	89.9	0.001	0.009	0.002	0.453	21773	62.8	0.107	25	47.8	74.0	5.6	0.118	68426	65827	500m.pg146.cx7
213493	0	221	1.8	526.4	95.4	0.001	0.009	0.002	0.457	22550	63.4	0.106	24	47.8	74.7	0.0	0.900	71722	67426	500m.pg151.cx7
l.x
l.x: create secondary indexes.
Average throughput:
Performance metrics for the DBMS listed above. Some are normalized by throughput, others are not. Legend for results is here.
ips	qps	rps	rmbps	wps	wmbps	rpq	rkbpq	wpi	wkbpi	csps	cpups	cspq	cpupq	dbgb1	dbgb2	rss	maxop	p50	p99	tag
442566	0	1033	119.3	1557.0	189.8	0.002	0.276	0.004	0.439	2077	29.2	0.005	5	91.9	127.1	0.0	0.007	NA	NA	500m.pg1211.cx7
511873	0	1080	133.7	632.8	141.9	0.002	0.268	0.001	0.284	1704	30.9	0.003	5	91.9	112.2	0.0	0.004	NA	NA	500m.pg137.cx7
501102	0	1057	131.1	610.0	138.3	0.002	0.268	0.001	0.283	1660	29.9	0.003	5	91.9	118.0	0.0	0.005	NA	NA	500m.pg146.cx7
511873	0	1083	133.8	604.6	137.5	0.002	0.268	0.001	0.275	1785	29.6	0.003	5	91.9	119.1	0.0	0.004	NA	NA	500m.pg151.cx7
l.i1
l.i1: continue load after secondary indexes created. Graphs for performance per 1-second interval are here.
Average throughput:
Insert response time histogram: each cell has the percentage of responses that take <= the time in the header and max is the max response time in seconds. For the max column values in the top 25% of the range have a red background and in the bottom 25% of the range have a green background. The red background is not used when the min value is within 80% of the max value.
| dbms | 256us | 1ms | 4ms | 16ms | 64ms | 256ms | 1s | 4s | 16s | gt | max |
|---|---|---|---|---|---|---|---|---|---|---|---|
| pg1211.cx7 | 26.473 | 61.073 | 12.038 | 0.414 | 0.001 | 1.329 | |||||
| pg137.cx7 | 25.783 | 60.915 | 12.824 | 0.474 | 0.002 | 1.136 | |||||
| pg146.cx7 | 27.061 | 59.512 | 13.245 | 0.181 | 0.935 | ||||||
| pg151.cx7 | 24.283 | 60.645 | 14.862 | 0.209 | 0.902 |
Performance metrics for the DBMS listed above. Some are normalized by throughput, others are not. Legend for results is here.
ips	qps	rps	rmbps	wps	wmbps	rpq	rkbpq	wpi	wkbpi	csps	cpups	cspq	cpupq	dbgb1	dbgb2	rss	maxop	p50	p99	tag
4075	0	6118	48.9	6670.6	106.1	1.501	12.292	1.637	26.668	14611	9.1	3.586	179	95.1	128.0	0.0	1.329	1398	200	500m.pg1211.cx7
3932	0	5979	47.8	6573.2	108.8	1.520	12.444	1.672	28.340	14450	9.0	3.675	183	95.1	122.3	0.0	1.136	1299	150	500m.pg137.cx7
4045	0	6089	48.7	6593.2	107.6	1.505	12.323	1.630	27.232	14724	9.1	3.640	180	95.1	129.8	0.0	0.935	1448	400	500m.pg146.cx7
3885	0	5827	46.6	6424.7	104.1	1.500	12.284	1.654	27.426	14147	8.6	3.641	177	95.1	129.5	0.0	0.902	1348	350	500m.pg151.cx7
q100.1
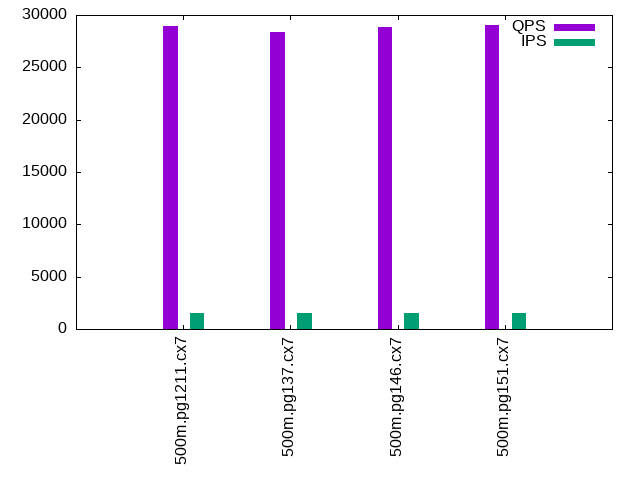
q100.1: range queries with 100 insert/s per client. Graphs for performance per 1-second interval are here.
Average throughput:
Query response time histogram: each cell has the percentage of responses that take <= the time in the header and max is the max response time in seconds. For max values in the top 25% of the range have a red background and in the bottom 25% of the range have a green background. The red background is not used when the min value is within 80% of the max value.
| dbms | 256us | 1ms | 4ms | 16ms | 64ms | 256ms | 1s | 4s | 16s | gt | max |
|---|---|---|---|---|---|---|---|---|---|---|---|
| pg1211.cx7 | 99.737 | 0.258 | 0.004 | 0.001 | nonzero | 0.040 | |||||
| pg137.cx7 | 99.721 | 0.267 | 0.007 | 0.004 | 0.001 | nonzero | 0.105 | ||||
| pg146.cx7 | 99.704 | 0.281 | 0.010 | 0.005 | nonzero | nonzero | 0.073 | ||||
| pg151.cx7 | 99.712 | 0.272 | 0.009 | 0.006 | 0.001 | nonzero | 0.102 |
Insert response time histogram: each cell has the percentage of responses that take <= the time in the header and max is the max response time in seconds. For max values in the top 25% of the range have a red background and in the bottom 25% of the range have a green background. The red background is not used when the min value is within 80% of the max value.
| dbms | 256us | 1ms | 4ms | 16ms | 64ms | 256ms | 1s | 4s | 16s | gt | max |
|---|---|---|---|---|---|---|---|---|---|---|---|
| pg1211.cx7 | 59.681 | 39.602 | 0.718 | 0.106 | |||||||
| pg137.cx7 | 81.704 | 17.889 | 0.380 | 0.028 | 0.837 | ||||||
| pg146.cx7 | 75.356 | 24.125 | 0.519 | 0.147 | |||||||
| pg151.cx7 | 77.764 | 21.486 | 0.736 | 0.014 | 0.396 |
Performance metrics for the DBMS listed above. Some are normalized by throughput, others are not. Legend for results is here.
ips	qps	rps	rmbps	wps	wmbps	rpq	rkbpq	wpi	wkbpi	csps	cpups	cspq	cpupq	dbgb1	dbgb2	rss	maxop	p50	p99	tag
299	28940	496	3.9	770.1	11.7	0.017	0.139	2.572	40.072	112086	38.9	3.873	108	95.2	113.4	0.0	0.040	10117	6425	500m.pg1211.cx7
300	28642	508	4.0	911.2	12.8	0.018	0.144	3.043	43.901	110948	38.6	3.874	108	95.2	105.2	0.0	0.105	10149	4443	500m.pg137.cx7
300	28877	508	4.0	927.1	13.1	0.018	0.143	3.095	44.633	111765	38.2	3.870	106	95.2	112.9	0.0	0.073	10325	4235	500m.pg146.cx7
300	28833	508	4.0	933.2	13.0	0.018	0.144	3.116	44.414	111530	38.1	3.868	106	95.2	113.3	0.0	0.102	10388	4093	500m.pg151.cx7
q500.1
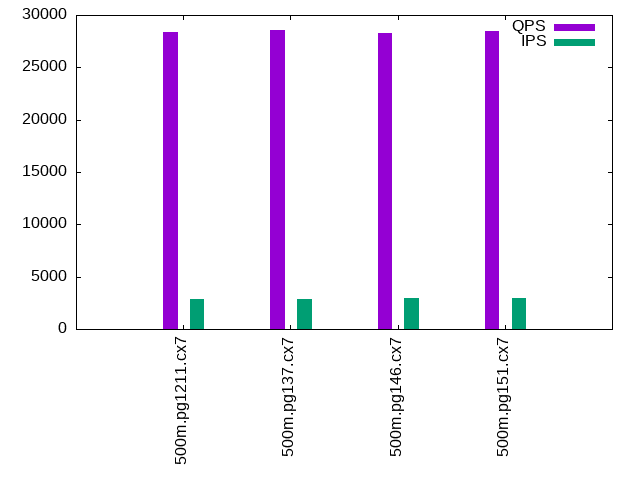
q500.1: range queries with 500 insert/s per client. Graphs for performance per 1-second interval are here.
Average throughput:
Query response time histogram: each cell has the percentage of responses that take <= the time in the header and max is the max response time in seconds. For max values in the top 25% of the range have a red background and in the bottom 25% of the range have a green background. The red background is not used when the min value is within 80% of the max value.
| dbms | 256us | 1ms | 4ms | 16ms | 64ms | 256ms | 1s | 4s | 16s | gt | max |
|---|---|---|---|---|---|---|---|---|---|---|---|
| pg1211.cx7 | 99.833 | 0.155 | 0.011 | 0.001 | nonzero | 0.050 | |||||
| pg137.cx7 | 99.823 | 0.165 | 0.011 | 0.001 | nonzero | nonzero | 0.098 | ||||
| pg146.cx7 | 99.792 | 0.196 | 0.011 | 0.001 | nonzero | 0.063 | |||||
| pg151.cx7 | 99.809 | 0.179 | 0.011 | 0.001 | nonzero | 0.060 |
Insert response time histogram: each cell has the percentage of responses that take <= the time in the header and max is the max response time in seconds. For max values in the top 25% of the range have a red background and in the bottom 25% of the range have a green background. The red background is not used when the min value is within 80% of the max value.
| dbms | 256us | 1ms | 4ms | 16ms | 64ms | 256ms | 1s | 4s | 16s | gt | max |
|---|---|---|---|---|---|---|---|---|---|---|---|
| pg1211.cx7 | 36.779 | 56.373 | 6.840 | 0.008 | 0.377 | ||||||
| pg137.cx7 | 43.200 | 52.026 | 4.744 | 0.030 | 0.460 | ||||||
| pg146.cx7 | 38.659 | 54.424 | 6.916 | 0.001 | 0.256 | ||||||
| pg151.cx7 | 43.419 | 51.202 | 5.366 | 0.013 | 0.370 |
Performance metrics for the DBMS listed above. Some are normalized by throughput, others are not. Legend for results is here.
ips	qps	rps	rmbps	wps	wmbps	rpq	rkbpq	wpi	wkbpi	csps	cpups	cspq	cpupq	dbgb1	dbgb2	rss	maxop	p50	p99	tag
1498	28913	2094	16.6	3165.4	49.1	0.072	0.587	2.114	33.548	115121	40.9	3.982	113	95.8	108.0	0.0	0.050	9941	7963	500m.pg1211.cx7
1498	28363	2106	16.7	3189.8	49.4	0.074	0.603	2.130	33.810	113030	40.9	3.985	115	95.8	106.6	0.0	0.098	9861	7820	500m.pg137.cx7
1498	28808	2107	16.7	3119.8	48.2	0.073	0.593	2.083	32.934	114650	40.6	3.980	113	95.8	109.0	0.0	0.063	9957	7851	500m.pg146.cx7
1498	29078	2121	16.8	3104.2	48.1	0.073	0.592	2.072	32.872	115537	40.6	3.973	112	95.8	109.0	0.0	0.060	10053	7847	500m.pg151.cx7
q1000.1
q1000.1: range queries with 1000 insert/s per client. Graphs for performance per 1-second interval are here.
Average throughput:
Query response time histogram: each cell has the percentage of responses that take <= the time in the header and max is the max response time in seconds. For max values in the top 25% of the range have a red background and in the bottom 25% of the range have a green background. The red background is not used when the min value is within 80% of the max value.
| dbms | 256us | 1ms | 4ms | 16ms | 64ms | 256ms | 1s | 4s | 16s | gt | max |
|---|---|---|---|---|---|---|---|---|---|---|---|
| pg1211.cx7 | 99.684 | 0.292 | 0.020 | 0.003 | 0.001 | nonzero | 0.144 | ||||
| pg137.cx7 | 99.701 | 0.277 | 0.020 | 0.003 | 0.001 | nonzero | 0.126 | ||||
| pg146.cx7 | 99.648 | 0.329 | 0.020 | 0.003 | nonzero | nonzero | 0.136 | ||||
| pg151.cx7 | 99.637 | 0.339 | 0.021 | 0.003 | 0.001 | nonzero | 0.149 |
Insert response time histogram: each cell has the percentage of responses that take <= the time in the header and max is the max response time in seconds. For max values in the top 25% of the range have a red background and in the bottom 25% of the range have a green background. The red background is not used when the min value is within 80% of the max value.
| dbms | 256us | 1ms | 4ms | 16ms | 64ms | 256ms | 1s | 4s | 16s | gt | max |
|---|---|---|---|---|---|---|---|---|---|---|---|
| pg1211.cx7 | 47.705 | 43.824 | 8.407 | 0.064 | 0.441 | ||||||
| pg137.cx7 | 52.271 | 39.694 | 7.948 | 0.086 | 0.605 | ||||||
| pg146.cx7 | 56.860 | 36.117 | 6.999 | 0.025 | 0.381 | ||||||
| pg151.cx7 | 51.878 | 39.858 | 8.229 | 0.035 | 0.338 |
Performance metrics for the DBMS listed above. Some are normalized by throughput, others are not. Legend for results is here.
ips	qps	rps	rmbps	wps	wmbps	rpq	rkbpq	wpi	wkbpi	csps	cpups	cspq	cpupq	dbgb1	dbgb2	rss	maxop	p50	p99	tag
2894	28372	4076	32.4	5814.9	88.1	0.144	1.168	2.009	31.179	117364	42.9	4.137	121	96.8	115.7	0.0	0.144	9402	8092	500m.pg1211.cx7
2892	28612	4086	32.4	5852.2	88.4	0.143	1.161	2.024	31.313	118261	42.9	4.133	120	96.8	115.6	0.0	0.126	9541	8279	500m.pg137.cx7
2937	28323	4150	32.9	5811.9	88.6	0.147	1.191	1.979	30.903	117131	42.9	4.136	121	96.8	119.7	0.0	0.136	9397	8055	500m.pg146.cx7
2927	28484	4144	32.9	5824.1	88.2	0.145	1.182	1.990	30.867	117617	42.9	4.129	120	96.8	119.7	0.0	0.149	9484	8151	500m.pg151.cx7
l.i0
l.i0: load without secondary indexes
Performance metrics for all DBMS, not just the ones listed above. Some are normalized by throughput, others are not. Legend for results is here.
ips	qps	rps	rmbps	wps	wmbps	rpq	rkbpq	wpi	wkbpi	csps	cpups	cspq	cpupq	dbgb1	dbgb2	rss	maxop	p50	p99	tag
212404	0	246	2.2	705.4	85.9	0.001	0.011	0.003	0.414	22950	62.3	0.108	23	47.8	64.6	0.0	0.189	71322	68723	500m.pg1211.cx7
217297	0	234	2.3	501.3	95.1	0.001	0.011	0.002	0.448	23492	62.6	0.108	23	47.8	68.1	5.5	0.190	72946	70024	500m.pg137.cx7
203252	0	209	1.8	480.8	89.9	0.001	0.009	0.002	0.453	21773	62.8	0.107	25	47.8	74.0	5.6	0.118	68426	65827	500m.pg146.cx7
213493	0	221	1.8	526.4	95.4	0.001	0.009	0.002	0.457	22550	63.4	0.106	24	47.8	74.7	0.0	0.900	71722	67426	500m.pg151.cx7
l.x
l.x: create secondary indexes
Performance metrics for all DBMS, not just the ones listed above. Some are normalized by throughput, others are not. Legend for results is here.
ips	qps	rps	rmbps	wps	wmbps	rpq	rkbpq	wpi	wkbpi	csps	cpups	cspq	cpupq	dbgb1	dbgb2	rss	maxop	p50	p99	tag
442566	0	1033	119.3	1557.0	189.8	0.002	0.276	0.004	0.439	2077	29.2	0.005	5	91.9	127.1	0.0	0.007	NA	NA	500m.pg1211.cx7
511873	0	1080	133.7	632.8	141.9	0.002	0.268	0.001	0.284	1704	30.9	0.003	5	91.9	112.2	0.0	0.004	NA	NA	500m.pg137.cx7
501102	0	1057	131.1	610.0	138.3	0.002	0.268	0.001	0.283	1660	29.9	0.003	5	91.9	118.0	0.0	0.005	NA	NA	500m.pg146.cx7
511873	0	1083	133.8	604.6	137.5	0.002	0.268	0.001	0.275	1785	29.6	0.003	5	91.9	119.1	0.0	0.004	NA	NA	500m.pg151.cx7
l.i1
l.i1: continue load after secondary indexes created
Performance metrics for all DBMS, not just the ones listed above. Some are normalized by throughput, others are not. Legend for results is here.
ips	qps	rps	rmbps	wps	wmbps	rpq	rkbpq	wpi	wkbpi	csps	cpups	cspq	cpupq	dbgb1	dbgb2	rss	maxop	p50	p99	tag
4075	0	6118	48.9	6670.6	106.1	1.501	12.292	1.637	26.668	14611	9.1	3.586	179	95.1	128.0	0.0	1.329	1398	200	500m.pg1211.cx7
3932	0	5979	47.8	6573.2	108.8	1.520	12.444	1.672	28.340	14450	9.0	3.675	183	95.1	122.3	0.0	1.136	1299	150	500m.pg137.cx7
4045	0	6089	48.7	6593.2	107.6	1.505	12.323	1.630	27.232	14724	9.1	3.640	180	95.1	129.8	0.0	0.935	1448	400	500m.pg146.cx7
3885	0	5827	46.6	6424.7	104.1	1.500	12.284	1.654	27.426	14147	8.6	3.641	177	95.1	129.5	0.0	0.902	1348	350	500m.pg151.cx7
q100.1
q100.1: range queries with 100 insert/s per client
Performance metrics for all DBMS, not just the ones listed above. Some are normalized by throughput, others are not. Legend for results is here.
ips	qps	rps	rmbps	wps	wmbps	rpq	rkbpq	wpi	wkbpi	csps	cpups	cspq	cpupq	dbgb1	dbgb2	rss	maxop	p50	p99	tag
299	28940	496	3.9	770.1	11.7	0.017	0.139	2.572	40.072	112086	38.9	3.873	108	95.2	113.4	0.0	0.040	10117	6425	500m.pg1211.cx7
300	28642	508	4.0	911.2	12.8	0.018	0.144	3.043	43.901	110948	38.6	3.874	108	95.2	105.2	0.0	0.105	10149	4443	500m.pg137.cx7
300	28877	508	4.0	927.1	13.1	0.018	0.143	3.095	44.633	111765	38.2	3.870	106	95.2	112.9	0.0	0.073	10325	4235	500m.pg146.cx7
300	28833	508	4.0	933.2	13.0	0.018	0.144	3.116	44.414	111530	38.1	3.868	106	95.2	113.3	0.0	0.102	10388	4093	500m.pg151.cx7
q500.1
q500.1: range queries with 500 insert/s per client
Performance metrics for all DBMS, not just the ones listed above. Some are normalized by throughput, others are not. Legend for results is here.
ips	qps	rps	rmbps	wps	wmbps	rpq	rkbpq	wpi	wkbpi	csps	cpups	cspq	cpupq	dbgb1	dbgb2	rss	maxop	p50	p99	tag
1498	28913	2094	16.6	3165.4	49.1	0.072	0.587	2.114	33.548	115121	40.9	3.982	113	95.8	108.0	0.0	0.050	9941	7963	500m.pg1211.cx7
1498	28363	2106	16.7	3189.8	49.4	0.074	0.603	2.130	33.810	113030	40.9	3.985	115	95.8	106.6	0.0	0.098	9861	7820	500m.pg137.cx7
1498	28808	2107	16.7	3119.8	48.2	0.073	0.593	2.083	32.934	114650	40.6	3.980	113	95.8	109.0	0.0	0.063	9957	7851	500m.pg146.cx7
1498	29078	2121	16.8	3104.2	48.1	0.073	0.592	2.072	32.872	115537	40.6	3.973	112	95.8	109.0	0.0	0.060	10053	7847	500m.pg151.cx7
q1000.1
q1000.1: range queries with 1000 insert/s per client
Performance metrics for all DBMS, not just the ones listed above. Some are normalized by throughput, others are not. Legend for results is here.
ips	qps	rps	rmbps	wps	wmbps	rpq	rkbpq	wpi	wkbpi	csps	cpups	cspq	cpupq	dbgb1	dbgb2	rss	maxop	p50	p99	tag
2894	28372	4076	32.4	5814.9	88.1	0.144	1.168	2.009	31.179	117364	42.9	4.137	121	96.8	115.7	0.0	0.144	9402	8092	500m.pg1211.cx7
2892	28612	4086	32.4	5852.2	88.4	0.143	1.161	2.024	31.313	118261	42.9	4.133	120	96.8	115.6	0.0	0.126	9541	8279	500m.pg137.cx7
2937	28323	4150	32.9	5811.9	88.6	0.147	1.191	1.979	30.903	117131	42.9	4.136	121	96.8	119.7	0.0	0.136	9397	8055	500m.pg146.cx7
2927	28484	4144	32.9	5824.1	88.2	0.145	1.182	1.990	30.867	117617	42.9	4.129	120	96.8	119.7	0.0	0.149	9484	8151	500m.pg151.cx7
l.i0
- l.i0: load without secondary indexes
- Legend for results is here.
- Each entry lists the percentage of responses that fit in that bucket (slower than max time for previous bucket, faster than min time for next bucket).
Insert response time histogram
256us	1ms	4ms	16ms	64ms	256ms	1s	4s	16s	gt	max	tag
0.000	0.000	99.988	0.011	nonzero	0.001	0.000	0.000	0.000	0.000	0.189	pg1211.cx7
0.000	0.000	99.984	0.015	0.001	0.001	0.000	0.000	0.000	0.000	0.190	pg137.cx7
0.000	0.000	99.983	0.016	0.001	0.001	0.000	0.000	0.000	0.000	0.118	pg146.cx7
0.000	0.000	99.982	0.016	0.001	0.001	nonzero	0.000	0.000	0.000	0.900	pg151.cx7
l.x
- l.x: create secondary indexes
- Legend for results is here.
- Each entry lists the percentage of responses that fit in that bucket (slower than max time for previous bucket, faster than min time for next bucket).
TODO - determine whether there is data for create index response time
l.i1
- l.i1: continue load after secondary indexes created
- Legend for results is here.
- Each entry lists the percentage of responses that fit in that bucket (slower than max time for previous bucket, faster than min time for next bucket).
Insert response time histogram
256us	1ms	4ms	16ms	64ms	256ms	1s	4s	16s	gt	max	tag
0.000	0.000	0.000	26.473	61.073	12.038	0.414	0.001	0.000	0.000	1.329	pg1211.cx7
0.000	0.000	0.000	25.783	60.915	12.824	0.474	0.002	0.000	0.000	1.136	pg137.cx7
0.000	0.000	0.000	27.061	59.512	13.245	0.181	0.000	0.000	0.000	0.935	pg146.cx7
0.000	0.000	0.000	24.283	60.645	14.862	0.209	0.000	0.000	0.000	0.902	pg151.cx7
q100.1
- q100.1: range queries with 100 insert/s per client
- Legend for results is here.
- Each entry lists the percentage of responses that fit in that bucket (slower than max time for previous bucket, faster than min time for next bucket).
Query response time histogram
256us	1ms	4ms	16ms	64ms	256ms	1s	4s	16s	gt	max	tag
99.737	0.258	0.004	0.001	nonzero	0.000	0.000	0.000	0.000	0.000	0.040	pg1211.cx7
99.721	0.267	0.007	0.004	0.001	nonzero	0.000	0.000	0.000	0.000	0.105	pg137.cx7
99.704	0.281	0.010	0.005	nonzero	nonzero	0.000	0.000	0.000	0.000	0.073	pg146.cx7
99.712	0.272	0.009	0.006	0.001	nonzero	0.000	0.000	0.000	0.000	0.102	pg151.cx7
Insert response time histogram
256us	1ms	4ms	16ms	64ms	256ms	1s	4s	16s	gt	max	tag
0.000	0.000	0.000	59.681	39.602	0.718	0.000	0.000	0.000	0.000	0.106	pg1211.cx7
0.000	0.000	0.000	81.704	17.889	0.380	0.028	0.000	0.000	0.000	0.837	pg137.cx7
0.000	0.000	0.000	75.356	24.125	0.519	0.000	0.000	0.000	0.000	0.147	pg146.cx7
0.000	0.000	0.000	77.764	21.486	0.736	0.014	0.000	0.000	0.000	0.396	pg151.cx7
q500.1
- q500.1: range queries with 500 insert/s per client
- Legend for results is here.
- Each entry lists the percentage of responses that fit in that bucket (slower than max time for previous bucket, faster than min time for next bucket).
Query response time histogram
256us	1ms	4ms	16ms	64ms	256ms	1s	4s	16s	gt	max	tag
99.833	0.155	0.011	0.001	nonzero	0.000	0.000	0.000	0.000	0.000	0.050	pg1211.cx7
99.823	0.165	0.011	0.001	nonzero	nonzero	0.000	0.000	0.000	0.000	0.098	pg137.cx7
99.792	0.196	0.011	0.001	nonzero	0.000	0.000	0.000	0.000	0.000	0.063	pg146.cx7
99.809	0.179	0.011	0.001	nonzero	0.000	0.000	0.000	0.000	0.000	0.060	pg151.cx7
Insert response time histogram
256us	1ms	4ms	16ms	64ms	256ms	1s	4s	16s	gt	max	tag
0.000	0.000	0.000	36.779	56.373	6.840	0.008	0.000	0.000	0.000	0.377	pg1211.cx7
0.000	0.000	0.000	43.200	52.026	4.744	0.030	0.000	0.000	0.000	0.460	pg137.cx7
0.000	0.000	0.000	38.659	54.424	6.916	0.001	0.000	0.000	0.000	0.256	pg146.cx7
0.000	0.000	0.000	43.419	51.202	5.366	0.013	0.000	0.000	0.000	0.370	pg151.cx7
q1000.1
- q1000.1: range queries with 1000 insert/s per client
- Legend for results is here.
- Each entry lists the percentage of responses that fit in that bucket (slower than max time for previous bucket, faster than min time for next bucket).
Query response time histogram
256us	1ms	4ms	16ms	64ms	256ms	1s	4s	16s	gt	max	tag
99.684	0.292	0.020	0.003	0.001	nonzero	0.000	0.000	0.000	0.000	0.144	pg1211.cx7
99.701	0.277	0.020	0.003	0.001	nonzero	0.000	0.000	0.000	0.000	0.126	pg137.cx7
99.648	0.329	0.020	0.003	nonzero	nonzero	0.000	0.000	0.000	0.000	0.136	pg146.cx7
99.637	0.339	0.021	0.003	0.001	nonzero	0.000	0.000	0.000	0.000	0.149	pg151.cx7
Insert response time histogram
256us	1ms	4ms	16ms	64ms	256ms	1s	4s	16s	gt	max	tag
0.000	0.000	0.000	47.705	43.824	8.407	0.064	0.000	0.000	0.000	0.441	pg1211.cx7
0.000	0.000	0.000	52.271	39.694	7.948	0.086	0.000	0.000	0.000	0.605	pg137.cx7
0.000	0.000	0.000	56.860	36.117	6.999	0.025	0.000	0.000	0.000	0.381	pg146.cx7
0.000	0.000	0.000	51.878	39.858	8.229	0.035	0.000	0.000	0.000	0.338	pg151.cx7