Introduction
This is a report for the insert benchmark with 500M docs and 2 client(s). It is generated by scripts (bash, awk, sed) and Tufte might not be impressed. An overview of the insert benchmark is here and a short update is here. Below, by DBMS, I mean DBMS+version.config. An example is my8020.c10b40 where my means MySQL, 8020 is version 8.0.20 and c10b40 is the name for the configuration file.
The test server has 8 AMD cores, 16G RAM and an NVMe SSD. It is described here as the Beelink. The benchmark was run with 2 clients and there were 1 or 2 connections per client (1 for queries, 1 for inserts). The benchmark loads 500M rows without secondary indexes, creates secondary indexes, loads another 10M rows then does 3 read+write tests for one hour each that do queries as fast as possible with 100, 500 and then 1000 writes/second/client concurrent with the queries. The database doesn't fit in memory and parts of the benchmark are IO-bound. Clients and the DBMS share one server. The per-database configs are in the per-database subdirectories here.
The tested DBMS are:
- pg1211.cx7 - Postgres 12.11 and the cx7 config
- pg137.cx7 - Postgres 13.7 and the cx7 config
- pg146.cx7 - Postgres 14.6 and the cx7 config
- pg151.cx7 - Postgres 15.1 and the cx7 config
Contents
- Summary
- l.i0: load without secondary indexes
- l.x: create secondary indexes
- l.i1: continue load after secondary indexes created
- q100.1: range queries with 100 insert/s per client
- q500.1: range queries with 500 insert/s per client
- q1000.1: range queries with 1000 insert/s per client
Summary
The numbers are inserts/s for l.i0 and l.i1, indexed docs (or rows) /s for l.x and queries/s for q*.2. The values are the average rate over the entire test for inserts (IPS) and queries (QPS). The range of values for IPS and QPS is split into 3 parts: bottom 25%, middle 50%, top 25%. Values in the bottom 25% have a red background, values in the top 25% have a green background and values in the middle have no color. A gray background is used for values that can be ignored because the DBMS did not sustain the target insert rate. Red backgrounds are not used when the minimum value is within 80% of the max value.
| dbms | l.i0 | l.x | l.i1 | q100.1 | q500.1 | q1000.1 |
|---|---|---|---|---|---|---|
| 500m.pg1211.cx7 | 142086 | 329013 | 3730 | 16288 | 17074 | 17366 |
| 500m.pg137.cx7 | 141243 | 371269 | 3684 | 16208 | 17319 | 17486 |
| 500m.pg146.cx7 | 138045 | 359009 | 3762 | 15796 | 16794 | 16900 |
| 500m.pg151.cx7 | 142167 | 343004 | 3775 | 16018 | 17055 | 17215 |
This lists the average rate of inserts/s for the tests that do inserts concurrent with queries. For such tests the query rate is listed in the table above. The read+write tests are setup so that the insert rate should match the target rate every second. Cells that are not at least 95% of the target have a red background to indicate a failure to satisfy the target.
| dbms | q100.1 | q500.1 | q1000.1 |
|---|---|---|---|
| pg1211.cx7 | 200 | 999 | 1986 |
| pg137.cx7 | 200 | 999 | 1988 |
| pg146.cx7 | 200 | 999 | 1996 |
| pg151.cx7 | 200 | 999 | 1997 |
| target | 200 | 1000 | 2000 |
l.i0
l.i0: load without secondary indexes. Graphs for performance per 1-second interval are here.
Average throughput:
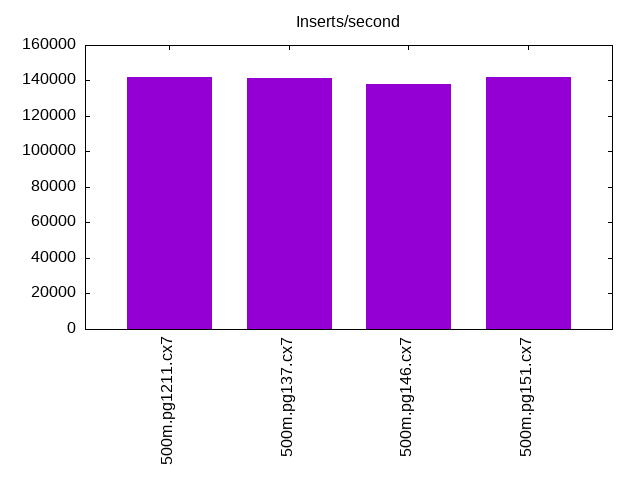
Insert response time histogram: each cell has the percentage of responses that take <= the time in the header and max is the max response time in seconds. For the max column values in the top 25% of the range have a red background and in the bottom 25% of the range have a green background. The red background is not used when the min value is within 80% of the max value.
| dbms | 256us | 1ms | 4ms | 16ms | 64ms | 256ms | 1s | 4s | 16s | gt | max |
|---|---|---|---|---|---|---|---|---|---|---|---|
| pg1211.cx7 | 99.998 | 0.001 | nonzero | nonzero | 0.131 | ||||||
| pg137.cx7 | 99.997 | 0.002 | 0.001 | nonzero | nonzero | 0.565 | |||||
| pg146.cx7 | 99.998 | 0.001 | nonzero | nonzero | 0.206 | ||||||
| pg151.cx7 | 99.998 | 0.002 | nonzero | nonzero | 0.188 |
Performance metrics for the DBMS listed above. Some are normalized by throughput, others are not. Legend for results is here.
ips	qps	rps	rmbps	wps	wmbps	rpq	rkbpq	wpi	wkbpi	csps	cpups	cspq	cpupq	dbgb1	dbgb2	rss	maxop	p50	p99	tag
142086	0	120	1.0	435.5	56.4	0.001	0.007	0.003	0.407	17188	43.7	0.121	25	47.8	59.1	0.0	0.131	71619	70220	500m.pg1211.cx7
141243	0	110	1.0	323.7	63.7	0.001	0.007	0.002	0.462	17174	44.0	0.122	25	47.8	61.9	0.0	0.565	71050	69553	500m.pg137.cx7
138045	0	110	1.0	326.8	63.3	0.001	0.008	0.002	0.470	16575	44.2	0.120	26	47.8	67.4	0.0	0.206	69256	68023	500m.pg146.cx7
142167	0	112	0.9	326.8	63.9	0.001	0.006	0.002	0.460	17021	44.3	0.120	25	47.8	66.4	0.0	0.188	71422	69923	500m.pg151.cx7
l.x
l.x: create secondary indexes.
Average throughput:
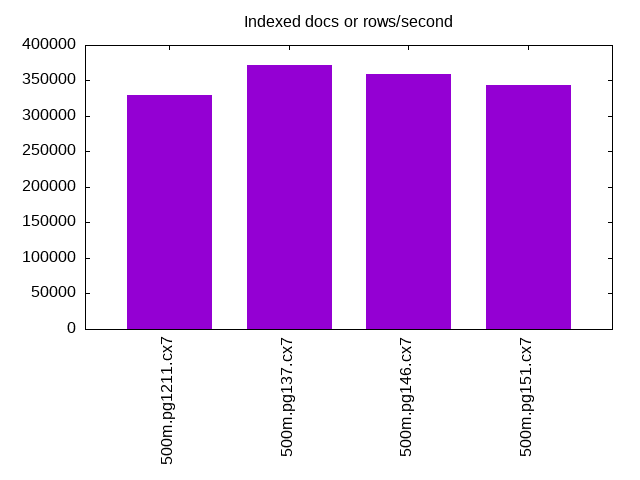
Performance metrics for the DBMS listed above. Some are normalized by throughput, others are not. Legend for results is here.
ips	qps	rps	rmbps	wps	wmbps	rpq	rkbpq	wpi	wkbpi	csps	cpups	cspq	cpupq	dbgb1	dbgb2	rss	maxop	p50	p99	tag
329013	0	778	91.3	1094.7	147.7	0.002	0.284	0.003	0.460	1218	21.4	0.004	5	91.9	125.6	0.0	0.005	NA	NA	500m.pg1211.cx7
371269	0	808	100.0	479.1	109.2	0.002	0.276	0.001	0.301	953	22.4	0.003	5	91.9	108.6	0.0	0.007	NA	NA	500m.pg137.cx7
359009	0	778	96.3	449.0	102.3	0.002	0.275	0.001	0.292	990	21.3	0.003	5	91.9	111.5	0.0	0.004	NA	NA	500m.pg146.cx7
343004	0	946	116.7	535.9	121.7	0.003	0.349	0.002	0.363	1398	21.2	0.004	5	91.9	113.3	0.0	0.005	NA	NA	500m.pg151.cx7
l.i1
l.i1: continue load after secondary indexes created. Graphs for performance per 1-second interval are here.
Average throughput:
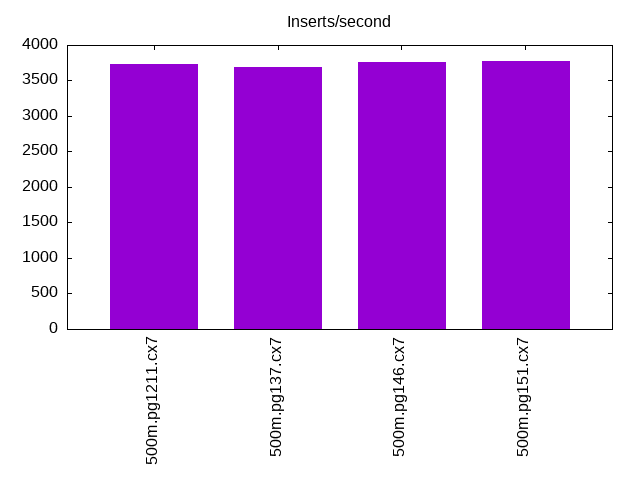
Insert response time histogram: each cell has the percentage of responses that take <= the time in the header and max is the max response time in seconds. For the max column values in the top 25% of the range have a red background and in the bottom 25% of the range have a green background. The red background is not used when the min value is within 80% of the max value.
| dbms | 256us | 1ms | 4ms | 16ms | 64ms | 256ms | 1s | 4s | 16s | gt | max |
|---|---|---|---|---|---|---|---|---|---|---|---|
| pg1211.cx7 | 46.755 | 45.914 | 7.236 | 0.093 | 0.001 | 1.308 | |||||
| pg137.cx7 | 47.411 | 44.889 | 7.573 | 0.128 | 0.845 | ||||||
| pg146.cx7 | 43.735 | 49.126 | 7.085 | 0.053 | 0.804 | ||||||
| pg151.cx7 | 44.882 | 47.828 | 7.235 | 0.055 | 0.720 |
Performance metrics for the DBMS listed above. Some are normalized by throughput, others are not. Legend for results is here.
ips	qps	rps	rmbps	wps	wmbps	rpq	rkbpq	wpi	wkbpi	csps	cpups	cspq	cpupq	dbgb1	dbgb2	rss	maxop	p50	p99	tag
3730	0	5297	42.2	6283.4	96.5	1.420	11.584	1.685	26.507	12714	7.9	3.409	169	94.4	121.6	0.0	1.308	1899	250	500m.pg1211.cx7
3684	0	5298	42.9	6325.4	100.8	1.438	11.919	1.717	28.028	12799	8.0	3.474	174	94.4	119.2	0.1	0.845	1848	250	500m.pg137.cx7
3762	0	5397	43.0	6142.1	99.3	1.434	11.694	1.633	27.034	13016	7.8	3.460	166	94.4	126.7	0.0	0.804	1998	549	500m.pg146.cx7
3775	0	5417	43.1	6097.2	98.8	1.435	11.701	1.615	26.802	13087	7.8	3.467	165	94.4	127.5	0.0	0.720	1949	599	500m.pg151.cx7
q100.1
q100.1: range queries with 100 insert/s per client. Graphs for performance per 1-second interval are here.
Average throughput:
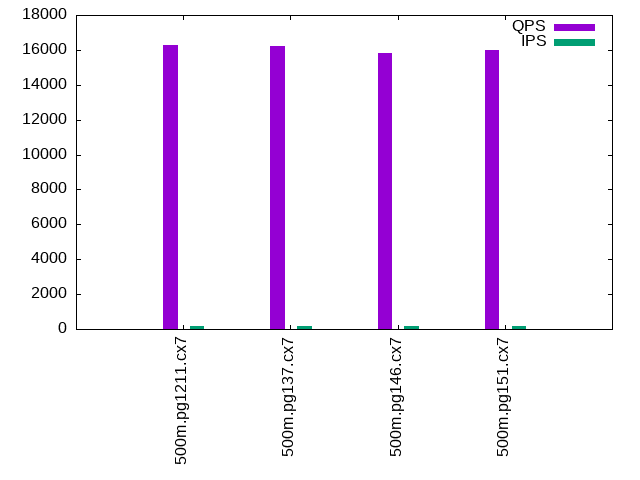
Query response time histogram: each cell has the percentage of responses that take <= the time in the header and max is the max response time in seconds. For max values in the top 25% of the range have a red background and in the bottom 25% of the range have a green background. The red background is not used when the min value is within 80% of the max value.
| dbms | 256us | 1ms | 4ms | 16ms | 64ms | 256ms | 1s | 4s | 16s | gt | max |
|---|---|---|---|---|---|---|---|---|---|---|---|
| pg1211.cx7 | 99.685 | 0.312 | 0.002 | 0.001 | nonzero | 0.035 | |||||
| pg137.cx7 | 99.694 | 0.300 | 0.004 | 0.002 | 0.001 | 0.055 | |||||
| pg146.cx7 | 99.651 | 0.340 | 0.007 | 0.002 | nonzero | nonzero | 0.079 | ||||
| pg151.cx7 | 99.671 | 0.317 | 0.007 | 0.004 | 0.001 | 0.064 |
Insert response time histogram: each cell has the percentage of responses that take <= the time in the header and max is the max response time in seconds. For max values in the top 25% of the range have a red background and in the bottom 25% of the range have a green background. The red background is not used when the min value is within 80% of the max value.
| dbms | 256us | 1ms | 4ms | 16ms | 64ms | 256ms | 1s | 4s | 16s | gt | max |
|---|---|---|---|---|---|---|---|---|---|---|---|
| pg1211.cx7 | 78.931 | 21.062 | 0.007 | 0.083 | |||||||
| pg137.cx7 | 86.299 | 13.549 | 0.111 | 0.042 | 0.980 | ||||||
| pg146.cx7 | 89.569 | 10.375 | 0.056 | 0.088 | |||||||
| pg151.cx7 | 90.222 | 9.604 | 0.167 | 0.007 | 0.269 |
Performance metrics for the DBMS listed above. Some are normalized by throughput, others are not. Legend for results is here.
ips	qps	rps	rmbps	wps	wmbps	rpq	rkbpq	wpi	wkbpi	csps	cpups	cspq	cpupq	dbgb1	dbgb2	rss	maxop	p50	p99	tag
200	16288	308	2.5	522.5	7.9	0.019	0.155	2.617	40.670	63443	26.8	3.895	132	94.5	116.1	0.0	0.035	7831	6233	500m.pg1211.cx7
200	16208	317	2.5	640.6	9.0	0.020	0.161	3.208	46.147	63160	26.6	3.897	131	94.5	108.1	0.0	0.055	7767	5865	500m.pg137.cx7
200	15796	317	2.5	671.4	9.2	0.020	0.164	3.362	47.116	61522	26.1	3.895	132	94.5	115.7	0.0	0.079	7527	5242	500m.pg146.cx7
200	16018	316	2.5	686.8	9.4	0.020	0.161	3.439	48.074	62324	26.0	3.891	130	94.5	116.5	0.0	0.064	7787	5370	500m.pg151.cx7
q500.1
q500.1: range queries with 500 insert/s per client. Graphs for performance per 1-second interval are here.
Average throughput:
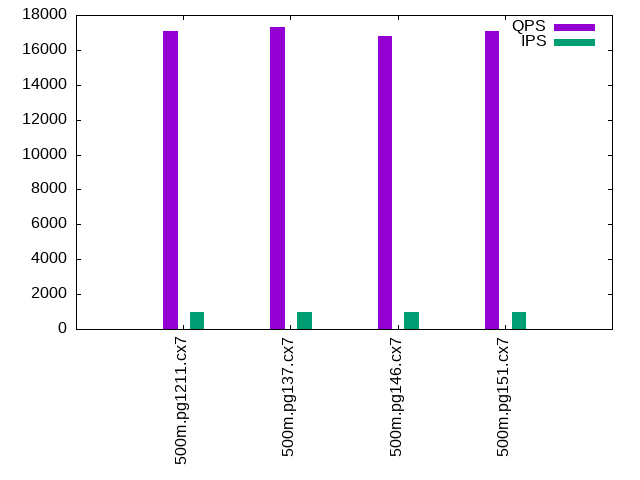
Query response time histogram: each cell has the percentage of responses that take <= the time in the header and max is the max response time in seconds. For max values in the top 25% of the range have a red background and in the bottom 25% of the range have a green background. The red background is not used when the min value is within 80% of the max value.
| dbms | 256us | 1ms | 4ms | 16ms | 64ms | 256ms | 1s | 4s | 16s | gt | max |
|---|---|---|---|---|---|---|---|---|---|---|---|
| pg1211.cx7 | 99.837 | 0.159 | 0.004 | nonzero | nonzero | 0.016 | |||||
| pg137.cx7 | 99.839 | 0.156 | 0.004 | nonzero | 0.012 | ||||||
| pg146.cx7 | 99.794 | 0.201 | 0.004 | nonzero | nonzero | 0.038 | |||||
| pg151.cx7 | 99.817 | 0.178 | 0.004 | nonzero | nonzero | 0.029 |
Insert response time histogram: each cell has the percentage of responses that take <= the time in the header and max is the max response time in seconds. For max values in the top 25% of the range have a red background and in the bottom 25% of the range have a green background. The red background is not used when the min value is within 80% of the max value.
| dbms | 256us | 1ms | 4ms | 16ms | 64ms | 256ms | 1s | 4s | 16s | gt | max |
|---|---|---|---|---|---|---|---|---|---|---|---|
| pg1211.cx7 | 67.254 | 31.353 | 1.393 | 0.223 | |||||||
| pg137.cx7 | 68.171 | 30.550 | 1.274 | 0.006 | 0.394 | ||||||
| pg146.cx7 | 66.201 | 32.451 | 1.347 | 0.147 | |||||||
| pg151.cx7 | 66.165 | 32.599 | 1.236 | 0.137 |
Performance metrics for the DBMS listed above. Some are normalized by throughput, others are not. Legend for results is here.
ips	qps	rps	rmbps	wps	wmbps	rpq	rkbpq	wpi	wkbpi	csps	cpups	cspq	cpupq	dbgb1	dbgb2	rss	maxop	p50	p99	tag
999	17074	1336	10.6	2032.6	33.5	0.078	0.634	2.035	34.365	68687	28.0	4.023	131	94.8	104.6	0.0	0.016	8326	7432	500m.pg1211.cx7
999	17319	1341	10.6	2044.7	33.5	0.077	0.628	2.048	34.365	69624	28.0	4.020	129	94.8	103.0	0.0	0.012	8558	7607	500m.pg137.cx7
999	16794	1341	10.6	1964.9	32.3	0.080	0.649	1.968	33.091	67572	27.7	4.024	132	94.8	105.3	0.0	0.038	8247	7419	500m.pg146.cx7
999	17055	1341	10.6	1961.8	32.3	0.079	0.639	1.965	33.099	68522	27.7	4.018	130	94.8	105.4	0.0	0.029	8327	7448	500m.pg151.cx7
q1000.1
q1000.1: range queries with 1000 insert/s per client. Graphs for performance per 1-second interval are here.
Average throughput:
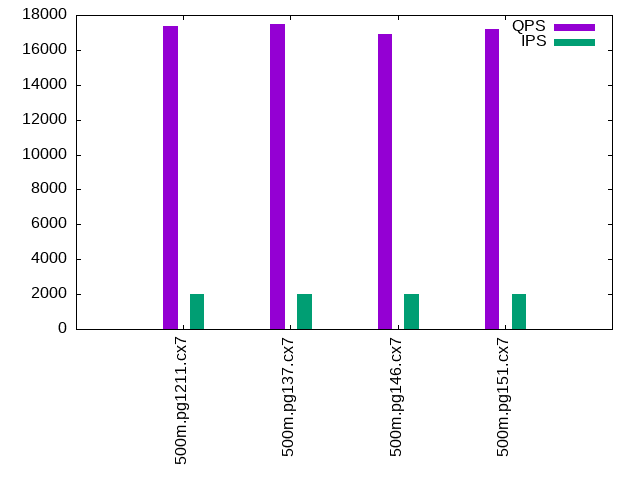
Query response time histogram: each cell has the percentage of responses that take <= the time in the header and max is the max response time in seconds. For max values in the top 25% of the range have a red background and in the bottom 25% of the range have a green background. The red background is not used when the min value is within 80% of the max value.
| dbms | 256us | 1ms | 4ms | 16ms | 64ms | 256ms | 1s | 4s | 16s | gt | max |
|---|---|---|---|---|---|---|---|---|---|---|---|
| pg1211.cx7 | 99.741 | 0.252 | 0.006 | 0.001 | nonzero | 0.045 | |||||
| pg137.cx7 | 99.744 | 0.250 | 0.006 | 0.001 | nonzero | 0.054 | |||||
| pg146.cx7 | 99.654 | 0.338 | 0.007 | 0.001 | nonzero | nonzero | 0.128 | ||||
| pg151.cx7 | 99.682 | 0.311 | 0.006 | 0.001 | nonzero | nonzero | 0.125 |
Insert response time histogram: each cell has the percentage of responses that take <= the time in the header and max is the max response time in seconds. For max values in the top 25% of the range have a red background and in the bottom 25% of the range have a green background. The red background is not used when the min value is within 80% of the max value.
| dbms | 256us | 1ms | 4ms | 16ms | 64ms | 256ms | 1s | 4s | 16s | gt | max |
|---|---|---|---|---|---|---|---|---|---|---|---|
| pg1211.cx7 | 69.480 | 26.919 | 3.578 | 0.023 | 0.396 | ||||||
| pg137.cx7 | 69.938 | 26.861 | 3.181 | 0.019 | 0.391 | ||||||
| pg146.cx7 | 62.815 | 33.451 | 3.698 | 0.036 | 0.349 | ||||||
| pg151.cx7 | 62.379 | 34.058 | 3.552 | 0.011 | 0.301 |
Performance metrics for the DBMS listed above. Some are normalized by throughput, others are not. Legend for results is here.
ips	qps	rps	rmbps	wps	wmbps	rpq	rkbpq	wpi	wkbpi	csps	cpups	cspq	cpupq	dbgb1	dbgb2	rss	maxop	p50	p99	tag
1986	17366	2664	21.2	3829.5	61.6	0.153	1.248	1.928	31.753	72891	29.6	4.197	136	95.5	109.2	0.0	0.045	8678	7452	500m.pg1211.cx7
1988	17486	2686	21.3	3864.0	62.1	0.154	1.249	1.943	32.001	73338	29.7	4.194	136	95.5	109.3	0.0	0.054	8763	7559	500m.pg137.cx7
1996	16900	2688	21.4	3837.3	61.7	0.159	1.294	1.923	31.657	71120	29.4	4.208	139	95.5	112.2	0.0	0.128	8374	7352	500m.pg146.cx7
1997	17215	2687	21.3	3837.4	61.6	0.156	1.270	1.922	31.591	72236	29.3	4.196	136	95.5	112.2	0.0	0.125	8540	7480	500m.pg151.cx7
l.i0
l.i0: load without secondary indexes
Performance metrics for all DBMS, not just the ones listed above. Some are normalized by throughput, others are not. Legend for results is here.
ips	qps	rps	rmbps	wps	wmbps	rpq	rkbpq	wpi	wkbpi	csps	cpups	cspq	cpupq	dbgb1	dbgb2	rss	maxop	p50	p99	tag
142086	0	120	1.0	435.5	56.4	0.001	0.007	0.003	0.407	17188	43.7	0.121	25	47.8	59.1	0.0	0.131	71619	70220	500m.pg1211.cx7
141243	0	110	1.0	323.7	63.7	0.001	0.007	0.002	0.462	17174	44.0	0.122	25	47.8	61.9	0.0	0.565	71050	69553	500m.pg137.cx7
138045	0	110	1.0	326.8	63.3	0.001	0.008	0.002	0.470	16575	44.2	0.120	26	47.8	67.4	0.0	0.206	69256	68023	500m.pg146.cx7
142167	0	112	0.9	326.8	63.9	0.001	0.006	0.002	0.460	17021	44.3	0.120	25	47.8	66.4	0.0	0.188	71422	69923	500m.pg151.cx7
l.x
l.x: create secondary indexes
Performance metrics for all DBMS, not just the ones listed above. Some are normalized by throughput, others are not. Legend for results is here.
ips	qps	rps	rmbps	wps	wmbps	rpq	rkbpq	wpi	wkbpi	csps	cpups	cspq	cpupq	dbgb1	dbgb2	rss	maxop	p50	p99	tag
329013	0	778	91.3	1094.7	147.7	0.002	0.284	0.003	0.460	1218	21.4	0.004	5	91.9	125.6	0.0	0.005	NA	NA	500m.pg1211.cx7
371269	0	808	100.0	479.1	109.2	0.002	0.276	0.001	0.301	953	22.4	0.003	5	91.9	108.6	0.0	0.007	NA	NA	500m.pg137.cx7
359009	0	778	96.3	449.0	102.3	0.002	0.275	0.001	0.292	990	21.3	0.003	5	91.9	111.5	0.0	0.004	NA	NA	500m.pg146.cx7
343004	0	946	116.7	535.9	121.7	0.003	0.349	0.002	0.363	1398	21.2	0.004	5	91.9	113.3	0.0	0.005	NA	NA	500m.pg151.cx7
l.i1
l.i1: continue load after secondary indexes created
Performance metrics for all DBMS, not just the ones listed above. Some are normalized by throughput, others are not. Legend for results is here.
ips	qps	rps	rmbps	wps	wmbps	rpq	rkbpq	wpi	wkbpi	csps	cpups	cspq	cpupq	dbgb1	dbgb2	rss	maxop	p50	p99	tag
3730	0	5297	42.2	6283.4	96.5	1.420	11.584	1.685	26.507	12714	7.9	3.409	169	94.4	121.6	0.0	1.308	1899	250	500m.pg1211.cx7
3684	0	5298	42.9	6325.4	100.8	1.438	11.919	1.717	28.028	12799	8.0	3.474	174	94.4	119.2	0.1	0.845	1848	250	500m.pg137.cx7
3762	0	5397	43.0	6142.1	99.3	1.434	11.694	1.633	27.034	13016	7.8	3.460	166	94.4	126.7	0.0	0.804	1998	549	500m.pg146.cx7
3775	0	5417	43.1	6097.2	98.8	1.435	11.701	1.615	26.802	13087	7.8	3.467	165	94.4	127.5	0.0	0.720	1949	599	500m.pg151.cx7
q100.1
q100.1: range queries with 100 insert/s per client
Performance metrics for all DBMS, not just the ones listed above. Some are normalized by throughput, others are not. Legend for results is here.
ips	qps	rps	rmbps	wps	wmbps	rpq	rkbpq	wpi	wkbpi	csps	cpups	cspq	cpupq	dbgb1	dbgb2	rss	maxop	p50	p99	tag
200	16288	308	2.5	522.5	7.9	0.019	0.155	2.617	40.670	63443	26.8	3.895	132	94.5	116.1	0.0	0.035	7831	6233	500m.pg1211.cx7
200	16208	317	2.5	640.6	9.0	0.020	0.161	3.208	46.147	63160	26.6	3.897	131	94.5	108.1	0.0	0.055	7767	5865	500m.pg137.cx7
200	15796	317	2.5	671.4	9.2	0.020	0.164	3.362	47.116	61522	26.1	3.895	132	94.5	115.7	0.0	0.079	7527	5242	500m.pg146.cx7
200	16018	316	2.5	686.8	9.4	0.020	0.161	3.439	48.074	62324	26.0	3.891	130	94.5	116.5	0.0	0.064	7787	5370	500m.pg151.cx7
q500.1
q500.1: range queries with 500 insert/s per client
Performance metrics for all DBMS, not just the ones listed above. Some are normalized by throughput, others are not. Legend for results is here.
ips	qps	rps	rmbps	wps	wmbps	rpq	rkbpq	wpi	wkbpi	csps	cpups	cspq	cpupq	dbgb1	dbgb2	rss	maxop	p50	p99	tag
999	17074	1336	10.6	2032.6	33.5	0.078	0.634	2.035	34.365	68687	28.0	4.023	131	94.8	104.6	0.0	0.016	8326	7432	500m.pg1211.cx7
999	17319	1341	10.6	2044.7	33.5	0.077	0.628	2.048	34.365	69624	28.0	4.020	129	94.8	103.0	0.0	0.012	8558	7607	500m.pg137.cx7
999	16794	1341	10.6	1964.9	32.3	0.080	0.649	1.968	33.091	67572	27.7	4.024	132	94.8	105.3	0.0	0.038	8247	7419	500m.pg146.cx7
999	17055	1341	10.6	1961.8	32.3	0.079	0.639	1.965	33.099	68522	27.7	4.018	130	94.8	105.4	0.0	0.029	8327	7448	500m.pg151.cx7
q1000.1
q1000.1: range queries with 1000 insert/s per client
Performance metrics for all DBMS, not just the ones listed above. Some are normalized by throughput, others are not. Legend for results is here.
ips	qps	rps	rmbps	wps	wmbps	rpq	rkbpq	wpi	wkbpi	csps	cpups	cspq	cpupq	dbgb1	dbgb2	rss	maxop	p50	p99	tag
1986	17366	2664	21.2	3829.5	61.6	0.153	1.248	1.928	31.753	72891	29.6	4.197	136	95.5	109.2	0.0	0.045	8678	7452	500m.pg1211.cx7
1988	17486	2686	21.3	3864.0	62.1	0.154	1.249	1.943	32.001	73338	29.7	4.194	136	95.5	109.3	0.0	0.054	8763	7559	500m.pg137.cx7
1996	16900	2688	21.4	3837.3	61.7	0.159	1.294	1.923	31.657	71120	29.4	4.208	139	95.5	112.2	0.0	0.128	8374	7352	500m.pg146.cx7
1997	17215	2687	21.3	3837.4	61.6	0.156	1.270	1.922	31.591	72236	29.3	4.196	136	95.5	112.2	0.0	0.125	8540	7480	500m.pg151.cx7
l.i0
- l.i0: load without secondary indexes
- Legend for results is here.
- Each entry lists the percentage of responses that fit in that bucket (slower than max time for previous bucket, faster than min time for next bucket).
Insert response time histogram
256us	1ms	4ms	16ms	64ms	256ms	1s	4s	16s	gt	max	tag
0.000	0.000	99.998	0.001	nonzero	nonzero	0.000	0.000	0.000	0.000	0.131	pg1211.cx7
0.000	0.000	99.997	0.002	0.001	nonzero	nonzero	0.000	0.000	0.000	0.565	pg137.cx7
0.000	0.000	99.998	0.001	nonzero	nonzero	0.000	0.000	0.000	0.000	0.206	pg146.cx7
0.000	0.000	99.998	0.002	nonzero	nonzero	0.000	0.000	0.000	0.000	0.188	pg151.cx7
l.x
- l.x: create secondary indexes
- Legend for results is here.
- Each entry lists the percentage of responses that fit in that bucket (slower than max time for previous bucket, faster than min time for next bucket).
TODO - determine whether there is data for create index response time
l.i1
- l.i1: continue load after secondary indexes created
- Legend for results is here.
- Each entry lists the percentage of responses that fit in that bucket (slower than max time for previous bucket, faster than min time for next bucket).
Insert response time histogram
256us	1ms	4ms	16ms	64ms	256ms	1s	4s	16s	gt	max	tag
0.000	0.000	0.000	46.755	45.914	7.236	0.093	0.001	0.000	0.000	1.308	pg1211.cx7
0.000	0.000	0.000	47.411	44.889	7.573	0.128	0.000	0.000	0.000	0.845	pg137.cx7
0.000	0.000	0.000	43.735	49.126	7.085	0.053	0.000	0.000	0.000	0.804	pg146.cx7
0.000	0.000	0.000	44.882	47.828	7.235	0.055	0.000	0.000	0.000	0.720	pg151.cx7
q100.1
- q100.1: range queries with 100 insert/s per client
- Legend for results is here.
- Each entry lists the percentage of responses that fit in that bucket (slower than max time for previous bucket, faster than min time for next bucket).
Query response time histogram
256us	1ms	4ms	16ms	64ms	256ms	1s	4s	16s	gt	max	tag
99.685	0.312	0.002	0.001	nonzero	0.000	0.000	0.000	0.000	0.000	0.035	pg1211.cx7
99.694	0.300	0.004	0.002	0.001	0.000	0.000	0.000	0.000	0.000	0.055	pg137.cx7
99.651	0.340	0.007	0.002	nonzero	nonzero	0.000	0.000	0.000	0.000	0.079	pg146.cx7
99.671	0.317	0.007	0.004	0.001	0.000	0.000	0.000	0.000	0.000	0.064	pg151.cx7
Insert response time histogram
256us	1ms	4ms	16ms	64ms	256ms	1s	4s	16s	gt	max	tag
0.000	0.000	0.000	78.931	21.062	0.007	0.000	0.000	0.000	0.000	0.083	pg1211.cx7
0.000	0.000	0.000	86.299	13.549	0.111	0.042	0.000	0.000	0.000	0.980	pg137.cx7
0.000	0.000	0.000	89.569	10.375	0.056	0.000	0.000	0.000	0.000	0.088	pg146.cx7
0.000	0.000	0.000	90.222	9.604	0.167	0.007	0.000	0.000	0.000	0.269	pg151.cx7
q500.1
- q500.1: range queries with 500 insert/s per client
- Legend for results is here.
- Each entry lists the percentage of responses that fit in that bucket (slower than max time for previous bucket, faster than min time for next bucket).
Query response time histogram
256us	1ms	4ms	16ms	64ms	256ms	1s	4s	16s	gt	max	tag
99.837	0.159	0.004	nonzero	nonzero	0.000	0.000	0.000	0.000	0.000	0.016	pg1211.cx7
99.839	0.156	0.004	nonzero	0.000	0.000	0.000	0.000	0.000	0.000	0.012	pg137.cx7
99.794	0.201	0.004	nonzero	nonzero	0.000	0.000	0.000	0.000	0.000	0.038	pg146.cx7
99.817	0.178	0.004	nonzero	nonzero	0.000	0.000	0.000	0.000	0.000	0.029	pg151.cx7
Insert response time histogram
256us	1ms	4ms	16ms	64ms	256ms	1s	4s	16s	gt	max	tag
0.000	0.000	0.000	67.254	31.353	1.393	0.000	0.000	0.000	0.000	0.223	pg1211.cx7
0.000	0.000	0.000	68.171	30.550	1.274	0.006	0.000	0.000	0.000	0.394	pg137.cx7
0.000	0.000	0.000	66.201	32.451	1.347	0.000	0.000	0.000	0.000	0.147	pg146.cx7
0.000	0.000	0.000	66.165	32.599	1.236	0.000	0.000	0.000	0.000	0.137	pg151.cx7
q1000.1
- q1000.1: range queries with 1000 insert/s per client
- Legend for results is here.
- Each entry lists the percentage of responses that fit in that bucket (slower than max time for previous bucket, faster than min time for next bucket).
Query response time histogram
256us	1ms	4ms	16ms	64ms	256ms	1s	4s	16s	gt	max	tag
99.741	0.252	0.006	0.001	nonzero	0.000	0.000	0.000	0.000	0.000	0.045	pg1211.cx7
99.744	0.250	0.006	0.001	nonzero	0.000	0.000	0.000	0.000	0.000	0.054	pg137.cx7
99.654	0.338	0.007	0.001	nonzero	nonzero	0.000	0.000	0.000	0.000	0.128	pg146.cx7
99.682	0.311	0.006	0.001	nonzero	nonzero	0.000	0.000	0.000	0.000	0.125	pg151.cx7
Insert response time histogram
256us	1ms	4ms	16ms	64ms	256ms	1s	4s	16s	gt	max	tag
0.000	0.000	0.000	69.480	26.919	3.578	0.023	0.000	0.000	0.000	0.396	pg1211.cx7
0.000	0.000	0.000	69.938	26.861	3.181	0.019	0.000	0.000	0.000	0.391	pg137.cx7
0.000	0.000	0.000	62.815	33.451	3.698	0.036	0.000	0.000	0.000	0.349	pg146.cx7
0.000	0.000	0.000	62.379	34.058	3.552	0.011	0.000	0.000	0.000	0.301	pg151.cx7