Introduction
This is a report for the insert benchmark with 500M docs and 1 client(s). It is generated by scripts (bash, awk, sed) and Tufte might not be impressed. An overview of the insert benchmark is here and a short update is here. Below, by DBMS, I mean DBMS+version.config. An example is my8020.c10b40 where my means MySQL, 8020 is version 8.0.20 and c10b40 is the name for the configuration file.
The test server has 8 AMD cores, 16G RAM and an NVMe SSD. It is described here as the Beelink. The benchmark was run with 1 clients and there were 1 or 2 connections per client (1 for queries, 1 for inserts). The benchmark loads 500M rows without secondary indexes, creates secondary indexes, loads another 10M rows then does 3 read+write tests for one hour each that do queries as fast as possible with 100, 500 and then 1000 writes/second/client concurrent with the queries. The database doesn't fit in memory and parts of the benchmark are IO-bound. Clients and the DBMS share one server. The per-database configs are in the per-database subdirectories here.
The tested DBMS are:
- pg1211.cx7 - Postgres 12.11 and the cx7 config
- pg137.cx7 - Postgres 13.7 and the cx7 config
- pg146.cx7 - Postgres 14.6 and the cx7 config
- pg151.cx7 - Postgres 15.1 and the cx7 config
Contents
- Summary
- l.i0: load without secondary indexes
- l.x: create secondary indexes
- l.i1: continue load after secondary indexes created
- q100.1: range queries with 100 insert/s per client
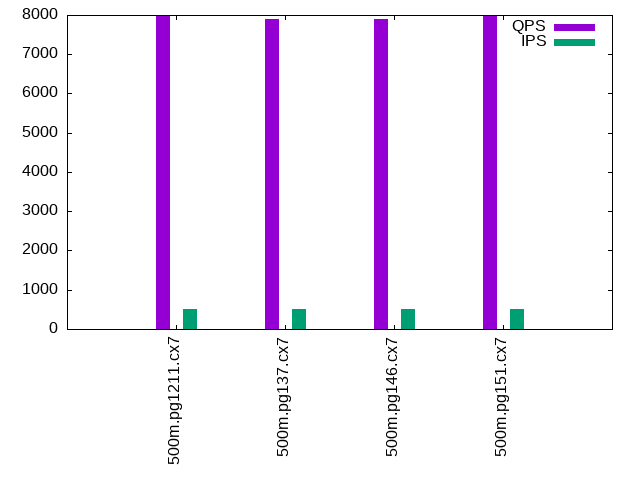
- q500.1: range queries with 500 insert/s per client
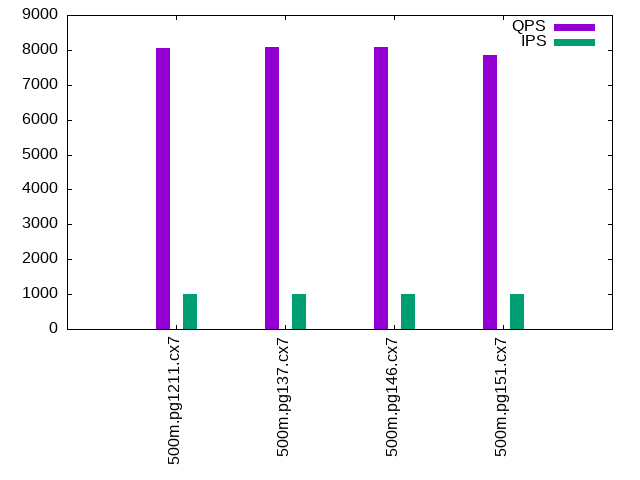
- q1000.1: range queries with 1000 insert/s per client
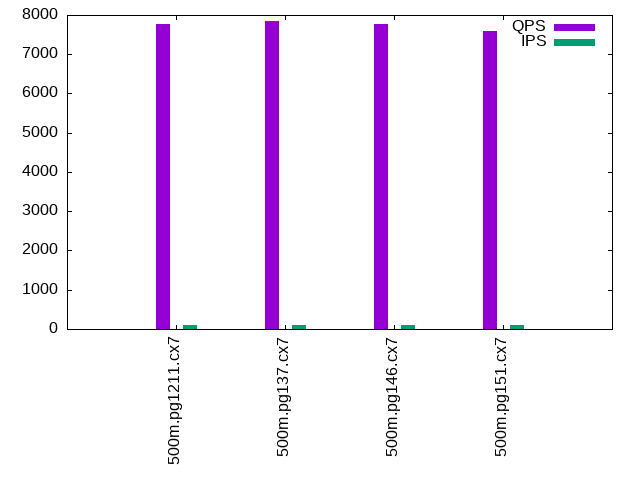
Summary
The numbers are inserts/s for l.i0 and l.i1, indexed docs (or rows) /s for l.x and queries/s for q*.2. The values are the average rate over the entire test for inserts (IPS) and queries (QPS). The range of values for IPS and QPS is split into 3 parts: bottom 25%, middle 50%, top 25%. Values in the bottom 25% have a red background, values in the top 25% have a green background and values in the middle have no color. A gray background is used for values that can be ignored because the DBMS did not sustain the target insert rate. Red backgrounds are not used when the minimum value is within 80% of the max value.
| dbms | l.i0 | l.x | l.i1 | q100.1 | q500.1 | q1000.1 |
|---|---|---|---|---|---|---|
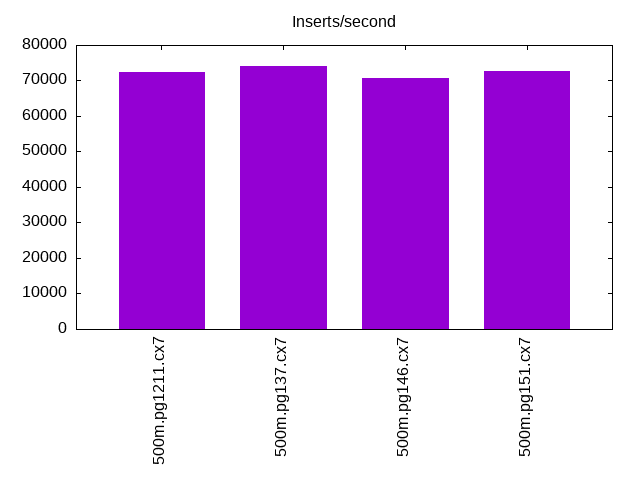
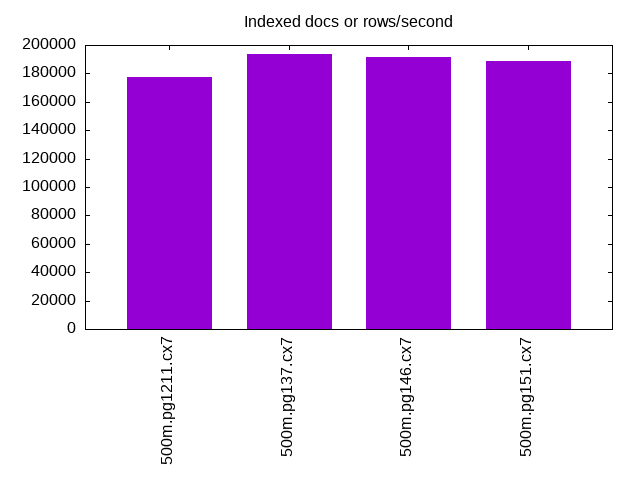
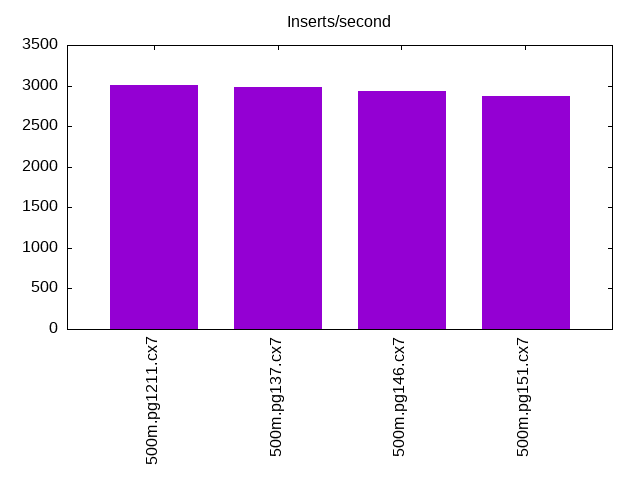
| 500m.pg1211.cx7 | 72338 | 177718 | 3004 | 7770 | 7988 | 8056 |
| 500m.pg137.cx7 | 74074 | 193313 | 2985 | 7851 | 7907 | 8082 |
| 500m.pg146.cx7 | 70671 | 191243 | 2928 | 7760 | 7904 | 8091 |
| 500m.pg151.cx7 | 72770 | 188717 | 2866 | 7602 | 7993 | 7854 |
This lists the average rate of inserts/s for the tests that do inserts concurrent with queries. For such tests the query rate is listed in the table above. The read+write tests are setup so that the insert rate should match the target rate every second. Cells that are not at least 95% of the target have a red background to indicate a failure to satisfy the target.
| dbms | q100.1 | q500.1 | q1000.1 |
|---|---|---|---|
| pg1211.cx7 | 100 | 499 | 999 |
| pg137.cx7 | 100 | 499 | 998 |
| pg146.cx7 | 100 | 499 | 998 |
| pg151.cx7 | 100 | 499 | 999 |
| target | 100 | 500 | 1000 |
l.i0
l.i0: load without secondary indexes. Graphs for performance per 1-second interval are here.
Average throughput:
Insert response time histogram: each cell has the percentage of responses that take <= the time in the header and max is the max response time in seconds. For the max column values in the top 25% of the range have a red background and in the bottom 25% of the range have a green background. The red background is not used when the min value is within 80% of the max value.
| dbms | 256us | 1ms | 4ms | 16ms | 64ms | 256ms | 1s | 4s | 16s | gt | max |
|---|---|---|---|---|---|---|---|---|---|---|---|
| pg1211.cx7 | 99.999 | nonzero | nonzero | 0.031 | |||||||
| pg137.cx7 | 99.999 | nonzero | nonzero | nonzero | nonzero | 0.382 | |||||
| pg146.cx7 | 99.999 | nonzero | nonzero | nonzero | 0.076 | ||||||
| pg151.cx7 | 99.999 | nonzero | nonzero | 0.048 |
Performance metrics for the DBMS listed above. Some are normalized by throughput, others are not. Legend for results is here.
ips	qps	rps	rmbps	wps	wmbps	rpq	rkbpq	wpi	wkbpi	csps	cpups	cspq	cpupq	dbgb1	dbgb2	rss	maxop	p50	p99	tag
72338	0	34	0.3	197.2	27.7	0.000	0.004	0.003	0.393	9200	24.0	0.127	27	47.8	53.6	0.0	0.031	72418	71221	500m.pg1211.cx7
74074	0	30	0.2	183.8	37.0	0.000	0.003	0.002	0.511	9500	24.2	0.128	26	47.8	60.6	0.0	0.382	74118	72920	500m.pg137.cx7
70671	0	29	0.2	166.1	33.0	0.000	0.003	0.002	0.479	9062	23.3	0.128	26	47.8	61.2	0.0	0.076	70819	69653	500m.pg146.cx7
72770	0	30	0.2	175.3	35.0	0.000	0.003	0.002	0.493	9278	23.3	0.128	26	47.8	61.8	0.0	0.048	72818	71819	500m.pg151.cx7
l.x
l.x: create secondary indexes.
Average throughput:
Performance metrics for the DBMS listed above. Some are normalized by throughput, others are not. Legend for results is here.
ips	qps	rps	rmbps	wps	wmbps	rpq	rkbpq	wpi	wkbpi	csps	cpups	cspq	cpupq	dbgb1	dbgb2	rss	maxop	p50	p99	tag
177718	0	463	55.6	528.5	83.2	0.003	0.320	0.003	0.479	743	12.1	0.004	5	91.9	112.7	0.0	0.004	NA	NA	500m.pg1211.cx7
193313	0	478	59.0	261.5	59.7	0.002	0.312	0.001	0.316	646	12.1	0.003	5	91.9	105.2	0.0	0.007	NA	NA	500m.pg137.cx7
191243	0	473	58.4	276.8	62.6	0.002	0.313	0.001	0.335	654	12.0	0.003	5	91.9	108.6	0.0	0.004	NA	NA	500m.pg146.cx7
188717	0	522	64.6	306.4	69.7	0.003	0.350	0.002	0.378	765	11.8	0.004	5	91.9	113.2	0.0	0.005	NA	NA	500m.pg151.cx7
l.i1
l.i1: continue load after secondary indexes created. Graphs for performance per 1-second interval are here.
Average throughput:
Insert response time histogram: each cell has the percentage of responses that take <= the time in the header and max is the max response time in seconds. For the max column values in the top 25% of the range have a red background and in the bottom 25% of the range have a green background. The red background is not used when the min value is within 80% of the max value.
| dbms | 256us | 1ms | 4ms | 16ms | 64ms | 256ms | 1s | 4s | 16s | gt | max |
|---|---|---|---|---|---|---|---|---|---|---|---|
| pg1211.cx7 | 74.099 | 23.864 | 2.028 | 0.008 | 0.001 | 1.267 | |||||
| pg137.cx7 | 73.984 | 23.796 | 2.209 | 0.010 | 0.001 | 1.313 | |||||
| pg146.cx7 | 72.549 | 25.128 | 2.315 | 0.007 | 0.001 | 1.313 | |||||
| pg151.cx7 | 71.061 | 26.470 | 2.463 | 0.006 | 0.001 | 1.323 |
Performance metrics for the DBMS listed above. Some are normalized by throughput, others are not. Legend for results is here.
ips	qps	rps	rmbps	wps	wmbps	rpq	rkbpq	wpi	wkbpi	csps	cpups	cspq	cpupq	dbgb1	dbgb2	rss	maxop	p50	p99	tag
3004	0	4016	32.0	5071.8	79.6	1.337	10.911	1.688	27.144	9682	5.7	3.223	152	93.6	116.9	0.0	1.267	3246	949	500m.pg1211.cx7
2985	0	4021	32.1	5136.5	79.6	1.347	10.997	1.721	27.318	9734	5.7	3.261	153	93.6	113.1	0.0	1.313	3196	1049	500m.pg137.cx7
2928	0	3949	31.5	5000.8	78.3	1.349	11.006	1.708	27.393	9492	5.4	3.242	148	93.6	120.8	0.0	1.313	3196	1249	500m.pg146.cx7
2866	0	3873	30.9	4911.3	76.2	1.351	11.027	1.714	27.239	9288	5.3	3.241	148	93.6	121.7	0.0	1.323	3047	1148	500m.pg151.cx7
q100.1
q100.1: range queries with 100 insert/s per client. Graphs for performance per 1-second interval are here.
Average throughput:
Query response time histogram: each cell has the percentage of responses that take <= the time in the header and max is the max response time in seconds. For max values in the top 25% of the range have a red background and in the bottom 25% of the range have a green background. The red background is not used when the min value is within 80% of the max value.
| dbms | 256us | 1ms | 4ms | 16ms | 64ms | 256ms | 1s | 4s | 16s | gt | max |
|---|---|---|---|---|---|---|---|---|---|---|---|
| pg1211.cx7 | 99.727 | 0.271 | 0.001 | 0.001 | nonzero | 0.021 | |||||
| pg137.cx7 | 99.769 | 0.229 | 0.002 | 0.001 | nonzero | 0.035 | |||||
| pg146.cx7 | 99.746 | 0.250 | 0.003 | 0.001 | nonzero | 0.052 | |||||
| pg151.cx7 | 99.777 | 0.219 | 0.003 | 0.001 | nonzero | 0.061 |
Insert response time histogram: each cell has the percentage of responses that take <= the time in the header and max is the max response time in seconds. For max values in the top 25% of the range have a red background and in the bottom 25% of the range have a green background. The red background is not used when the min value is within 80% of the max value.
| dbms | 256us | 1ms | 4ms | 16ms | 64ms | 256ms | 1s | 4s | 16s | gt | max |
|---|---|---|---|---|---|---|---|---|---|---|---|
| pg1211.cx7 | 85.153 | 14.847 | 0.049 | ||||||||
| pg137.cx7 | 93.042 | 6.931 | 0.028 | 0.084 | |||||||
| pg146.cx7 | 91.194 | 8.806 | 0.064 | ||||||||
| pg151.cx7 | 91.625 | 8.319 | 0.056 | 0.082 |
Performance metrics for the DBMS listed above. Some are normalized by throughput, others are not. Legend for results is here.
ips	qps	rps	rmbps	wps	wmbps	rpq	rkbpq	wpi	wkbpi	csps	cpups	cspq	cpupq	dbgb1	dbgb2	rss	maxop	p50	p99	tag
100	7770	147	1.2	269.9	4.2	0.019	0.154	2.704	42.851	30552	13.6	3.932	140	93.7	117.7	0.0	0.021	7543	6567	500m.pg1211.cx7
100	7851	151	1.2	389.7	5.3	0.019	0.158	3.905	54.555	30847	13.3	3.929	136	93.7	106.3	0.0	0.035	7655	6790	500m.pg137.cx7
100	7760	151	1.2	407.8	5.5	0.019	0.160	4.086	55.947	30429	13.0	3.921	134	93.7	114.4	0.0	0.052	7623	6167	500m.pg146.cx7
100	7602	151	1.2	412.3	5.5	0.020	0.162	4.131	55.974	29742	12.9	3.912	136	93.7	114.6	0.0	0.061	7495	6568	500m.pg151.cx7
q500.1
q500.1: range queries with 500 insert/s per client. Graphs for performance per 1-second interval are here.
Average throughput:
Query response time histogram: each cell has the percentage of responses that take <= the time in the header and max is the max response time in seconds. For max values in the top 25% of the range have a red background and in the bottom 25% of the range have a green background. The red background is not used when the min value is within 80% of the max value.
| dbms | 256us | 1ms | 4ms | 16ms | 64ms | 256ms | 1s | 4s | 16s | gt | max |
|---|---|---|---|---|---|---|---|---|---|---|---|
| pg1211.cx7 | 99.938 | 0.062 | nonzero | nonzero | 0.006 | ||||||
| pg137.cx7 | 99.941 | 0.058 | nonzero | nonzero | 0.006 | ||||||
| pg146.cx7 | 99.950 | 0.050 | nonzero | nonzero | 0.010 | ||||||
| pg151.cx7 | 99.945 | 0.054 | nonzero | nonzero | 0.007 |
Insert response time histogram: each cell has the percentage of responses that take <= the time in the header and max is the max response time in seconds. For max values in the top 25% of the range have a red background and in the bottom 25% of the range have a green background. The red background is not used when the min value is within 80% of the max value.
| dbms | 256us | 1ms | 4ms | 16ms | 64ms | 256ms | 1s | 4s | 16s | gt | max |
|---|---|---|---|---|---|---|---|---|---|---|---|
| pg1211.cx7 | 84.003 | 15.903 | 0.094 | 0.146 | |||||||
| pg137.cx7 | 86.683 | 13.281 | 0.036 | 0.097 | |||||||
| pg146.cx7 | 83.464 | 16.489 | 0.047 | 0.076 | |||||||
| pg151.cx7 | 84.000 | 15.936 | 0.064 | 0.096 |
Performance metrics for the DBMS listed above. Some are normalized by throughput, others are not. Legend for results is here.
ips	qps	rps	rmbps	wps	wmbps	rpq	rkbpq	wpi	wkbpi	csps	cpups	cspq	cpupq	dbgb1	dbgb2	rss	maxop	p50	p99	tag
499	7988	642	5.1	1072.4	17.9	0.080	0.651	2.148	36.710	32490	14.4	4.067	144	93.9	100.5	0.0	0.006	7627	7510	500m.pg1211.cx7
499	7907	644	5.1	1075.8	17.9	0.081	0.659	2.155	36.738	32178	14.2	4.070	144	93.9	98.9	0.0	0.006	7671	7541	500m.pg137.cx7
499	7904	644	5.1	1004.8	17.2	0.081	0.660	2.012	35.224	32109	14.0	4.062	142	93.9	100.8	0.0	0.010	7591	7499	500m.pg146.cx7
499	7993	644	5.1	1011.8	17.3	0.081	0.653	2.026	35.402	32336	14.1	4.046	141	93.9	100.6	0.0	0.007	7448	7287	500m.pg151.cx7
q1000.1
q1000.1: range queries with 1000 insert/s per client. Graphs for performance per 1-second interval are here.
Average throughput:
Query response time histogram: each cell has the percentage of responses that take <= the time in the header and max is the max response time in seconds. For max values in the top 25% of the range have a red background and in the bottom 25% of the range have a green background. The red background is not used when the min value is within 80% of the max value.
| dbms | 256us | 1ms | 4ms | 16ms | 64ms | 256ms | 1s | 4s | 16s | gt | max |
|---|---|---|---|---|---|---|---|---|---|---|---|
| pg1211.cx7 | 99.932 | 0.067 | nonzero | nonzero | nonzero | 0.035 | |||||
| pg137.cx7 | 99.932 | 0.067 | nonzero | nonzero | 0.009 | ||||||
| pg146.cx7 | 99.941 | 0.058 | nonzero | nonzero | 0.009 | ||||||
| pg151.cx7 | 99.938 | 0.062 | nonzero | nonzero | nonzero | 0.038 |
Insert response time histogram: each cell has the percentage of responses that take <= the time in the header and max is the max response time in seconds. For max values in the top 25% of the range have a red background and in the bottom 25% of the range have a green background. The red background is not used when the min value is within 80% of the max value.
| dbms | 256us | 1ms | 4ms | 16ms | 64ms | 256ms | 1s | 4s | 16s | gt | max |
|---|---|---|---|---|---|---|---|---|---|---|---|
| pg1211.cx7 | 82.094 | 17.428 | 0.476 | 0.001 | 0.336 | ||||||
| pg137.cx7 | 82.740 | 16.810 | 0.447 | 0.003 | 0.303 | ||||||
| pg146.cx7 | 79.589 | 19.917 | 0.492 | 0.003 | 0.288 | ||||||
| pg151.cx7 | 78.961 | 20.556 | 0.483 | 0.244 |
Performance metrics for the DBMS listed above. Some are normalized by throughput, others are not. Legend for results is here.
ips	qps	rps	rmbps	wps	wmbps	rpq	rkbpq	wpi	wkbpi	csps	cpups	cspq	cpupq	dbgb1	dbgb2	rss	maxop	p50	p99	tag
999	8056	1329	10.5	1834.6	32.8	0.165	1.340	1.837	33.616	34265	15.9	4.253	158	94.9	102.3	0.0	0.035	7623	7463	500m.pg1211.cx7
998	8082	1330	10.6	1837.2	33.2	0.165	1.337	1.840	34.028	34400	15.8	4.256	156	94.9	102.3	0.0	0.009	7655	7544	500m.pg137.cx7
998	8091	1330	10.6	1824.1	32.0	0.164	1.338	1.827	32.864	34402	15.4	4.252	152	94.9	104.0	0.0	0.009	7671	7559	500m.pg146.cx7
999	7854	1331	10.6	1844.0	32.4	0.169	1.379	1.846	33.209	33462	15.3	4.260	156	94.9	104.0	0.0	0.038	7465	7335	500m.pg151.cx7
l.i0
l.i0: load without secondary indexes
Performance metrics for all DBMS, not just the ones listed above. Some are normalized by throughput, others are not. Legend for results is here.
ips	qps	rps	rmbps	wps	wmbps	rpq	rkbpq	wpi	wkbpi	csps	cpups	cspq	cpupq	dbgb1	dbgb2	rss	maxop	p50	p99	tag
72338	0	34	0.3	197.2	27.7	0.000	0.004	0.003	0.393	9200	24.0	0.127	27	47.8	53.6	0.0	0.031	72418	71221	500m.pg1211.cx7
74074	0	30	0.2	183.8	37.0	0.000	0.003	0.002	0.511	9500	24.2	0.128	26	47.8	60.6	0.0	0.382	74118	72920	500m.pg137.cx7
70671	0	29	0.2	166.1	33.0	0.000	0.003	0.002	0.479	9062	23.3	0.128	26	47.8	61.2	0.0	0.076	70819	69653	500m.pg146.cx7
72770	0	30	0.2	175.3	35.0	0.000	0.003	0.002	0.493	9278	23.3	0.128	26	47.8	61.8	0.0	0.048	72818	71819	500m.pg151.cx7
l.x
l.x: create secondary indexes
Performance metrics for all DBMS, not just the ones listed above. Some are normalized by throughput, others are not. Legend for results is here.
ips	qps	rps	rmbps	wps	wmbps	rpq	rkbpq	wpi	wkbpi	csps	cpups	cspq	cpupq	dbgb1	dbgb2	rss	maxop	p50	p99	tag
177718	0	463	55.6	528.5	83.2	0.003	0.320	0.003	0.479	743	12.1	0.004	5	91.9	112.7	0.0	0.004	NA	NA	500m.pg1211.cx7
193313	0	478	59.0	261.5	59.7	0.002	0.312	0.001	0.316	646	12.1	0.003	5	91.9	105.2	0.0	0.007	NA	NA	500m.pg137.cx7
191243	0	473	58.4	276.8	62.6	0.002	0.313	0.001	0.335	654	12.0	0.003	5	91.9	108.6	0.0	0.004	NA	NA	500m.pg146.cx7
188717	0	522	64.6	306.4	69.7	0.003	0.350	0.002	0.378	765	11.8	0.004	5	91.9	113.2	0.0	0.005	NA	NA	500m.pg151.cx7
l.i1
l.i1: continue load after secondary indexes created
Performance metrics for all DBMS, not just the ones listed above. Some are normalized by throughput, others are not. Legend for results is here.
ips	qps	rps	rmbps	wps	wmbps	rpq	rkbpq	wpi	wkbpi	csps	cpups	cspq	cpupq	dbgb1	dbgb2	rss	maxop	p50	p99	tag
3004	0	4016	32.0	5071.8	79.6	1.337	10.911	1.688	27.144	9682	5.7	3.223	152	93.6	116.9	0.0	1.267	3246	949	500m.pg1211.cx7
2985	0	4021	32.1	5136.5	79.6	1.347	10.997	1.721	27.318	9734	5.7	3.261	153	93.6	113.1	0.0	1.313	3196	1049	500m.pg137.cx7
2928	0	3949	31.5	5000.8	78.3	1.349	11.006	1.708	27.393	9492	5.4	3.242	148	93.6	120.8	0.0	1.313	3196	1249	500m.pg146.cx7
2866	0	3873	30.9	4911.3	76.2	1.351	11.027	1.714	27.239	9288	5.3	3.241	148	93.6	121.7	0.0	1.323	3047	1148	500m.pg151.cx7
q100.1
q100.1: range queries with 100 insert/s per client
Performance metrics for all DBMS, not just the ones listed above. Some are normalized by throughput, others are not. Legend for results is here.
ips	qps	rps	rmbps	wps	wmbps	rpq	rkbpq	wpi	wkbpi	csps	cpups	cspq	cpupq	dbgb1	dbgb2	rss	maxop	p50	p99	tag
100	7770	147	1.2	269.9	4.2	0.019	0.154	2.704	42.851	30552	13.6	3.932	140	93.7	117.7	0.0	0.021	7543	6567	500m.pg1211.cx7
100	7851	151	1.2	389.7	5.3	0.019	0.158	3.905	54.555	30847	13.3	3.929	136	93.7	106.3	0.0	0.035	7655	6790	500m.pg137.cx7
100	7760	151	1.2	407.8	5.5	0.019	0.160	4.086	55.947	30429	13.0	3.921	134	93.7	114.4	0.0	0.052	7623	6167	500m.pg146.cx7
100	7602	151	1.2	412.3	5.5	0.020	0.162	4.131	55.974	29742	12.9	3.912	136	93.7	114.6	0.0	0.061	7495	6568	500m.pg151.cx7
q500.1
q500.1: range queries with 500 insert/s per client
Performance metrics for all DBMS, not just the ones listed above. Some are normalized by throughput, others are not. Legend for results is here.
ips	qps	rps	rmbps	wps	wmbps	rpq	rkbpq	wpi	wkbpi	csps	cpups	cspq	cpupq	dbgb1	dbgb2	rss	maxop	p50	p99	tag
499	7988	642	5.1	1072.4	17.9	0.080	0.651	2.148	36.710	32490	14.4	4.067	144	93.9	100.5	0.0	0.006	7627	7510	500m.pg1211.cx7
499	7907	644	5.1	1075.8	17.9	0.081	0.659	2.155	36.738	32178	14.2	4.070	144	93.9	98.9	0.0	0.006	7671	7541	500m.pg137.cx7
499	7904	644	5.1	1004.8	17.2	0.081	0.660	2.012	35.224	32109	14.0	4.062	142	93.9	100.8	0.0	0.010	7591	7499	500m.pg146.cx7
499	7993	644	5.1	1011.8	17.3	0.081	0.653	2.026	35.402	32336	14.1	4.046	141	93.9	100.6	0.0	0.007	7448	7287	500m.pg151.cx7
q1000.1
q1000.1: range queries with 1000 insert/s per client
Performance metrics for all DBMS, not just the ones listed above. Some are normalized by throughput, others are not. Legend for results is here.
ips	qps	rps	rmbps	wps	wmbps	rpq	rkbpq	wpi	wkbpi	csps	cpups	cspq	cpupq	dbgb1	dbgb2	rss	maxop	p50	p99	tag
999	8056	1329	10.5	1834.6	32.8	0.165	1.340	1.837	33.616	34265	15.9	4.253	158	94.9	102.3	0.0	0.035	7623	7463	500m.pg1211.cx7
998	8082	1330	10.6	1837.2	33.2	0.165	1.337	1.840	34.028	34400	15.8	4.256	156	94.9	102.3	0.0	0.009	7655	7544	500m.pg137.cx7
998	8091	1330	10.6	1824.1	32.0	0.164	1.338	1.827	32.864	34402	15.4	4.252	152	94.9	104.0	0.0	0.009	7671	7559	500m.pg146.cx7
999	7854	1331	10.6	1844.0	32.4	0.169	1.379	1.846	33.209	33462	15.3	4.260	156	94.9	104.0	0.0	0.038	7465	7335	500m.pg151.cx7
l.i0
- l.i0: load without secondary indexes
- Legend for results is here.
- Each entry lists the percentage of responses that fit in that bucket (slower than max time for previous bucket, faster than min time for next bucket).
Insert response time histogram
256us	1ms	4ms	16ms	64ms	256ms	1s	4s	16s	gt	max	tag
0.000	0.000	99.999	nonzero	nonzero	0.000	0.000	0.000	0.000	0.000	0.031	pg1211.cx7
0.000	0.000	99.999	nonzero	nonzero	nonzero	nonzero	0.000	0.000	0.000	0.382	pg137.cx7
0.000	0.000	99.999	nonzero	nonzero	nonzero	0.000	0.000	0.000	0.000	0.076	pg146.cx7
0.000	0.000	99.999	nonzero	nonzero	0.000	0.000	0.000	0.000	0.000	0.048	pg151.cx7
l.x
- l.x: create secondary indexes
- Legend for results is here.
- Each entry lists the percentage of responses that fit in that bucket (slower than max time for previous bucket, faster than min time for next bucket).
TODO - determine whether there is data for create index response time
l.i1
- l.i1: continue load after secondary indexes created
- Legend for results is here.
- Each entry lists the percentage of responses that fit in that bucket (slower than max time for previous bucket, faster than min time for next bucket).
Insert response time histogram
256us	1ms	4ms	16ms	64ms	256ms	1s	4s	16s	gt	max	tag
0.000	0.000	0.000	74.099	23.864	2.028	0.008	0.001	0.000	0.000	1.267	pg1211.cx7
0.000	0.000	0.000	73.984	23.796	2.209	0.010	0.001	0.000	0.000	1.313	pg137.cx7
0.000	0.000	0.000	72.549	25.128	2.315	0.007	0.001	0.000	0.000	1.313	pg146.cx7
0.000	0.000	0.000	71.061	26.470	2.463	0.006	0.001	0.000	0.000	1.323	pg151.cx7
q100.1
- q100.1: range queries with 100 insert/s per client
- Legend for results is here.
- Each entry lists the percentage of responses that fit in that bucket (slower than max time for previous bucket, faster than min time for next bucket).
Query response time histogram
256us	1ms	4ms	16ms	64ms	256ms	1s	4s	16s	gt	max	tag
99.727	0.271	0.001	0.001	nonzero	0.000	0.000	0.000	0.000	0.000	0.021	pg1211.cx7
99.769	0.229	0.002	0.001	nonzero	0.000	0.000	0.000	0.000	0.000	0.035	pg137.cx7
99.746	0.250	0.003	0.001	nonzero	0.000	0.000	0.000	0.000	0.000	0.052	pg146.cx7
99.777	0.219	0.003	0.001	nonzero	0.000	0.000	0.000	0.000	0.000	0.061	pg151.cx7
Insert response time histogram
256us	1ms	4ms	16ms	64ms	256ms	1s	4s	16s	gt	max	tag
0.000	0.000	0.000	85.153	14.847	0.000	0.000	0.000	0.000	0.000	0.049	pg1211.cx7
0.000	0.000	0.000	93.042	6.931	0.028	0.000	0.000	0.000	0.000	0.084	pg137.cx7
0.000	0.000	0.000	91.194	8.806	0.000	0.000	0.000	0.000	0.000	0.064	pg146.cx7
0.000	0.000	0.000	91.625	8.319	0.056	0.000	0.000	0.000	0.000	0.082	pg151.cx7
q500.1
- q500.1: range queries with 500 insert/s per client
- Legend for results is here.
- Each entry lists the percentage of responses that fit in that bucket (slower than max time for previous bucket, faster than min time for next bucket).
Query response time histogram
256us	1ms	4ms	16ms	64ms	256ms	1s	4s	16s	gt	max	tag
99.938	0.062	nonzero	nonzero	0.000	0.000	0.000	0.000	0.000	0.000	0.006	pg1211.cx7
99.941	0.058	nonzero	nonzero	0.000	0.000	0.000	0.000	0.000	0.000	0.006	pg137.cx7
99.950	0.050	nonzero	nonzero	0.000	0.000	0.000	0.000	0.000	0.000	0.010	pg146.cx7
99.945	0.054	nonzero	nonzero	0.000	0.000	0.000	0.000	0.000	0.000	0.007	pg151.cx7
Insert response time histogram
256us	1ms	4ms	16ms	64ms	256ms	1s	4s	16s	gt	max	tag
0.000	0.000	0.000	84.003	15.903	0.094	0.000	0.000	0.000	0.000	0.146	pg1211.cx7
0.000	0.000	0.000	86.683	13.281	0.036	0.000	0.000	0.000	0.000	0.097	pg137.cx7
0.000	0.000	0.000	83.464	16.489	0.047	0.000	0.000	0.000	0.000	0.076	pg146.cx7
0.000	0.000	0.000	84.000	15.936	0.064	0.000	0.000	0.000	0.000	0.096	pg151.cx7
q1000.1
- q1000.1: range queries with 1000 insert/s per client
- Legend for results is here.
- Each entry lists the percentage of responses that fit in that bucket (slower than max time for previous bucket, faster than min time for next bucket).
Query response time histogram
256us	1ms	4ms	16ms	64ms	256ms	1s	4s	16s	gt	max	tag
99.932	0.067	nonzero	nonzero	nonzero	0.000	0.000	0.000	0.000	0.000	0.035	pg1211.cx7
99.932	0.067	nonzero	nonzero	0.000	0.000	0.000	0.000	0.000	0.000	0.009	pg137.cx7
99.941	0.058	nonzero	nonzero	0.000	0.000	0.000	0.000	0.000	0.000	0.009	pg146.cx7
99.938	0.062	nonzero	nonzero	nonzero	0.000	0.000	0.000	0.000	0.000	0.038	pg151.cx7
Insert response time histogram
256us	1ms	4ms	16ms	64ms	256ms	1s	4s	16s	gt	max	tag
0.000	0.000	0.000	82.094	17.428	0.476	0.001	0.000	0.000	0.000	0.336	pg1211.cx7
0.000	0.000	0.000	82.740	16.810	0.447	0.003	0.000	0.000	0.000	0.303	pg137.cx7
0.000	0.000	0.000	79.589	19.917	0.492	0.003	0.000	0.000	0.000	0.288	pg146.cx7
0.000	0.000	0.000	78.961	20.556	0.483	0.000	0.000	0.000	0.000	0.244	pg151.cx7