Introduction
This is a report for the insert benchmark with 500M docs and 4 client(s). It is generated by scripts (bash, awk, sed) and Tufte might not be impressed. An overview of the insert benchmark is here and a short update is here. Below, by DBMS, I mean DBMS+version.config. An example is my8020.c10b40 where my means MySQL, 8020 is version 8.0.20 and c10b40 is the name for the configuration file.
The test server has 8 AMD cores, 16G RAM and an NVMe SSD. It is described here as the Beelink. The benchmark was run with 4 clients and there were 1 or 2 connections per client (1 for queries, 1 for inserts). The benchmark loads 500M rows without secondary indexes, creates secondary indexes, loads another 10M rows then does 3 read+write tests for one hour each that do queries as fast as possible with 100, 500 and then 1000 writes/second/client concurrent with the queries. The database doesn't fit in memory and parts of the benchmark are IO-bound. Clients and the DBMS share one server. The per-database configs are in the per-database subdirectories here.
The tested DBMS are:
- my5651.cy8 - MySQL 5.6.51, InnoDB and the cy8 config
- my5739.cy8 - MySQL 5.7.39, InnoDB and the cy8 config
- my8031.cy8 - MySQL 8.0.31, InnoDB and the cy8 config
- fbmy5635.cay9c - FB MySQL 5.6.35, MyRocks and the cay9c config
- fbmy8028.cay9c - FB MySQL 8.0.28, MyRocks and the cay9c config
Contents
- Summary
- l.i0: load without secondary indexes
- l.x: create secondary indexes
- l.i1: continue load after secondary indexes created
- q100.1: range queries with 100 insert/s per client
- q500.1: range queries with 500 insert/s per client
- q1000.1: range queries with 1000 insert/s per client
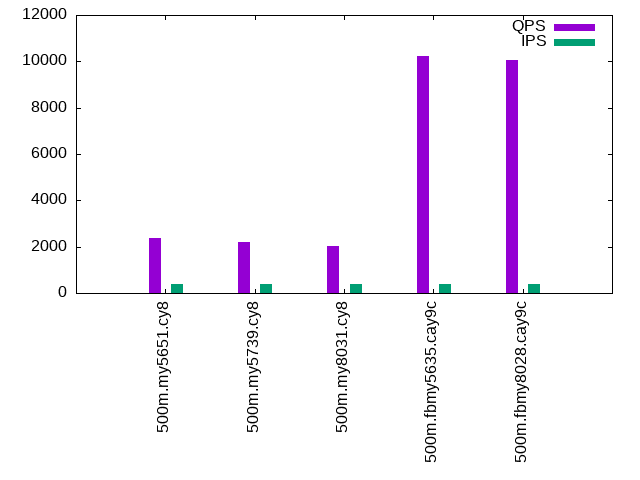
Summary
The numbers are inserts/s for l.i0 and l.i1, indexed docs (or rows) /s for l.x and queries/s for q*.2. The values are the average rate over the entire test for inserts (IPS) and queries (QPS). The range of values for IPS and QPS is split into 3 parts: bottom 25%, middle 50%, top 25%. Values in the bottom 25% have a red background, values in the top 25% have a green background and values in the middle have no color. A gray background is used for values that can be ignored because the DBMS did not sustain the target insert rate. Red backgrounds are not used when the minimum value is within 80% of the max value.
| dbms | l.i0 | l.x | l.i1 | q100.1 | q500.1 | q1000.1 |
|---|---|---|---|---|---|---|
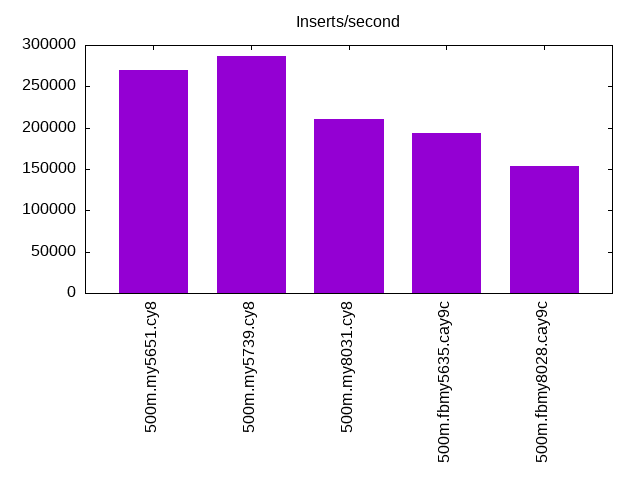
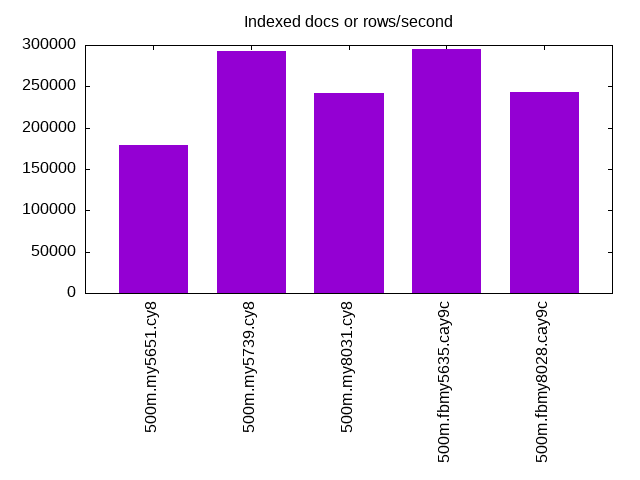
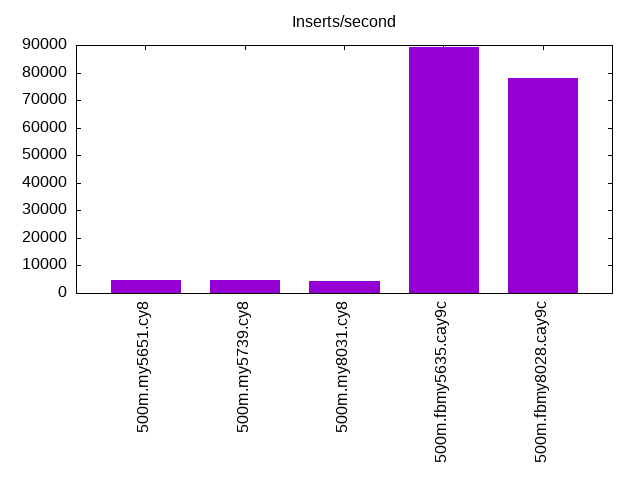
| 500m.my5651.cy8 | 269396 | 179440 | 4808 | 2355 | 1666 | 1087 |
| 500m.my5739.cy8 | 286862 | 293314 | 4792 | 2197 | 1686 | 1075 |
| 500m.my8031.cy8 | 210261 | 242532 | 4378 | 2048 | 1405 | 822 |
| 500m.fbmy5635.cay9c | 193199 | 294696 | 89286 | 10210 | 10572 | 10492 |
| 500m.fbmy8028.cay9c | 153092 | 242885 | 78125 | 10041 | 10111 | 10127 |
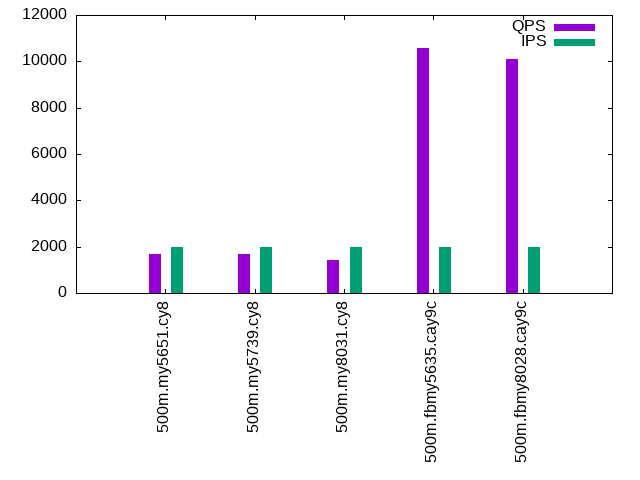
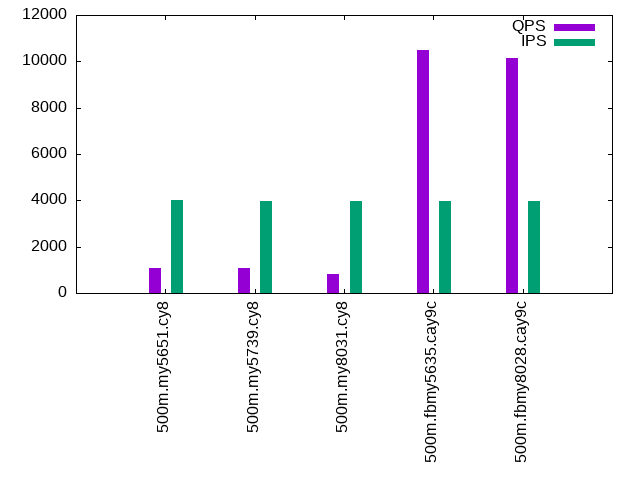
This lists the average rate of inserts/s for the tests that do inserts concurrent with queries. For such tests the query rate is listed in the table above. The read+write tests are setup so that the insert rate should match the target rate every second. Cells that are not at least 95% of the target have a red background to indicate a failure to satisfy the target.
| dbms | q100.1 | q500.1 | q1000.1 |
|---|---|---|---|
| my5651.cy8 | 399 | 1996 | 3993 |
| my5739.cy8 | 399 | 1996 | 3992 |
| my8031.cy8 | 399 | 1996 | 3992 |
| fbmy5635.cay9c | 399 | 1996 | 3992 |
| fbmy8028.cay9c | 399 | 1996 | 3992 |
| target | 400 | 2000 | 4000 |
l.i0
l.i0: load without secondary indexes. Graphs for performance per 1-second interval are here.
Average throughput:
Insert response time histogram: each cell has the percentage of responses that take <= the time in the header and max is the max response time in seconds. For the max column values in the top 25% of the range have a red background and in the bottom 25% of the range have a green background. The red background is not used when the min value is within 80% of the max value.
| dbms | 256us | 1ms | 4ms | 16ms | 64ms | 256ms | 1s | 4s | 16s | gt | max |
|---|---|---|---|---|---|---|---|---|---|---|---|
| my5651.cy8 | 0.361 | 98.933 | 0.479 | 0.205 | 0.021 | 0.001 | nonzero | 1.337 | |||
| my5739.cy8 | 0.013 | 99.743 | 0.209 | 0.018 | 0.015 | 0.002 | nonzero | 1.409 | |||
| my8031.cy8 | 99.657 | 0.279 | 0.038 | 0.026 | 0.001 | nonzero | 1.190 | ||||
| fbmy5635.cay9c | 99.853 | 0.124 | 0.006 | 0.011 | 0.005 | 0.603 | |||||
| fbmy8028.cay9c | 99.399 | 0.560 | 0.020 | 0.017 | 0.004 | 0.591 |
Performance metrics for the DBMS listed above. Some are normalized by throughput, others are not. Legend for results is here.
ips	qps	rps	rmbps	wps	wmbps	rpq	rkbpq	wpi	wkbpi	csps	cpups	cspq	cpupq	dbgb1	dbgb2	rss	maxop	p50	p99	tag
269396	0	2234	8.7	1121.6	86.7	0.008	0.033	0.004	0.329	33546	73.1	0.125	22	32.9	73.4	10.7	1.337	70024	32755	500m.my5651.cy8
286862	0	1	0.0	1214.8	92.8	0.000	0.000	0.004	0.331	32800	79.1	0.114	22	32.9	73.4	10.9	1.409	73521	49267	500m.my5739.cy8
210261	0	1	0.0	1370.7	79.9	0.000	0.000	0.007	0.389	24788	75.4	0.118	29	32.8	35.2	11.1	1.190	53762	41355	500m.my8031.cy8
193199	0	5	0.7	369.5	82.3	0.000	0.004	0.002	0.436	19967	79.0	0.103	33	15.7	16.1	4.2	0.603	49064	30866	500m.fbmy5635.cay9c
153092	0	2	0.3	305.0	66.8	0.000	0.002	0.002	0.447	16404	75.1	0.107	39	15.7	16.3	4.7	0.591	38860	25190	500m.fbmy8028.cay9c
l.x
l.x: create secondary indexes.
Average throughput:
Performance metrics for the DBMS listed above. Some are normalized by throughput, others are not. Legend for results is here.
ips	qps	rps	rmbps	wps	wmbps	rpq	rkbpq	wpi	wkbpi	csps	cpups	cspq	cpupq	dbgb1	dbgb2	rss	maxop	p50	p99	tag
179440	0	1570	141.9	4632.4	247.9	0.009	0.810	0.026	1.415	16918	37.1	0.094	17	67.8	108.3	10.5	0.051	NA	NA	500m.my5651.cy8
293314	0	1940	222.3	3829.1	295.1	0.007	0.776	0.013	1.030	15854	31.9	0.054	9	73.6	114.1	10.3	0.006	NA	NA	500m.my5739.cy8
242532	0	3761	312.6	4653.4	283.9	0.016	1.320	0.019	1.199	14699	61.9	0.061	20	73.3	75.8	10.4	0.009	NA	NA	500m.my8031.cy8
294696	0	382	64.6	201.1	44.3	0.001	0.224	0.001	0.154	1602	47.9	0.005	13	33.5	34.0	6.4	0.004	NA	NA	500m.fbmy5635.cay9c
242885	0	316	53.4	165.3	36.6	0.001	0.225	0.001	0.154	1429	48.4	0.006	16	33.5	34.1	8.3	0.006	NA	NA	500m.fbmy8028.cay9c
l.i1
l.i1: continue load after secondary indexes created. Graphs for performance per 1-second interval are here.
Average throughput:
Insert response time histogram: each cell has the percentage of responses that take <= the time in the header and max is the max response time in seconds. For the max column values in the top 25% of the range have a red background and in the bottom 25% of the range have a green background. The red background is not used when the min value is within 80% of the max value.
| dbms | 256us | 1ms | 4ms | 16ms | 64ms | 256ms | 1s | 4s | 16s | gt | max |
|---|---|---|---|---|---|---|---|---|---|---|---|
| my5651.cy8 | 19.488 | 55.211 | 13.350 | 7.899 | 3.667 | 0.386 | 3.017 | ||||
| my5739.cy8 | 3.574 | 74.609 | 9.963 | 6.736 | 4.817 | 0.301 | 1.788 | ||||
| my8031.cy8 | 0.053 | 70.489 | 13.548 | 10.877 | 4.947 | 0.085 | 2.285 | ||||
| fbmy5635.cay9c | 99.768 | 0.199 | 0.022 | 0.004 | 0.006 | 0.400 | |||||
| fbmy8028.cay9c | 98.989 | 0.949 | 0.045 | 0.018 | 0.125 |
Performance metrics for the DBMS listed above. Some are normalized by throughput, others are not. Legend for results is here.
ips	qps	rps	rmbps	wps	wmbps	rpq	rkbpq	wpi	wkbpi	csps	cpups	cspq	cpupq	dbgb1	dbgb2	rss	maxop	p50	p99	tag
4808	0	3002	46.0	4448.5	147.9	0.624	9.790	0.925	31.505	16287	10.0	3.388	166	107.1	151.1	10.5	3.017	250	0	500m.my5651.cy8
4792	0	2920	45.6	4217.5	143.7	0.609	9.750	0.880	30.702	15122	13.8	3.156	230	107.1	151.2	10.7	1.788	200	0	500m.my5739.cy8
4378	0	2710	42.3	5400.7	155.6	0.619	9.904	1.234	36.393	21330	16.1	4.872	294	106.8	112.6	10.7	2.285	250	50	500m.my8031.cy8
89286	0	2	0.3	314.1	70.4	0.000	0.003	0.004	0.807	20068	68.0	0.225	61	35.2	36.9	6.6	0.400	23474	14534	500m.fbmy5635.cay9c
78125	0	8	1.0	301.8	66.7	0.000	0.013	0.004	0.874	16918	70.4	0.217	72	34.8	36.6	6.9	0.125	20385	12586	500m.fbmy8028.cay9c
q100.1
q100.1: range queries with 100 insert/s per client. Graphs for performance per 1-second interval are here.
Average throughput:
Query response time histogram: each cell has the percentage of responses that take <= the time in the header and max is the max response time in seconds. For max values in the top 25% of the range have a red background and in the bottom 25% of the range have a green background. The red background is not used when the min value is within 80% of the max value.
| dbms | 256us | 1ms | 4ms | 16ms | 64ms | 256ms | 1s | 4s | 16s | gt | max |
|---|---|---|---|---|---|---|---|---|---|---|---|
| my5651.cy8 | 28.442 | 15.107 | 53.739 | 1.261 | 1.376 | 0.075 | 0.227 | ||||
| my5739.cy8 | 12.549 | 30.169 | 54.936 | 0.807 | 1.394 | 0.145 | nonzero | 0.466 | |||
| my8031.cy8 | 5.370 | 36.412 | 54.134 | 2.148 | 1.923 | 0.013 | 0.150 | ||||
| fbmy5635.cay9c | 7.999 | 91.968 | 0.025 | 0.007 | nonzero | nonzero | 0.167 | ||||
| fbmy8028.cay9c | 1.530 | 98.440 | 0.024 | 0.005 | nonzero | 0.033 |
Insert response time histogram: each cell has the percentage of responses that take <= the time in the header and max is the max response time in seconds. For max values in the top 25% of the range have a red background and in the bottom 25% of the range have a green background. The red background is not used when the min value is within 80% of the max value.
| dbms | 256us | 1ms | 4ms | 16ms | 64ms | 256ms | 1s | 4s | 16s | gt | max |
|---|---|---|---|---|---|---|---|---|---|---|---|
| my5651.cy8 | 1.653 | 62.295 | 27.170 | 8.875 | 0.007 | 0.281 | |||||
| my5739.cy8 | 0.233 | 77.389 | 12.382 | 9.934 | 0.062 | 0.424 | |||||
| my8031.cy8 | 0.170 | 81.431 | 17.733 | 0.667 | 0.153 | ||||||
| fbmy5635.cay9c | 99.826 | 0.174 | 0.011 | ||||||||
| fbmy8028.cay9c | 99.785 | 0.208 | 0.007 | 0.018 |
Performance metrics for the DBMS listed above. Some are normalized by throughput, others are not. Legend for results is here.
ips	qps	rps	rmbps	wps	wmbps	rpq	rkbpq	wpi	wkbpi	csps	cpups	cspq	cpupq	dbgb1	dbgb2	rss	maxop	p50	p99	tag
399	2355	12480	194.9	1467.2	43.2	5.299	84.738	3.674	110.697	36282	12.7	15.405	431	107.2	151.2	10.5	0.227	671	32	500m.my5651.cy8
399	2197	11656	182.1	1471.2	43.1	5.306	84.902	3.685	110.528	34102	13.5	15.525	492	107.2	151.2	10.7	0.466	639	32	500m.my5739.cy8
399	2048	10819	169.0	1711.0	43.3	5.283	84.534	4.286	111.052	33701	15.1	16.458	590	106.8	112.7	10.7	0.150	575	48	500m.my8031.cy8
399	10210	235	2.1	9.1	1.0	0.023	0.207	0.023	2.461	39647	49.6	3.883	389	34.9	36.8	9.6	0.167	2589	1966	500m.fbmy5635.cay9c
399	10041	239	2.1	7.2	1.0	0.024	0.218	0.018	2.508	38975	50.4	3.881	402	34.9	37.0	9.3	0.033	2573	1662	500m.fbmy8028.cay9c
q500.1
q500.1: range queries with 500 insert/s per client. Graphs for performance per 1-second interval are here.
Average throughput:
Query response time histogram: each cell has the percentage of responses that take <= the time in the header and max is the max response time in seconds. For max values in the top 25% of the range have a red background and in the bottom 25% of the range have a green background. The red background is not used when the min value is within 80% of the max value.
| dbms | 256us | 1ms | 4ms | 16ms | 64ms | 256ms | 1s | 4s | 16s | gt | max |
|---|---|---|---|---|---|---|---|---|---|---|---|
| my5651.cy8 | 26.322 | 15.697 | 52.005 | 2.410 | 3.387 | 0.180 | nonzero | 0.257 | |||
| my5739.cy8 | 12.859 | 28.818 | 53.694 | 1.453 | 2.909 | 0.267 | nonzero | 0.297 | |||
| my8031.cy8 | 4.598 | 35.866 | 50.006 | 4.904 | 4.581 | 0.045 | 0.153 | ||||
| fbmy5635.cay9c | 7.573 | 92.361 | 0.061 | 0.005 | nonzero | 0.022 | |||||
| fbmy8028.cay9c | 1.207 | 98.743 | 0.047 | 0.004 | nonzero | 0.018 |
Insert response time histogram: each cell has the percentage of responses that take <= the time in the header and max is the max response time in seconds. For max values in the top 25% of the range have a red background and in the bottom 25% of the range have a green background. The red background is not used when the min value is within 80% of the max value.
| dbms | 256us | 1ms | 4ms | 16ms | 64ms | 256ms | 1s | 4s | 16s | gt | max |
|---|---|---|---|---|---|---|---|---|---|---|---|
| my5651.cy8 | 16.070 | 52.492 | 28.540 | 2.898 | 0.254 | ||||||
| my5739.cy8 | 10.771 | 75.455 | 12.640 | 1.135 | 0.204 | ||||||
| my8031.cy8 | 0.116 | 88.162 | 11.378 | 0.343 | 0.160 | ||||||
| fbmy5635.cay9c | 98.157 | 1.838 | 0.005 | 0.019 | |||||||
| fbmy8028.cay9c | 96.443 | 3.529 | 0.028 | 0.023 |
Performance metrics for the DBMS listed above. Some are normalized by throughput, others are not. Legend for results is here.
ips	qps	rps	rmbps	wps	wmbps	rpq	rkbpq	wpi	wkbpi	csps	cpups	cspq	cpupq	dbgb1	dbgb2	rss	maxop	p50	p99	tag
1996	1666	8911	138.9	2387.3	70.8	5.349	85.354	1.196	36.346	28955	12.3	17.382	591	107.7	151.7	10.5	0.257	448	32	500m.my5651.cy8
1996	1686	8984	140.4	2424.6	71.2	5.329	85.266	1.215	36.533	29278	13.8	17.368	655	107.7	151.7	10.7	0.297	448	32	500m.my5739.cy8
1996	1405	7494	117.1	2894.8	73.4	5.332	85.319	1.450	37.669	28190	15.1	20.058	860	107.3	113.1	10.7	0.153	384	48	500m.my8031.cy8
1996	10572	3	0.4	19.2	3.2	0.000	0.039	0.010	1.639	40255	51.2	3.808	387	35.7	36.5	10.6	0.022	2621	2255	500m.fbmy5635.cay9c
1996	10111	1	0.2	16.7	3.0	0.000	0.016	0.008	1.556	38254	52.2	3.783	413	35.6	36.7	10.6	0.018	2541	2111	500m.fbmy8028.cay9c
q1000.1
q1000.1: range queries with 1000 insert/s per client. Graphs for performance per 1-second interval are here.
Average throughput:
Query response time histogram: each cell has the percentage of responses that take <= the time in the header and max is the max response time in seconds. For max values in the top 25% of the range have a red background and in the bottom 25% of the range have a green background. The red background is not used when the min value is within 80% of the max value.
| dbms | 256us | 1ms | 4ms | 16ms | 64ms | 256ms | 1s | 4s | 16s | gt | max |
|---|---|---|---|---|---|---|---|---|---|---|---|
| my5651.cy8 | 23.066 | 16.508 | 50.708 | 2.709 | 6.566 | 0.443 | nonzero | 0.263 | |||
| my5739.cy8 | 12.451 | 27.033 | 52.602 | 1.690 | 5.450 | 0.773 | 0.001 | 0.329 | |||
| my8031.cy8 | 3.408 | 34.599 | 41.408 | 10.349 | 10.132 | 0.105 | 0.221 | ||||
| fbmy5635.cay9c | 5.725 | 94.114 | 0.151 | 0.010 | nonzero | nonzero | 0.143 | ||||
| fbmy8028.cay9c | 0.889 | 99.002 | 0.103 | 0.006 | nonzero | 0.030 |
Insert response time histogram: each cell has the percentage of responses that take <= the time in the header and max is the max response time in seconds. For max values in the top 25% of the range have a red background and in the bottom 25% of the range have a green background. The red background is not used when the min value is within 80% of the max value.
| dbms | 256us | 1ms | 4ms | 16ms | 64ms | 256ms | 1s | 4s | 16s | gt | max |
|---|---|---|---|---|---|---|---|---|---|---|---|
| my5651.cy8 | 14.173 | 50.091 | 32.728 | 3.009 | 0.246 | ||||||
| my5739.cy8 | 0.557 | 75.810 | 21.271 | 2.360 | 0.002 | 0.366 | |||||
| my8031.cy8 | 0.001 | 83.054 | 16.423 | 0.522 | 0.179 | ||||||
| fbmy5635.cay9c | 95.557 | 4.429 | 0.014 | nonzero | 0.196 | ||||||
| fbmy8028.cay9c | 95.053 | 4.913 | 0.034 | 0.033 |
Performance metrics for the DBMS listed above. Some are normalized by throughput, others are not. Legend for results is here.
ips	qps	rps	rmbps	wps	wmbps	rpq	rkbpq	wpi	wkbpi	csps	cpups	cspq	cpupq	dbgb1	dbgb2	rss	maxop	p50	p99	tag
3993	1087	6266	97.1	3006.9	90.2	5.762	91.464	0.753	23.142	22687	14.7	20.864	1081	108.6	152.6	10.5	0.263	240	16	500m.my5651.cy8
3992	1075	6151	96.1	3024.8	89.9	5.720	91.519	0.758	23.061	22523	15.3	20.945	1138	108.6	152.7	10.7	0.329	304	16	500m.my5739.cy8
3992	822	4791	74.9	3715.6	95.7	5.826	93.214	0.931	24.556	22869	17.4	27.810	1693	108.2	114.1	10.8	0.221	176	32	500m.my8031.cy8
3992	10492	17	1.2	36.1	6.9	0.002	0.116	0.009	1.766	39455	53.0	3.760	404	36.8	37.5	10.6	0.143	2637	2269	500m.fbmy5635.cay9c
3992	10127	19	1.5	36.5	7.3	0.002	0.156	0.009	1.885	37413	54.6	3.694	431	36.8	37.7	10.6	0.030	2525	2126	500m.fbmy8028.cay9c
l.i0
l.i0: load without secondary indexes
Performance metrics for all DBMS, not just the ones listed above. Some are normalized by throughput, others are not. Legend for results is here.
ips	qps	rps	rmbps	wps	wmbps	rpq	rkbpq	wpi	wkbpi	csps	cpups	cspq	cpupq	dbgb1	dbgb2	rss	maxop	p50	p99	tag
269396	0	2234	8.7	1121.6	86.7	0.008	0.033	0.004	0.329	33546	73.1	0.125	22	32.9	73.4	10.7	1.337	70024	32755	500m.my5651.cy8
286862	0	1	0.0	1214.8	92.8	0.000	0.000	0.004	0.331	32800	79.1	0.114	22	32.9	73.4	10.9	1.409	73521	49267	500m.my5739.cy8
210261	0	1	0.0	1370.7	79.9	0.000	0.000	0.007	0.389	24788	75.4	0.118	29	32.8	35.2	11.1	1.190	53762	41355	500m.my8031.cy8
193199	0	5	0.7	369.5	82.3	0.000	0.004	0.002	0.436	19967	79.0	0.103	33	15.7	16.1	4.2	0.603	49064	30866	500m.fbmy5635.cay9c
153092	0	2	0.3	305.0	66.8	0.000	0.002	0.002	0.447	16404	75.1	0.107	39	15.7	16.3	4.7	0.591	38860	25190	500m.fbmy8028.cay9c
l.x
l.x: create secondary indexes
Performance metrics for all DBMS, not just the ones listed above. Some are normalized by throughput, others are not. Legend for results is here.
ips	qps	rps	rmbps	wps	wmbps	rpq	rkbpq	wpi	wkbpi	csps	cpups	cspq	cpupq	dbgb1	dbgb2	rss	maxop	p50	p99	tag
179440	0	1570	141.9	4632.4	247.9	0.009	0.810	0.026	1.415	16918	37.1	0.094	17	67.8	108.3	10.5	0.051	NA	NA	500m.my5651.cy8
293314	0	1940	222.3	3829.1	295.1	0.007	0.776	0.013	1.030	15854	31.9	0.054	9	73.6	114.1	10.3	0.006	NA	NA	500m.my5739.cy8
242532	0	3761	312.6	4653.4	283.9	0.016	1.320	0.019	1.199	14699	61.9	0.061	20	73.3	75.8	10.4	0.009	NA	NA	500m.my8031.cy8
294696	0	382	64.6	201.1	44.3	0.001	0.224	0.001	0.154	1602	47.9	0.005	13	33.5	34.0	6.4	0.004	NA	NA	500m.fbmy5635.cay9c
242885	0	316	53.4	165.3	36.6	0.001	0.225	0.001	0.154	1429	48.4	0.006	16	33.5	34.1	8.3	0.006	NA	NA	500m.fbmy8028.cay9c
l.i1
l.i1: continue load after secondary indexes created
Performance metrics for all DBMS, not just the ones listed above. Some are normalized by throughput, others are not. Legend for results is here.
ips	qps	rps	rmbps	wps	wmbps	rpq	rkbpq	wpi	wkbpi	csps	cpups	cspq	cpupq	dbgb1	dbgb2	rss	maxop	p50	p99	tag
4808	0	3002	46.0	4448.5	147.9	0.624	9.790	0.925	31.505	16287	10.0	3.388	166	107.1	151.1	10.5	3.017	250	0	500m.my5651.cy8
4792	0	2920	45.6	4217.5	143.7	0.609	9.750	0.880	30.702	15122	13.8	3.156	230	107.1	151.2	10.7	1.788	200	0	500m.my5739.cy8
4378	0	2710	42.3	5400.7	155.6	0.619	9.904	1.234	36.393	21330	16.1	4.872	294	106.8	112.6	10.7	2.285	250	50	500m.my8031.cy8
89286	0	2	0.3	314.1	70.4	0.000	0.003	0.004	0.807	20068	68.0	0.225	61	35.2	36.9	6.6	0.400	23474	14534	500m.fbmy5635.cay9c
78125	0	8	1.0	301.8	66.7	0.000	0.013	0.004	0.874	16918	70.4	0.217	72	34.8	36.6	6.9	0.125	20385	12586	500m.fbmy8028.cay9c
q100.1
q100.1: range queries with 100 insert/s per client
Performance metrics for all DBMS, not just the ones listed above. Some are normalized by throughput, others are not. Legend for results is here.
ips	qps	rps	rmbps	wps	wmbps	rpq	rkbpq	wpi	wkbpi	csps	cpups	cspq	cpupq	dbgb1	dbgb2	rss	maxop	p50	p99	tag
399	2355	12480	194.9	1467.2	43.2	5.299	84.738	3.674	110.697	36282	12.7	15.405	431	107.2	151.2	10.5	0.227	671	32	500m.my5651.cy8
399	2197	11656	182.1	1471.2	43.1	5.306	84.902	3.685	110.528	34102	13.5	15.525	492	107.2	151.2	10.7	0.466	639	32	500m.my5739.cy8
399	2048	10819	169.0	1711.0	43.3	5.283	84.534	4.286	111.052	33701	15.1	16.458	590	106.8	112.7	10.7	0.150	575	48	500m.my8031.cy8
399	10210	235	2.1	9.1	1.0	0.023	0.207	0.023	2.461	39647	49.6	3.883	389	34.9	36.8	9.6	0.167	2589	1966	500m.fbmy5635.cay9c
399	10041	239	2.1	7.2	1.0	0.024	0.218	0.018	2.508	38975	50.4	3.881	402	34.9	37.0	9.3	0.033	2573	1662	500m.fbmy8028.cay9c
q500.1
q500.1: range queries with 500 insert/s per client
Performance metrics for all DBMS, not just the ones listed above. Some are normalized by throughput, others are not. Legend for results is here.
ips	qps	rps	rmbps	wps	wmbps	rpq	rkbpq	wpi	wkbpi	csps	cpups	cspq	cpupq	dbgb1	dbgb2	rss	maxop	p50	p99	tag
1996	1666	8911	138.9	2387.3	70.8	5.349	85.354	1.196	36.346	28955	12.3	17.382	591	107.7	151.7	10.5	0.257	448	32	500m.my5651.cy8
1996	1686	8984	140.4	2424.6	71.2	5.329	85.266	1.215	36.533	29278	13.8	17.368	655	107.7	151.7	10.7	0.297	448	32	500m.my5739.cy8
1996	1405	7494	117.1	2894.8	73.4	5.332	85.319	1.450	37.669	28190	15.1	20.058	860	107.3	113.1	10.7	0.153	384	48	500m.my8031.cy8
1996	10572	3	0.4	19.2	3.2	0.000	0.039	0.010	1.639	40255	51.2	3.808	387	35.7	36.5	10.6	0.022	2621	2255	500m.fbmy5635.cay9c
1996	10111	1	0.2	16.7	3.0	0.000	0.016	0.008	1.556	38254	52.2	3.783	413	35.6	36.7	10.6	0.018	2541	2111	500m.fbmy8028.cay9c
q1000.1
q1000.1: range queries with 1000 insert/s per client
Performance metrics for all DBMS, not just the ones listed above. Some are normalized by throughput, others are not. Legend for results is here.
ips	qps	rps	rmbps	wps	wmbps	rpq	rkbpq	wpi	wkbpi	csps	cpups	cspq	cpupq	dbgb1	dbgb2	rss	maxop	p50	p99	tag
3993	1087	6266	97.1	3006.9	90.2	5.762	91.464	0.753	23.142	22687	14.7	20.864	1081	108.6	152.6	10.5	0.263	240	16	500m.my5651.cy8
3992	1075	6151	96.1	3024.8	89.9	5.720	91.519	0.758	23.061	22523	15.3	20.945	1138	108.6	152.7	10.7	0.329	304	16	500m.my5739.cy8
3992	822	4791	74.9	3715.6	95.7	5.826	93.214	0.931	24.556	22869	17.4	27.810	1693	108.2	114.1	10.8	0.221	176	32	500m.my8031.cy8
3992	10492	17	1.2	36.1	6.9	0.002	0.116	0.009	1.766	39455	53.0	3.760	404	36.8	37.5	10.6	0.143	2637	2269	500m.fbmy5635.cay9c
3992	10127	19	1.5	36.5	7.3	0.002	0.156	0.009	1.885	37413	54.6	3.694	431	36.8	37.7	10.6	0.030	2525	2126	500m.fbmy8028.cay9c
l.i0
- l.i0: load without secondary indexes
- Legend for results is here.
- Each entry lists the percentage of responses that fit in that bucket (slower than max time for previous bucket, faster than min time for next bucket).
Insert response time histogram
256us	1ms	4ms	16ms	64ms	256ms	1s	4s	16s	gt	max	tag
0.000	0.361	98.933	0.479	0.205	0.021	0.001	nonzero	0.000	0.000	1.337	my5651.cy8
0.000	0.013	99.743	0.209	0.018	0.015	0.002	nonzero	0.000	0.000	1.409	my5739.cy8
0.000	0.000	99.657	0.279	0.038	0.026	0.001	nonzero	0.000	0.000	1.190	my8031.cy8
0.000	0.000	99.853	0.124	0.006	0.011	0.005	0.000	0.000	0.000	0.603	fbmy5635.cay9c
0.000	0.000	99.399	0.560	0.020	0.017	0.004	0.000	0.000	0.000	0.591	fbmy8028.cay9c
l.x
- l.x: create secondary indexes
- Legend for results is here.
- Each entry lists the percentage of responses that fit in that bucket (slower than max time for previous bucket, faster than min time for next bucket).
TODO - determine whether there is data for create index response time
l.i1
- l.i1: continue load after secondary indexes created
- Legend for results is here.
- Each entry lists the percentage of responses that fit in that bucket (slower than max time for previous bucket, faster than min time for next bucket).
Insert response time histogram
256us	1ms	4ms	16ms	64ms	256ms	1s	4s	16s	gt	max	tag
0.000	0.000	19.488	55.211	13.350	7.899	3.667	0.386	0.000	0.000	3.017	my5651.cy8
0.000	0.000	3.574	74.609	9.963	6.736	4.817	0.301	0.000	0.000	1.788	my5739.cy8
0.000	0.000	0.053	70.489	13.548	10.877	4.947	0.085	0.000	0.000	2.285	my8031.cy8
0.000	0.000	99.768	0.199	0.022	0.004	0.006	0.000	0.000	0.000	0.400	fbmy5635.cay9c
0.000	0.000	98.989	0.949	0.045	0.018	0.000	0.000	0.000	0.000	0.125	fbmy8028.cay9c
q100.1
- q100.1: range queries with 100 insert/s per client
- Legend for results is here.
- Each entry lists the percentage of responses that fit in that bucket (slower than max time for previous bucket, faster than min time for next bucket).
Query response time histogram
256us	1ms	4ms	16ms	64ms	256ms	1s	4s	16s	gt	max	tag
28.442	15.107	53.739	1.261	1.376	0.075	0.000	0.000	0.000	0.000	0.227	my5651.cy8
12.549	30.169	54.936	0.807	1.394	0.145	nonzero	0.000	0.000	0.000	0.466	my5739.cy8
5.370	36.412	54.134	2.148	1.923	0.013	0.000	0.000	0.000	0.000	0.150	my8031.cy8
7.999	91.968	0.025	0.007	nonzero	nonzero	0.000	0.000	0.000	0.000	0.167	fbmy5635.cay9c
1.530	98.440	0.024	0.005	nonzero	0.000	0.000	0.000	0.000	0.000	0.033	fbmy8028.cay9c
Insert response time histogram
256us	1ms	4ms	16ms	64ms	256ms	1s	4s	16s	gt	max	tag
0.000	0.000	1.653	62.295	27.170	8.875	0.007	0.000	0.000	0.000	0.281	my5651.cy8
0.000	0.000	0.233	77.389	12.382	9.934	0.062	0.000	0.000	0.000	0.424	my5739.cy8
0.000	0.000	0.170	81.431	17.733	0.667	0.000	0.000	0.000	0.000	0.153	my8031.cy8
0.000	0.000	99.826	0.174	0.000	0.000	0.000	0.000	0.000	0.000	0.011	fbmy5635.cay9c
0.000	0.000	99.785	0.208	0.007	0.000	0.000	0.000	0.000	0.000	0.018	fbmy8028.cay9c
q500.1
- q500.1: range queries with 500 insert/s per client
- Legend for results is here.
- Each entry lists the percentage of responses that fit in that bucket (slower than max time for previous bucket, faster than min time for next bucket).
Query response time histogram
256us	1ms	4ms	16ms	64ms	256ms	1s	4s	16s	gt	max	tag
26.322	15.697	52.005	2.410	3.387	0.180	nonzero	0.000	0.000	0.000	0.257	my5651.cy8
12.859	28.818	53.694	1.453	2.909	0.267	nonzero	0.000	0.000	0.000	0.297	my5739.cy8
4.598	35.866	50.006	4.904	4.581	0.045	0.000	0.000	0.000	0.000	0.153	my8031.cy8
7.573	92.361	0.061	0.005	nonzero	0.000	0.000	0.000	0.000	0.000	0.022	fbmy5635.cay9c
1.207	98.743	0.047	0.004	nonzero	0.000	0.000	0.000	0.000	0.000	0.018	fbmy8028.cay9c
Insert response time histogram
256us	1ms	4ms	16ms	64ms	256ms	1s	4s	16s	gt	max	tag
0.000	0.000	16.070	52.492	28.540	2.898	0.000	0.000	0.000	0.000	0.254	my5651.cy8
0.000	0.000	10.771	75.455	12.640	1.135	0.000	0.000	0.000	0.000	0.204	my5739.cy8
0.000	0.000	0.116	88.162	11.378	0.343	0.000	0.000	0.000	0.000	0.160	my8031.cy8
0.000	0.000	98.157	1.838	0.005	0.000	0.000	0.000	0.000	0.000	0.019	fbmy5635.cay9c
0.000	0.000	96.443	3.529	0.028	0.000	0.000	0.000	0.000	0.000	0.023	fbmy8028.cay9c
q1000.1
- q1000.1: range queries with 1000 insert/s per client
- Legend for results is here.
- Each entry lists the percentage of responses that fit in that bucket (slower than max time for previous bucket, faster than min time for next bucket).
Query response time histogram
256us	1ms	4ms	16ms	64ms	256ms	1s	4s	16s	gt	max	tag
23.066	16.508	50.708	2.709	6.566	0.443	nonzero	0.000	0.000	0.000	0.263	my5651.cy8
12.451	27.033	52.602	1.690	5.450	0.773	0.001	0.000	0.000	0.000	0.329	my5739.cy8
3.408	34.599	41.408	10.349	10.132	0.105	0.000	0.000	0.000	0.000	0.221	my8031.cy8
5.725	94.114	0.151	0.010	nonzero	nonzero	0.000	0.000	0.000	0.000	0.143	fbmy5635.cay9c
0.889	99.002	0.103	0.006	nonzero	0.000	0.000	0.000	0.000	0.000	0.030	fbmy8028.cay9c
Insert response time histogram
256us	1ms	4ms	16ms	64ms	256ms	1s	4s	16s	gt	max	tag
0.000	0.000	14.173	50.091	32.728	3.009	0.000	0.000	0.000	0.000	0.246	my5651.cy8
0.000	0.000	0.557	75.810	21.271	2.360	0.002	0.000	0.000	0.000	0.366	my5739.cy8
0.000	0.000	0.001	83.054	16.423	0.522	0.000	0.000	0.000	0.000	0.179	my8031.cy8
0.000	0.000	95.557	4.429	0.014	nonzero	0.000	0.000	0.000	0.000	0.196	fbmy5635.cay9c
0.000	0.000	95.053	4.913	0.034	0.000	0.000	0.000	0.000	0.000	0.033	fbmy8028.cay9c