Introduction
This is a report for the insert benchmark with 500M docs and 3 client(s). It is generated by scripts (bash, awk, sed) and Tufte might not be impressed. An overview of the insert benchmark is here and a short update is here. Below, by DBMS, I mean DBMS+version.config. An example is my8020.c10b40 where my means MySQL, 8020 is version 8.0.20 and c10b40 is the name for the configuration file.
The test server has 8 AMD cores, 16G RAM and an NVMe SSD. It is described here as the Beelink. The benchmark was run with 3 clients and there were 1 or 2 connections per client (1 for queries, 1 for inserts). The benchmark loads 500M rows without secondary indexes, creates secondary indexes, loads another 10M rows then does 3 read+write tests for one hour each that do queries as fast as possible with 100, 500 and then 1000 writes/second/client concurrent with the queries. The database doesn't fit in memory and parts of the benchmark are IO-bound. Clients and the DBMS share one server. The per-database configs are in the per-database subdirectories here.
The tested DBMS are:
- my5651.cy8 - MySQL 5.6.51, InnoDB and the cy8 config
- my5739.cy8 - MySQL 5.7.39, InnoDB and the cy8 config
- my8031.cy8 - MySQL 8.0.31, InnoDB and the cy8 config
- fbmy5635.cay9c - FB MySQL 5.6.35, MyRocks and the cay9c config
- fbmy8028.cay9c - FB MySQL 8.0.28, MyRocks and the cay9c config
Contents
- Summary
- l.i0: load without secondary indexes
- l.x: create secondary indexes
- l.i1: continue load after secondary indexes created
- q100.1: range queries with 100 insert/s per client
- q500.1: range queries with 500 insert/s per client
- q1000.1: range queries with 1000 insert/s per client
Summary
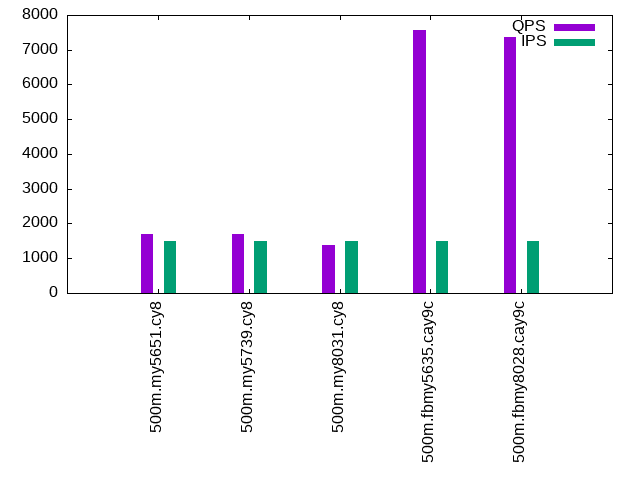
The numbers are inserts/s for l.i0 and l.i1, indexed docs (or rows) /s for l.x and queries/s for q*.2. The values are the average rate over the entire test for inserts (IPS) and queries (QPS). The range of values for IPS and QPS is split into 3 parts: bottom 25%, middle 50%, top 25%. Values in the bottom 25% have a red background, values in the top 25% have a green background and values in the middle have no color. A gray background is used for values that can be ignored because the DBMS did not sustain the target insert rate. Red backgrounds are not used when the minimum value is within 80% of the max value.
| dbms | l.i0 | l.x | l.i1 | q100.1 | q500.1 | q1000.1 |
|---|---|---|---|---|---|---|
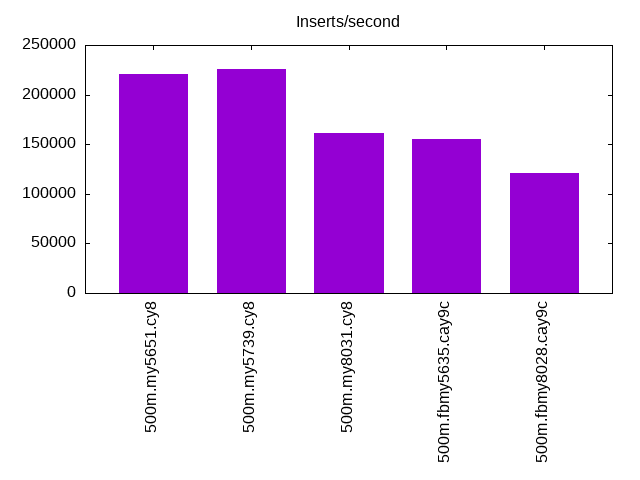
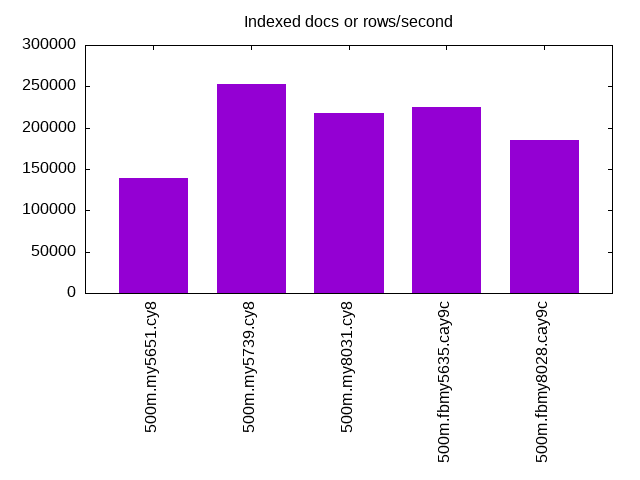
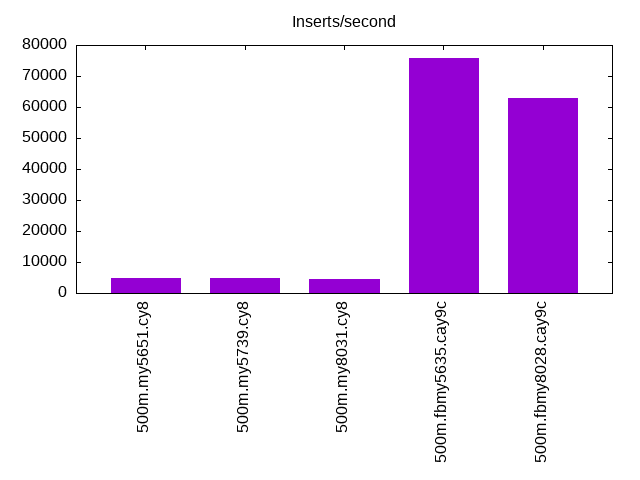
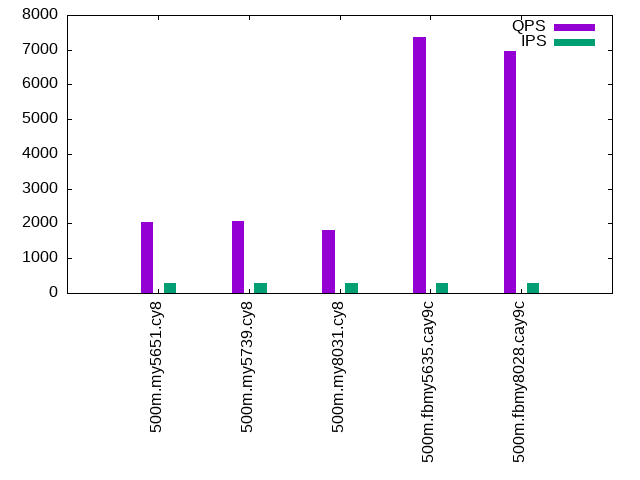
| 500m.my5651.cy8 | 220653 | 139420 | 4847 | 2040 | 1693 | 1234 |
| 500m.my5739.cy8 | 226244 | 253215 | 4854 | 2062 | 1702 | 1249 |
| 500m.my8031.cy8 | 161186 | 218098 | 4361 | 1801 | 1368 | 959 |
| 500m.fbmy5635.cay9c | 155424 | 225068 | 75758 | 7373 | 7573 | 7676 |
| 500m.fbmy8028.cay9c | 121036 | 185428 | 62893 | 6959 | 7371 | 7425 |
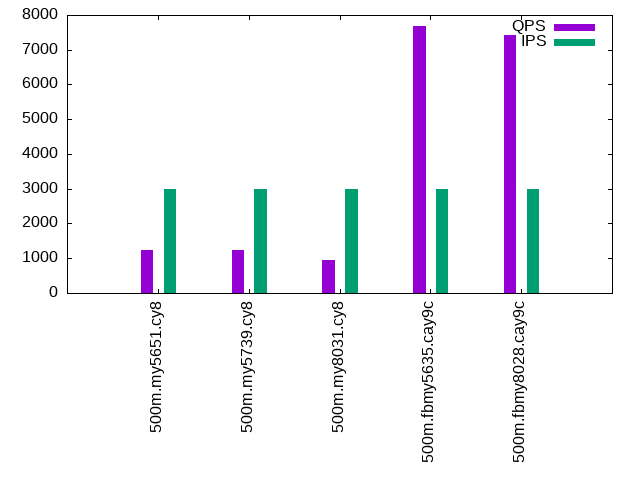
This lists the average rate of inserts/s for the tests that do inserts concurrent with queries. For such tests the query rate is listed in the table above. The read+write tests are setup so that the insert rate should match the target rate every second. Cells that are not at least 95% of the target have a red background to indicate a failure to satisfy the target.
| dbms | q100.1 | q500.1 | q1000.1 |
|---|---|---|---|
| my5651.cy8 | 300 | 1498 | 2995 |
| my5739.cy8 | 300 | 1498 | 2995 |
| my8031.cy8 | 300 | 1498 | 2996 |
| fbmy5635.cay9c | 300 | 1498 | 2995 |
| fbmy8028.cay9c | 300 | 1498 | 2995 |
| target | 300 | 1500 | 3000 |
l.i0
l.i0: load without secondary indexes. Graphs for performance per 1-second interval are here.
Average throughput:
Insert response time histogram: each cell has the percentage of responses that take <= the time in the header and max is the max response time in seconds. For the max column values in the top 25% of the range have a red background and in the bottom 25% of the range have a green background. The red background is not used when the min value is within 80% of the max value.
| dbms | 256us | 1ms | 4ms | 16ms | 64ms | 256ms | 1s | 4s | 16s | gt | max |
|---|---|---|---|---|---|---|---|---|---|---|---|
| my5651.cy8 | 2.138 | 97.337 | 0.317 | 0.189 | 0.019 | nonzero | nonzero | 1.225 | |||
| my5739.cy8 | 0.016 | 99.761 | 0.189 | 0.022 | 0.010 | 0.002 | 0.484 | ||||
| my8031.cy8 | 99.725 | 0.231 | 0.029 | 0.013 | 0.001 | nonzero | 1.952 | ||||
| fbmy5635.cay9c | 99.965 | 0.019 | 0.004 | 0.009 | 0.003 | 0.631 | |||||
| fbmy8028.cay9c | 99.766 | 0.204 | 0.014 | 0.013 | 0.003 | 0.628 |
Performance metrics for the DBMS listed above. Some are normalized by throughput, others are not. Legend for results is here.
ips	qps	rps	rmbps	wps	wmbps	rpq	rkbpq	wpi	wkbpi	csps	cpups	cspq	cpupq	dbgb1	dbgb2	rss	maxop	p50	p99	tag
220653	0	1835	7.2	919.1	71.0	0.008	0.033	0.004	0.329	26771	57.6	0.121	21	32.9	73.4	10.7	1.225	76843	39058	500m.my5651.cy8
226244	0	0	0.0	997.9	74.3	0.000	0.000	0.004	0.336	25515	61.0	0.113	22	32.9	73.4	10.9	0.484	76843	51331	500m.my5739.cy8
161186	0	0	0.0	1049.9	61.2	0.000	0.000	0.007	0.389	19099	58.8	0.118	29	32.8	35.2	11.1	1.952	54641	44641	500m.my8031.cy8
155424	0	1	0.1	315.6	70.3	0.000	0.001	0.002	0.463	17606	64.6	0.113	33	15.7	16.1	4.6	0.631	52161	34661	500m.fbmy5635.cay9c
121036	0	1	0.2	236.1	51.4	0.000	0.001	0.002	0.435	13766	60.0	0.114	40	15.7	16.3	4.6	0.628	40570	29168	500m.fbmy8028.cay9c
l.x
l.x: create secondary indexes.
Average throughput:
Performance metrics for the DBMS listed above. Some are normalized by throughput, others are not. Legend for results is here.
ips	qps	rps	rmbps	wps	wmbps	rpq	rkbpq	wpi	wkbpi	csps	cpups	cspq	cpupq	dbgb1	dbgb2	rss	maxop	p50	p99	tag
139420	0	1280	106.9	4119.2	201.1	0.009	0.785	0.030	1.477	14699	26.6	0.105	15	67.8	108.3	10.5	0.021	NA	NA	500m.my5651.cy8
253215	0	1687	194.7	3192.1	257.5	0.007	0.787	0.013	1.041	14318	27.3	0.057	9	73.6	114.1	10.3	0.005	NA	NA	500m.my5739.cy8
218098	0	3300	270.6	4303.1	264.6	0.015	1.270	0.020	1.242	14732	61.0	0.068	22	73.3	75.8	10.4	0.009	NA	NA	500m.my8031.cy8
225068	0	291	49.0	154.7	33.7	0.001	0.223	0.001	0.153	1338	36.2	0.006	13	33.3	33.7	6.5	0.003	NA	NA	500m.fbmy5635.cay9c
185428	0	242	40.9	125.1	27.7	0.001	0.226	0.001	0.153	1310	36.8	0.007	16	33.3	33.9	8.4	0.005	NA	NA	500m.fbmy8028.cay9c
l.i1
l.i1: continue load after secondary indexes created. Graphs for performance per 1-second interval are here.
Average throughput:
Insert response time histogram: each cell has the percentage of responses that take <= the time in the header and max is the max response time in seconds. For the max column values in the top 25% of the range have a red background and in the bottom 25% of the range have a green background. The red background is not used when the min value is within 80% of the max value.
| dbms | 256us | 1ms | 4ms | 16ms | 64ms | 256ms | 1s | 4s | 16s | gt | max |
|---|---|---|---|---|---|---|---|---|---|---|---|
| my5651.cy8 | 22.214 | 56.278 | 12.505 | 6.264 | 2.540 | 0.199 | 3.493 | ||||
| my5739.cy8 | 1.755 | 77.679 | 11.066 | 6.568 | 2.772 | 0.160 | 1.935 | ||||
| my8031.cy8 | 0.038 | 73.576 | 12.911 | 10.884 | 2.578 | 0.012 | 1.849 | ||||
| fbmy5635.cay9c | 99.902 | 0.082 | 0.011 | 0.004 | 0.183 | ||||||
| fbmy8028.cay9c | 99.752 | 0.214 | 0.023 | 0.010 | nonzero | 0.256 |
Performance metrics for the DBMS listed above. Some are normalized by throughput, others are not. Legend for results is here.
ips	qps	rps	rmbps	wps	wmbps	rpq	rkbpq	wpi	wkbpi	csps	cpups	cspq	cpupq	dbgb1	dbgb2	rss	maxop	p50	p99	tag
4847	0	2868	43.9	4273.9	142.5	0.592	9.264	0.882	30.096	15497	9.6	3.197	158	105.4	149.4	10.5	3.493	350	0	500m.my5651.cy8
4854	0	2798	43.7	4066.8	138.4	0.576	9.221	0.838	29.203	14964	13.7	3.083	226	105.4	149.3	10.7	1.935	350	50	500m.my5739.cy8
4361	0	2554	39.9	5064.5	148.3	0.586	9.371	1.161	34.831	20515	15.7	4.704	288	105.0	110.7	10.7	1.849	350	50	500m.my8031.cy8
75758	0	1	0.1	289.0	64.7	0.000	0.001	0.004	0.874	17048	59.9	0.225	63	34.7	36.4	6.6	0.183	25682	1049	500m.fbmy5635.cay9c
62893	0	4	0.4	242.0	53.4	0.000	0.007	0.004	0.869	14644	58.1	0.233	74	34.5	36.4	7.0	0.256	21576	15063	500m.fbmy8028.cay9c
q100.1
q100.1: range queries with 100 insert/s per client. Graphs for performance per 1-second interval are here.
Average throughput:
Query response time histogram: each cell has the percentage of responses that take <= the time in the header and max is the max response time in seconds. For max values in the top 25% of the range have a red background and in the bottom 25% of the range have a green background. The red background is not used when the min value is within 80% of the max value.
| dbms | 256us | 1ms | 4ms | 16ms | 64ms | 256ms | 1s | 4s | 16s | gt | max |
|---|---|---|---|---|---|---|---|---|---|---|---|
| my5651.cy8 | 29.263 | 16.655 | 51.961 | 1.130 | 0.947 | 0.044 | 0.167 | ||||
| my5739.cy8 | 9.809 | 35.553 | 52.946 | 0.689 | 0.953 | 0.051 | 0.222 | ||||
| my8031.cy8 | 4.625 | 38.387 | 53.880 | 1.844 | 1.260 | 0.005 | 0.143 | ||||
| fbmy5635.cay9c | 4.710 | 95.272 | 0.013 | 0.005 | nonzero | nonzero | 0.071 | ||||
| fbmy8028.cay9c | 0.401 | 99.580 | 0.014 | 0.004 | nonzero | 0.057 |
Insert response time histogram: each cell has the percentage of responses that take <= the time in the header and max is the max response time in seconds. For max values in the top 25% of the range have a red background and in the bottom 25% of the range have a green background. The red background is not used when the min value is within 80% of the max value.
| dbms | 256us | 1ms | 4ms | 16ms | 64ms | 256ms | 1s | 4s | 16s | gt | max |
|---|---|---|---|---|---|---|---|---|---|---|---|
| my5651.cy8 | 1.037 | 69.106 | 23.681 | 6.176 | 0.253 | ||||||
| my5739.cy8 | 0.005 | 79.560 | 13.731 | 6.653 | 0.051 | 0.339 | |||||
| my8031.cy8 | 0.023 | 82.102 | 16.718 | 1.157 | 0.144 | ||||||
| fbmy5635.cay9c | 99.898 | 0.097 | 0.005 | 0.018 | |||||||
| fbmy8028.cay9c | 99.931 | 0.069 | 0.009 |
Performance metrics for the DBMS listed above. Some are normalized by throughput, others are not. Legend for results is here.
ips	qps	rps	rmbps	wps	wmbps	rpq	rkbpq	wpi	wkbpi	csps	cpups	cspq	cpupq	dbgb1	dbgb2	rss	maxop	p50	p99	tag
300	2040	10505	164.1	1246.2	36.8	5.149	82.345	4.161	125.848	30756	10.5	15.074	412	105.4	149.4	10.5	0.167	751	32	500m.my5651.cy8
300	2062	10620	165.9	1271.4	37.4	5.151	82.412	4.245	127.883	31227	12.1	15.145	469	105.4	149.4	10.7	0.222	767	64	500m.my5739.cy8
300	1801	9260	144.7	1478.3	37.4	5.142	82.279	4.936	127.850	29141	13.0	16.183	578	105.0	110.8	10.7	0.143	687	48	500m.my8031.cy8
300	7373	172	1.4	8.9	0.9	0.023	0.196	0.030	3.082	29008	37.6	3.934	408	34.6	36.5	7.7	0.071	2445	1886	500m.fbmy5635.cay9c
300	6959	172	1.4	5.1	0.5	0.025	0.206	0.017	1.667	27518	38.2	3.954	439	34.6	36.6	7.5	0.057	2319	1710	500m.fbmy8028.cay9c
q500.1
q500.1: range queries with 500 insert/s per client. Graphs for performance per 1-second interval are here.
Average throughput:
Query response time histogram: each cell has the percentage of responses that take <= the time in the header and max is the max response time in seconds. For max values in the top 25% of the range have a red background and in the bottom 25% of the range have a green background. The red background is not used when the min value is within 80% of the max value.
| dbms | 256us | 1ms | 4ms | 16ms | 64ms | 256ms | 1s | 4s | 16s | gt | max |
|---|---|---|---|---|---|---|---|---|---|---|---|
| my5651.cy8 | 27.919 | 16.711 | 51.532 | 2.018 | 1.745 | 0.074 | 0.194 | ||||
| my5739.cy8 | 10.301 | 33.530 | 53.376 | 0.988 | 1.687 | 0.118 | nonzero | 0.263 | |||
| my8031.cy8 | 4.458 | 37.264 | 52.140 | 3.294 | 2.830 | 0.013 | 0.148 | ||||
| fbmy5635.cay9c | 6.145 | 93.835 | 0.019 | 0.002 | 0.012 | ||||||
| fbmy8028.cay9c | 0.567 | 99.405 | 0.026 | 0.002 | nonzero | 0.016 |
Insert response time histogram: each cell has the percentage of responses that take <= the time in the header and max is the max response time in seconds. For max values in the top 25% of the range have a red background and in the bottom 25% of the range have a green background. The red background is not used when the min value is within 80% of the max value.
| dbms | 256us | 1ms | 4ms | 16ms | 64ms | 256ms | 1s | 4s | 16s | gt | max |
|---|---|---|---|---|---|---|---|---|---|---|---|
| my5651.cy8 | 19.562 | 58.320 | 21.016 | 1.102 | 0.168 | ||||||
| my5739.cy8 | 17.474 | 72.948 | 8.946 | 0.631 | 0.199 | ||||||
| my8031.cy8 | 0.398 | 91.386 | 8.076 | 0.140 | 0.156 | ||||||
| fbmy5635.cay9c | 98.760 | 1.238 | 0.002 | 0.019 | |||||||
| fbmy8028.cay9c | 96.515 | 3.479 | 0.006 | 0.019 |
Performance metrics for the DBMS listed above. Some are normalized by throughput, others are not. Legend for results is here.
ips	qps	rps	rmbps	wps	wmbps	rpq	rkbpq	wpi	wkbpi	csps	cpups	cspq	cpupq	dbgb1	dbgb2	rss	maxop	p50	p99	tag
1498	1693	8745	136.4	1865.7	55.3	5.165	82.458	1.246	37.826	27551	10.6	16.271	501	105.8	149.8	10.5	0.194	607	48	500m.my5651.cy8
1498	1702	8772	137.1	1887.5	55.6	5.154	82.467	1.260	37.983	27771	12.2	16.317	573	105.8	149.7	10.7	0.263	591	128	500m.my5739.cy8
1498	1368	7059	110.3	2299.9	58.5	5.161	82.582	1.535	39.961	25641	13.0	18.748	760	105.4	111.2	10.7	0.148	479	48	500m.my8031.cy8
1498	7573	3	0.3	16.4	2.8	0.000	0.042	0.011	1.904	29521	39.2	3.898	414	35.3	35.8	10.5	0.012	2510	2206	500m.fbmy5635.cay9c
1498	7371	1	0.1	12.2	2.3	0.000	0.018	0.008	1.542	28832	39.9	3.912	433	35.3	36.0	10.5	0.016	2429	2014	500m.fbmy8028.cay9c
q1000.1
q1000.1: range queries with 1000 insert/s per client. Graphs for performance per 1-second interval are here.
Average throughput:
Query response time histogram: each cell has the percentage of responses that take <= the time in the header and max is the max response time in seconds. For max values in the top 25% of the range have a red background and in the bottom 25% of the range have a green background. The red background is not used when the min value is within 80% of the max value.
| dbms | 256us | 1ms | 4ms | 16ms | 64ms | 256ms | 1s | 4s | 16s | gt | max |
|---|---|---|---|---|---|---|---|---|---|---|---|
| my5651.cy8 | 25.549 | 16.588 | 51.490 | 2.769 | 3.418 | 0.186 | nonzero | 0.261 | |||
| my5739.cy8 | 10.244 | 31.389 | 53.589 | 1.308 | 3.189 | 0.281 | nonzero | 0.275 | |||
| my8031.cy8 | 3.932 | 35.872 | 48.293 | 6.628 | 5.246 | 0.029 | 0.145 | ||||
| fbmy5635.cay9c | 6.467 | 93.488 | 0.044 | 0.002 | nonzero | 0.027 | |||||
| fbmy8028.cay9c | 0.465 | 99.481 | 0.053 | 0.001 | nonzero | 0.017 |
Insert response time histogram: each cell has the percentage of responses that take <= the time in the header and max is the max response time in seconds. For max values in the top 25% of the range have a red background and in the bottom 25% of the range have a green background. The red background is not used when the min value is within 80% of the max value.
| dbms | 256us | 1ms | 4ms | 16ms | 64ms | 256ms | 1s | 4s | 16s | gt | max |
|---|---|---|---|---|---|---|---|---|---|---|---|
| my5651.cy8 | 19.226 | 57.026 | 22.276 | 1.471 | 0.001 | 0.309 | |||||
| my5739.cy8 | 5.570 | 80.263 | 13.367 | 0.800 | 0.222 | ||||||
| my8031.cy8 | 0.006 | 89.467 | 10.370 | 0.157 | 0.148 | ||||||
| fbmy5635.cay9c | 97.701 | 2.296 | 0.003 | 0.025 | |||||||
| fbmy8028.cay9c | 95.612 | 4.384 | 0.004 | 0.020 |
Performance metrics for the DBMS listed above. Some are normalized by throughput, others are not. Legend for results is here.
ips	qps	rps	rmbps	wps	wmbps	rpq	rkbpq	wpi	wkbpi	csps	cpups	cspq	cpupq	dbgb1	dbgb2	rss	maxop	p50	p99	tag
2995	1234	6707	104.2	2551.7	76.2	5.434	86.456	0.852	26.069	23289	11.6	18.867	752	106.5	150.5	10.5	0.261	448	32	500m.my5651.cy8
2995	1249	6750	105.5	2592.0	77.0	5.406	86.496	0.865	26.331	23584	13.4	18.889	859	106.5	150.4	10.7	0.275	448	16	500m.my5739.cy8
2996	959	5231	81.7	3240.8	83.2	5.453	87.251	1.082	28.435	23083	14.8	24.063	1234	106.1	111.9	10.7	0.145	336	48	500m.my8031.cy8
2995	7676	5	0.6	32.1	6.2	0.001	0.075	0.011	2.127	29944	41.0	3.901	427	36.2	38.1	10.5	0.027	2557	2254	500m.fbmy5635.cay9c
2995	7425	2	0.2	23.8	4.7	0.000	0.032	0.008	1.622	29015	41.6	3.908	448	36.1	38.2	10.6	0.017	2493	2046	500m.fbmy8028.cay9c
l.i0
l.i0: load without secondary indexes
Performance metrics for all DBMS, not just the ones listed above. Some are normalized by throughput, others are not. Legend for results is here.
ips	qps	rps	rmbps	wps	wmbps	rpq	rkbpq	wpi	wkbpi	csps	cpups	cspq	cpupq	dbgb1	dbgb2	rss	maxop	p50	p99	tag
220653	0	1835	7.2	919.1	71.0	0.008	0.033	0.004	0.329	26771	57.6	0.121	21	32.9	73.4	10.7	1.225	76843	39058	500m.my5651.cy8
226244	0	0	0.0	997.9	74.3	0.000	0.000	0.004	0.336	25515	61.0	0.113	22	32.9	73.4	10.9	0.484	76843	51331	500m.my5739.cy8
161186	0	0	0.0	1049.9	61.2	0.000	0.000	0.007	0.389	19099	58.8	0.118	29	32.8	35.2	11.1	1.952	54641	44641	500m.my8031.cy8
155424	0	1	0.1	315.6	70.3	0.000	0.001	0.002	0.463	17606	64.6	0.113	33	15.7	16.1	4.6	0.631	52161	34661	500m.fbmy5635.cay9c
121036	0	1	0.2	236.1	51.4	0.000	0.001	0.002	0.435	13766	60.0	0.114	40	15.7	16.3	4.6	0.628	40570	29168	500m.fbmy8028.cay9c
l.x
l.x: create secondary indexes
Performance metrics for all DBMS, not just the ones listed above. Some are normalized by throughput, others are not. Legend for results is here.
ips	qps	rps	rmbps	wps	wmbps	rpq	rkbpq	wpi	wkbpi	csps	cpups	cspq	cpupq	dbgb1	dbgb2	rss	maxop	p50	p99	tag
139420	0	1280	106.9	4119.2	201.1	0.009	0.785	0.030	1.477	14699	26.6	0.105	15	67.8	108.3	10.5	0.021	NA	NA	500m.my5651.cy8
253215	0	1687	194.7	3192.1	257.5	0.007	0.787	0.013	1.041	14318	27.3	0.057	9	73.6	114.1	10.3	0.005	NA	NA	500m.my5739.cy8
218098	0	3300	270.6	4303.1	264.6	0.015	1.270	0.020	1.242	14732	61.0	0.068	22	73.3	75.8	10.4	0.009	NA	NA	500m.my8031.cy8
225068	0	291	49.0	154.7	33.7	0.001	0.223	0.001	0.153	1338	36.2	0.006	13	33.3	33.7	6.5	0.003	NA	NA	500m.fbmy5635.cay9c
185428	0	242	40.9	125.1	27.7	0.001	0.226	0.001	0.153	1310	36.8	0.007	16	33.3	33.9	8.4	0.005	NA	NA	500m.fbmy8028.cay9c
l.i1
l.i1: continue load after secondary indexes created
Performance metrics for all DBMS, not just the ones listed above. Some are normalized by throughput, others are not. Legend for results is here.
ips	qps	rps	rmbps	wps	wmbps	rpq	rkbpq	wpi	wkbpi	csps	cpups	cspq	cpupq	dbgb1	dbgb2	rss	maxop	p50	p99	tag
4847	0	2868	43.9	4273.9	142.5	0.592	9.264	0.882	30.096	15497	9.6	3.197	158	105.4	149.4	10.5	3.493	350	0	500m.my5651.cy8
4854	0	2798	43.7	4066.8	138.4	0.576	9.221	0.838	29.203	14964	13.7	3.083	226	105.4	149.3	10.7	1.935	350	50	500m.my5739.cy8
4361	0	2554	39.9	5064.5	148.3	0.586	9.371	1.161	34.831	20515	15.7	4.704	288	105.0	110.7	10.7	1.849	350	50	500m.my8031.cy8
75758	0	1	0.1	289.0	64.7	0.000	0.001	0.004	0.874	17048	59.9	0.225	63	34.7	36.4	6.6	0.183	25682	1049	500m.fbmy5635.cay9c
62893	0	4	0.4	242.0	53.4	0.000	0.007	0.004	0.869	14644	58.1	0.233	74	34.5	36.4	7.0	0.256	21576	15063	500m.fbmy8028.cay9c
q100.1
q100.1: range queries with 100 insert/s per client
Performance metrics for all DBMS, not just the ones listed above. Some are normalized by throughput, others are not. Legend for results is here.
ips	qps	rps	rmbps	wps	wmbps	rpq	rkbpq	wpi	wkbpi	csps	cpups	cspq	cpupq	dbgb1	dbgb2	rss	maxop	p50	p99	tag
300	2040	10505	164.1	1246.2	36.8	5.149	82.345	4.161	125.848	30756	10.5	15.074	412	105.4	149.4	10.5	0.167	751	32	500m.my5651.cy8
300	2062	10620	165.9	1271.4	37.4	5.151	82.412	4.245	127.883	31227	12.1	15.145	469	105.4	149.4	10.7	0.222	767	64	500m.my5739.cy8
300	1801	9260	144.7	1478.3	37.4	5.142	82.279	4.936	127.850	29141	13.0	16.183	578	105.0	110.8	10.7	0.143	687	48	500m.my8031.cy8
300	7373	172	1.4	8.9	0.9	0.023	0.196	0.030	3.082	29008	37.6	3.934	408	34.6	36.5	7.7	0.071	2445	1886	500m.fbmy5635.cay9c
300	6959	172	1.4	5.1	0.5	0.025	0.206	0.017	1.667	27518	38.2	3.954	439	34.6	36.6	7.5	0.057	2319	1710	500m.fbmy8028.cay9c
q500.1
q500.1: range queries with 500 insert/s per client
Performance metrics for all DBMS, not just the ones listed above. Some are normalized by throughput, others are not. Legend for results is here.
ips	qps	rps	rmbps	wps	wmbps	rpq	rkbpq	wpi	wkbpi	csps	cpups	cspq	cpupq	dbgb1	dbgb2	rss	maxop	p50	p99	tag
1498	1693	8745	136.4	1865.7	55.3	5.165	82.458	1.246	37.826	27551	10.6	16.271	501	105.8	149.8	10.5	0.194	607	48	500m.my5651.cy8
1498	1702	8772	137.1	1887.5	55.6	5.154	82.467	1.260	37.983	27771	12.2	16.317	573	105.8	149.7	10.7	0.263	591	128	500m.my5739.cy8
1498	1368	7059	110.3	2299.9	58.5	5.161	82.582	1.535	39.961	25641	13.0	18.748	760	105.4	111.2	10.7	0.148	479	48	500m.my8031.cy8
1498	7573	3	0.3	16.4	2.8	0.000	0.042	0.011	1.904	29521	39.2	3.898	414	35.3	35.8	10.5	0.012	2510	2206	500m.fbmy5635.cay9c
1498	7371	1	0.1	12.2	2.3	0.000	0.018	0.008	1.542	28832	39.9	3.912	433	35.3	36.0	10.5	0.016	2429	2014	500m.fbmy8028.cay9c
q1000.1
q1000.1: range queries with 1000 insert/s per client
Performance metrics for all DBMS, not just the ones listed above. Some are normalized by throughput, others are not. Legend for results is here.
ips	qps	rps	rmbps	wps	wmbps	rpq	rkbpq	wpi	wkbpi	csps	cpups	cspq	cpupq	dbgb1	dbgb2	rss	maxop	p50	p99	tag
2995	1234	6707	104.2	2551.7	76.2	5.434	86.456	0.852	26.069	23289	11.6	18.867	752	106.5	150.5	10.5	0.261	448	32	500m.my5651.cy8
2995	1249	6750	105.5	2592.0	77.0	5.406	86.496	0.865	26.331	23584	13.4	18.889	859	106.5	150.4	10.7	0.275	448	16	500m.my5739.cy8
2996	959	5231	81.7	3240.8	83.2	5.453	87.251	1.082	28.435	23083	14.8	24.063	1234	106.1	111.9	10.7	0.145	336	48	500m.my8031.cy8
2995	7676	5	0.6	32.1	6.2	0.001	0.075	0.011	2.127	29944	41.0	3.901	427	36.2	38.1	10.5	0.027	2557	2254	500m.fbmy5635.cay9c
2995	7425	2	0.2	23.8	4.7	0.000	0.032	0.008	1.622	29015	41.6	3.908	448	36.1	38.2	10.6	0.017	2493	2046	500m.fbmy8028.cay9c
l.i0
- l.i0: load without secondary indexes
- Legend for results is here.
- Each entry lists the percentage of responses that fit in that bucket (slower than max time for previous bucket, faster than min time for next bucket).
Insert response time histogram
256us	1ms	4ms	16ms	64ms	256ms	1s	4s	16s	gt	max	tag
0.000	2.138	97.337	0.317	0.189	0.019	nonzero	nonzero	0.000	0.000	1.225	my5651.cy8
0.000	0.016	99.761	0.189	0.022	0.010	0.002	0.000	0.000	0.000	0.484	my5739.cy8
0.000	0.000	99.725	0.231	0.029	0.013	0.001	nonzero	0.000	0.000	1.952	my8031.cy8
0.000	0.000	99.965	0.019	0.004	0.009	0.003	0.000	0.000	0.000	0.631	fbmy5635.cay9c
0.000	0.000	99.766	0.204	0.014	0.013	0.003	0.000	0.000	0.000	0.628	fbmy8028.cay9c
l.x
- l.x: create secondary indexes
- Legend for results is here.
- Each entry lists the percentage of responses that fit in that bucket (slower than max time for previous bucket, faster than min time for next bucket).
TODO - determine whether there is data for create index response time
l.i1
- l.i1: continue load after secondary indexes created
- Legend for results is here.
- Each entry lists the percentage of responses that fit in that bucket (slower than max time for previous bucket, faster than min time for next bucket).
Insert response time histogram
256us	1ms	4ms	16ms	64ms	256ms	1s	4s	16s	gt	max	tag
0.000	0.000	22.214	56.278	12.505	6.264	2.540	0.199	0.000	0.000	3.493	my5651.cy8
0.000	0.000	1.755	77.679	11.066	6.568	2.772	0.160	0.000	0.000	1.935	my5739.cy8
0.000	0.000	0.038	73.576	12.911	10.884	2.578	0.012	0.000	0.000	1.849	my8031.cy8
0.000	0.000	99.902	0.082	0.011	0.004	0.000	0.000	0.000	0.000	0.183	fbmy5635.cay9c
0.000	0.000	99.752	0.214	0.023	0.010	nonzero	0.000	0.000	0.000	0.256	fbmy8028.cay9c
q100.1
- q100.1: range queries with 100 insert/s per client
- Legend for results is here.
- Each entry lists the percentage of responses that fit in that bucket (slower than max time for previous bucket, faster than min time for next bucket).
Query response time histogram
256us	1ms	4ms	16ms	64ms	256ms	1s	4s	16s	gt	max	tag
29.263	16.655	51.961	1.130	0.947	0.044	0.000	0.000	0.000	0.000	0.167	my5651.cy8
9.809	35.553	52.946	0.689	0.953	0.051	0.000	0.000	0.000	0.000	0.222	my5739.cy8
4.625	38.387	53.880	1.844	1.260	0.005	0.000	0.000	0.000	0.000	0.143	my8031.cy8
4.710	95.272	0.013	0.005	nonzero	nonzero	0.000	0.000	0.000	0.000	0.071	fbmy5635.cay9c
0.401	99.580	0.014	0.004	nonzero	0.000	0.000	0.000	0.000	0.000	0.057	fbmy8028.cay9c
Insert response time histogram
256us	1ms	4ms	16ms	64ms	256ms	1s	4s	16s	gt	max	tag
0.000	0.000	1.037	69.106	23.681	6.176	0.000	0.000	0.000	0.000	0.253	my5651.cy8
0.000	0.000	0.005	79.560	13.731	6.653	0.051	0.000	0.000	0.000	0.339	my5739.cy8
0.000	0.000	0.023	82.102	16.718	1.157	0.000	0.000	0.000	0.000	0.144	my8031.cy8
0.000	0.000	99.898	0.097	0.005	0.000	0.000	0.000	0.000	0.000	0.018	fbmy5635.cay9c
0.000	0.000	99.931	0.069	0.000	0.000	0.000	0.000	0.000	0.000	0.009	fbmy8028.cay9c
q500.1
- q500.1: range queries with 500 insert/s per client
- Legend for results is here.
- Each entry lists the percentage of responses that fit in that bucket (slower than max time for previous bucket, faster than min time for next bucket).
Query response time histogram
256us	1ms	4ms	16ms	64ms	256ms	1s	4s	16s	gt	max	tag
27.919	16.711	51.532	2.018	1.745	0.074	0.000	0.000	0.000	0.000	0.194	my5651.cy8
10.301	33.530	53.376	0.988	1.687	0.118	nonzero	0.000	0.000	0.000	0.263	my5739.cy8
4.458	37.264	52.140	3.294	2.830	0.013	0.000	0.000	0.000	0.000	0.148	my8031.cy8
6.145	93.835	0.019	0.002	0.000	0.000	0.000	0.000	0.000	0.000	0.012	fbmy5635.cay9c
0.567	99.405	0.026	0.002	nonzero	0.000	0.000	0.000	0.000	0.000	0.016	fbmy8028.cay9c
Insert response time histogram
256us	1ms	4ms	16ms	64ms	256ms	1s	4s	16s	gt	max	tag
0.000	0.000	19.562	58.320	21.016	1.102	0.000	0.000	0.000	0.000	0.168	my5651.cy8
0.000	0.000	17.474	72.948	8.946	0.631	0.000	0.000	0.000	0.000	0.199	my5739.cy8
0.000	0.000	0.398	91.386	8.076	0.140	0.000	0.000	0.000	0.000	0.156	my8031.cy8
0.000	0.000	98.760	1.238	0.002	0.000	0.000	0.000	0.000	0.000	0.019	fbmy5635.cay9c
0.000	0.000	96.515	3.479	0.006	0.000	0.000	0.000	0.000	0.000	0.019	fbmy8028.cay9c
q1000.1
- q1000.1: range queries with 1000 insert/s per client
- Legend for results is here.
- Each entry lists the percentage of responses that fit in that bucket (slower than max time for previous bucket, faster than min time for next bucket).
Query response time histogram
256us	1ms	4ms	16ms	64ms	256ms	1s	4s	16s	gt	max	tag
25.549	16.588	51.490	2.769	3.418	0.186	nonzero	0.000	0.000	0.000	0.261	my5651.cy8
10.244	31.389	53.589	1.308	3.189	0.281	nonzero	0.000	0.000	0.000	0.275	my5739.cy8
3.932	35.872	48.293	6.628	5.246	0.029	0.000	0.000	0.000	0.000	0.145	my8031.cy8
6.467	93.488	0.044	0.002	nonzero	0.000	0.000	0.000	0.000	0.000	0.027	fbmy5635.cay9c
0.465	99.481	0.053	0.001	nonzero	0.000	0.000	0.000	0.000	0.000	0.017	fbmy8028.cay9c
Insert response time histogram
256us	1ms	4ms	16ms	64ms	256ms	1s	4s	16s	gt	max	tag
0.000	0.000	19.226	57.026	22.276	1.471	0.001	0.000	0.000	0.000	0.309	my5651.cy8
0.000	0.000	5.570	80.263	13.367	0.800	0.000	0.000	0.000	0.000	0.222	my5739.cy8
0.000	0.000	0.006	89.467	10.370	0.157	0.000	0.000	0.000	0.000	0.148	my8031.cy8
0.000	0.000	97.701	2.296	0.003	0.000	0.000	0.000	0.000	0.000	0.025	fbmy5635.cay9c
0.000	0.000	95.612	4.384	0.004	0.000	0.000	0.000	0.000	0.000	0.020	fbmy8028.cay9c