Introduction
This is a report for the insert benchmark with 500M docs and 2 client(s). It is generated by scripts (bash, awk, sed) and Tufte might not be impressed. An overview of the insert benchmark is here and a short update is here. Below, by DBMS, I mean DBMS+version.config. An example is my8020.c10b40 where my means MySQL, 8020 is version 8.0.20 and c10b40 is the name for the configuration file.
The test server has 8 AMD cores, 16G RAM and an NVMe SSD. It is described here as the Beelink. The benchmark was run with 2 clients and there were 1 or 2 connections per client (1 for queries, 1 for inserts). The benchmark loads 500M rows without secondary indexes, creates secondary indexes, loads another 10M rows then does 3 read+write tests for one hour each that do queries as fast as possible with 100, 500 and then 1000 writes/second/client concurrent with the queries. The database doesn't fit in memory and parts of the benchmark are IO-bound. Clients and the DBMS share one server. The per-database configs are in the per-database subdirectories here.
The tested DBMS are:
- my5651.cy8 - MySQL 5.6.51, InnoDB and the cy8 config
- my5739.cy8 - MySQL 5.7.39, InnoDB and the cy8 config
- my8031.cy8 - MySQL 8.0.31, InnoDB and the cy8 config
- fbmy5635.cay9c - FB MySQL 5.6.35, MyRocks and the cay9c config
- fbmy8028.cay9c - FB MySQL 8.0.28, MyRocks and the cay9c config
Contents
- Summary
- l.i0: load without secondary indexes
- l.x: create secondary indexes
- l.i1: continue load after secondary indexes created
- q100.1: range queries with 100 insert/s per client
- q500.1: range queries with 500 insert/s per client
- q1000.1: range queries with 1000 insert/s per client
Summary
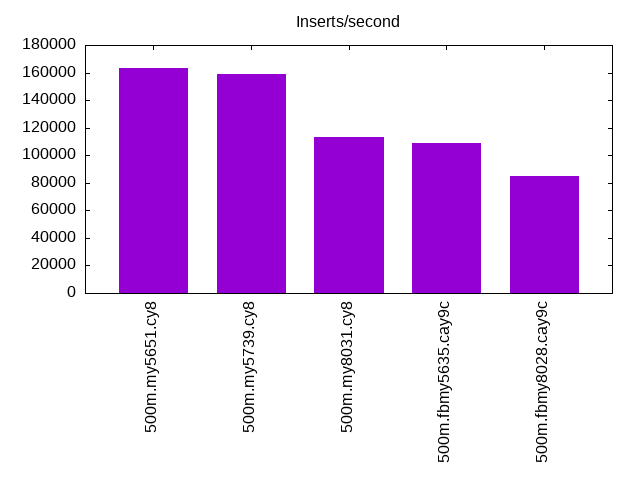
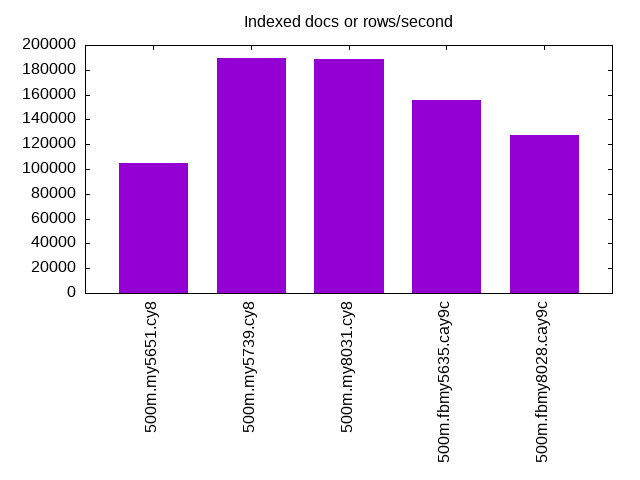
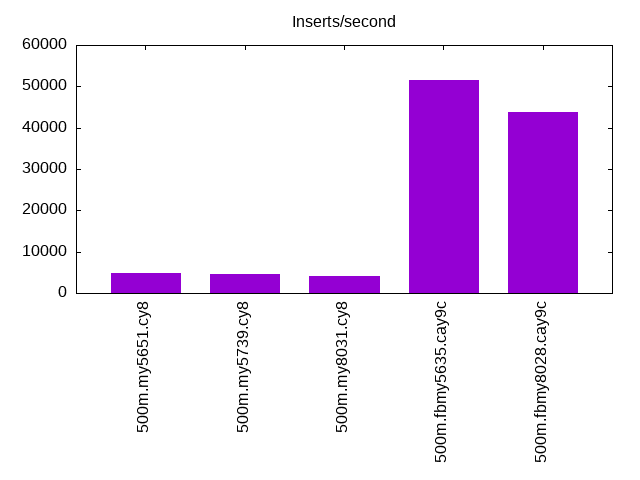
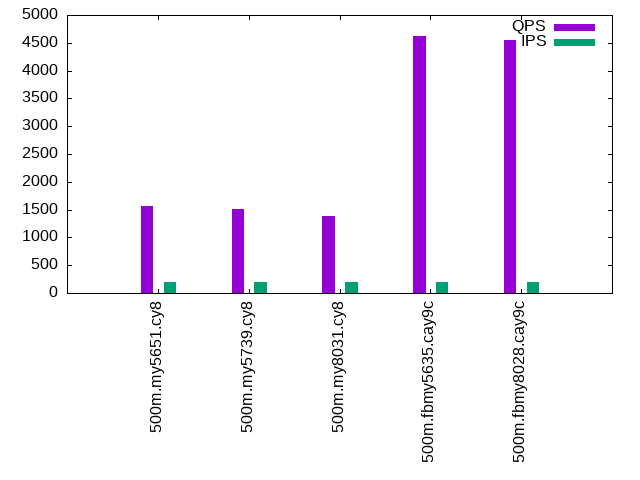
The numbers are inserts/s for l.i0 and l.i1, indexed docs (or rows) /s for l.x and queries/s for q*.2. The values are the average rate over the entire test for inserts (IPS) and queries (QPS). The range of values for IPS and QPS is split into 3 parts: bottom 25%, middle 50%, top 25%. Values in the bottom 25% have a red background, values in the top 25% have a green background and values in the middle have no color. A gray background is used for values that can be ignored because the DBMS did not sustain the target insert rate. Red backgrounds are not used when the minimum value is within 80% of the max value.
| dbms | l.i0 | l.x | l.i1 | q100.1 | q500.1 | q1000.1 |
|---|---|---|---|---|---|---|
| 500m.my5651.cy8 | 163666 | 105019 | 4719 | 1564 | 1461 | 1254 |
| 500m.my5739.cy8 | 159185 | 189217 | 4543 | 1509 | 1465 | 1236 |
| 500m.my8031.cy8 | 112994 | 188362 | 4146 | 1389 | 1248 | 996 |
| 500m.fbmy5635.cay9c | 108838 | 155262 | 51546 | 4626 | 4802 | 4866 |
| 500m.fbmy8028.cay9c | 85222 | 127058 | 43860 | 4557 | 4824 | 4812 |
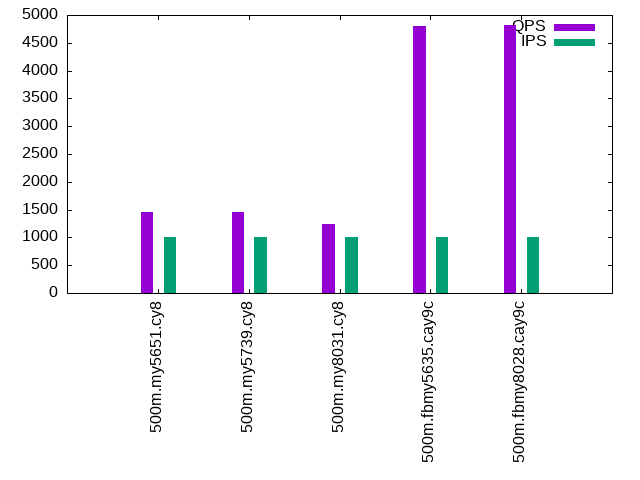
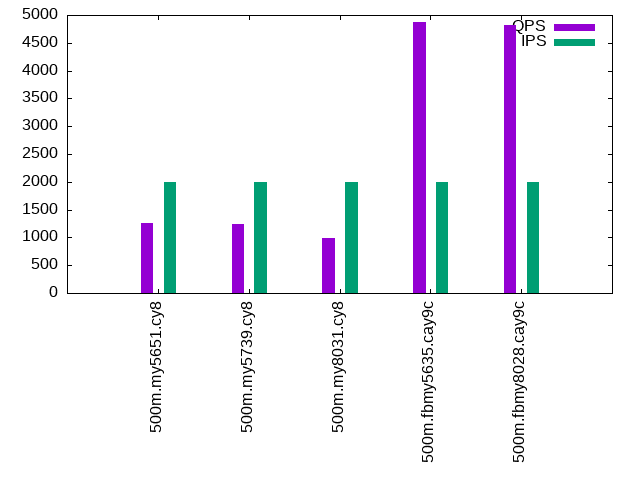
This lists the average rate of inserts/s for the tests that do inserts concurrent with queries. For such tests the query rate is listed in the table above. The read+write tests are setup so that the insert rate should match the target rate every second. Cells that are not at least 95% of the target have a red background to indicate a failure to satisfy the target.
| dbms | q100.1 | q500.1 | q1000.1 |
|---|---|---|---|
| my5651.cy8 | 200 | 999 | 1998 |
| my5739.cy8 | 200 | 999 | 1997 |
| my8031.cy8 | 200 | 999 | 1997 |
| fbmy5635.cay9c | 200 | 999 | 1997 |
| fbmy8028.cay9c | 200 | 999 | 1997 |
| target | 200 | 1000 | 2000 |
l.i0
l.i0: load without secondary indexes. Graphs for performance per 1-second interval are here.
Average throughput:
Insert response time histogram: each cell has the percentage of responses that take <= the time in the header and max is the max response time in seconds. For the max column values in the top 25% of the range have a red background and in the bottom 25% of the range have a green background. The red background is not used when the min value is within 80% of the max value.
| dbms | 256us | 1ms | 4ms | 16ms | 64ms | 256ms | 1s | 4s | 16s | gt | max |
|---|---|---|---|---|---|---|---|---|---|---|---|
| my5651.cy8 | 13.506 | 86.043 | 0.305 | 0.133 | 0.012 | nonzero | nonzero | 1.268 | |||
| my5739.cy8 | 0.061 | 99.755 | 0.160 | 0.015 | 0.008 | 0.001 | nonzero | 1.072 | |||
| my8031.cy8 | 99.772 | 0.188 | 0.032 | 0.006 | 0.002 | nonzero | 1.710 | ||||
| fbmy5635.cay9c | 99.982 | 0.008 | 0.003 | 0.005 | 0.002 | 0.630 | |||||
| fbmy8028.cay9c | 99.873 | 0.111 | 0.007 | 0.008 | 0.002 | 0.585 |
Performance metrics for the DBMS listed above. Some are normalized by throughput, others are not. Legend for results is here.
ips	qps	rps	rmbps	wps	wmbps	rpq	rkbpq	wpi	wkbpi	csps	cpups	cspq	cpupq	dbgb1	dbgb2	rss	maxop	p50	p99	tag
163666	0	1433	5.6	682.9	52.7	0.009	0.035	0.004	0.330	20265	40.8	0.124	20	32.9	73.4	10.6	1.268	83907	48047	500m.my5651.cy8
159185	0	0	0.0	735.2	53.1	0.000	0.000	0.005	0.342	17760	43.3	0.112	22	32.9	73.4	10.9	1.072	79911	61731	500m.my5739.cy8
112994	0	0	0.0	736.9	42.8	0.000	0.000	0.007	0.388	13686	42.2	0.121	30	32.8	35.2	11.1	1.710	56751	42154	500m.my8031.cy8
108838	0	0	0.0	201.3	44.7	0.000	0.000	0.002	0.420	12090	43.2	0.111	32	15.7	16.1	4.1	0.630	54141	39375	500m.fbmy5635.cay9c
85222	0	0	0.0	157.6	33.8	0.000	0.001	0.002	0.407	9812	41.2	0.115	39	15.6	16.2	4.3	0.585	42453	33280	500m.fbmy8028.cay9c
l.x
l.x: create secondary indexes.
Average throughput:
Performance metrics for the DBMS listed above. Some are normalized by throughput, others are not. Legend for results is here.
ips	qps	rps	rmbps	wps	wmbps	rpq	rkbpq	wpi	wkbpi	csps	cpups	cspq	cpupq	dbgb1	dbgb2	rss	maxop	p50	p99	tag
105019	0	1103	90.0	3934.0	169.3	0.010	0.878	0.037	1.651	13890	19.4	0.132	15	67.8	108.3	10.5	0.027	NA	NA	500m.my5651.cy8
189217	0	1298	154.1	2343.1	199.4	0.007	0.834	0.012	1.079	11517	20.2	0.061	9	73.6	114.1	10.2	0.007	NA	NA	500m.my5739.cy8
188362	0	3011	258.8	3681.2	231.5	0.016	1.407	0.020	1.259	12802	65.4	0.068	28	73.3	75.7	10.4	0.009	NA	NA	500m.my8031.cy8
155262	0	198	33.2	106.2	23.1	0.001	0.219	0.001	0.152	1008	24.6	0.006	13	32.9	33.3	6.5	0.003	NA	NA	500m.fbmy5635.cay9c
127058	0	162	27.2	85.4	18.9	0.001	0.219	0.001	0.152	1077	24.7	0.008	16	32.8	33.4	8.4	0.004	NA	NA	500m.fbmy8028.cay9c
l.i1
l.i1: continue load after secondary indexes created. Graphs for performance per 1-second interval are here.
Average throughput:
Insert response time histogram: each cell has the percentage of responses that take <= the time in the header and max is the max response time in seconds. For the max column values in the top 25% of the range have a red background and in the bottom 25% of the range have a green background. The red background is not used when the min value is within 80% of the max value.
| dbms | 256us | 1ms | 4ms | 16ms | 64ms | 256ms | 1s | 4s | 16s | gt | max |
|---|---|---|---|---|---|---|---|---|---|---|---|
| my5651.cy8 | 25.239 | 57.047 | 11.907 | 4.192 | 1.544 | 0.072 | 1.962 | ||||
| my5739.cy8 | 0.815 | 82.888 | 10.268 | 4.386 | 1.586 | 0.057 | 1.514 | ||||
| my8031.cy8 | 0.103 | 78.997 | 12.318 | 7.152 | 1.430 | 0.926 | |||||
| fbmy5635.cay9c | 99.946 | 0.041 | 0.009 | 0.004 | 0.221 | ||||||
| fbmy8028.cay9c | 99.846 | 0.135 | 0.013 | 0.006 | 0.177 |
Performance metrics for the DBMS listed above. Some are normalized by throughput, others are not. Legend for results is here.
ips	qps	rps	rmbps	wps	wmbps	rpq	rkbpq	wpi	wkbpi	csps	cpups	cspq	cpupq	dbgb1	dbgb2	rss	maxop	p50	p99	tag
4719	0	2632	40.2	3917.1	132.3	0.558	8.729	0.830	28.711	14396	8.8	3.051	149	103.6	147.4	10.5	1.962	599	0	500m.my5651.cy8
4543	0	2461	38.4	3642.0	123.8	0.542	8.666	0.802	27.902	13892	12.4	3.058	218	103.6	147.3	10.7	1.514	649	50	500m.my5739.cy8
4146	0	2280	35.6	4628.5	135.2	0.550	8.800	1.116	33.390	19132	13.8	4.615	266	103.2	108.7	10.7	0.926	599	50	500m.my8031.cy8
51546	0	2	0.2	236.7	52.9	0.000	0.004	0.005	1.051	12511	44.4	0.243	69	34.4	36.1	6.7	0.221	25971	19536	500m.fbmy5635.cay9c
43860	0	0	0.0	182.1	40.1	0.000	0.000	0.004	0.935	10659	41.7	0.243	76	34.1	36.0	7.1	0.177	21975	17330	500m.fbmy8028.cay9c
q100.1
q100.1: range queries with 100 insert/s per client. Graphs for performance per 1-second interval are here.
Average throughput:
Query response time histogram: each cell has the percentage of responses that take <= the time in the header and max is the max response time in seconds. For max values in the top 25% of the range have a red background and in the bottom 25% of the range have a green background. The red background is not used when the min value is within 80% of the max value.
| dbms | 256us | 1ms | 4ms | 16ms | 64ms | 256ms | 1s | 4s | 16s | gt | max |
|---|---|---|---|---|---|---|---|---|---|---|---|
| my5651.cy8 | 31.358 | 14.786 | 52.173 | 1.115 | 0.543 | 0.024 | 0.159 | ||||
| my5739.cy8 | 8.615 | 36.471 | 53.628 | 0.530 | 0.712 | 0.044 | 0.178 | ||||
| my8031.cy8 | 4.158 | 39.292 | 54.366 | 1.396 | 0.781 | 0.007 | 0.112 | ||||
| fbmy5635.cay9c | 1.228 | 98.756 | 0.012 | 0.004 | nonzero | nonzero | 0.089 | ||||
| fbmy8028.cay9c | 0.521 | 99.463 | 0.013 | 0.003 | nonzero | 0.035 |
Insert response time histogram: each cell has the percentage of responses that take <= the time in the header and max is the max response time in seconds. For max values in the top 25% of the range have a red background and in the bottom 25% of the range have a green background. The red background is not used when the min value is within 80% of the max value.
| dbms | 256us | 1ms | 4ms | 16ms | 64ms | 256ms | 1s | 4s | 16s | gt | max |
|---|---|---|---|---|---|---|---|---|---|---|---|
| my5651.cy8 | 0.014 | 31.188 | 55.736 | 13.062 | 0.218 | ||||||
| my5739.cy8 | 81.674 | 11.979 | 6.347 | 0.244 | |||||||
| my8031.cy8 | 0.007 | 86.854 | 12.736 | 0.403 | 0.127 | ||||||
| fbmy5635.cay9c | 99.951 | 0.049 | 0.008 | ||||||||
| fbmy8028.cay9c | 88.979 | 11.021 | 0.010 |
Performance metrics for the DBMS listed above. Some are normalized by throughput, others are not. Legend for results is here.
ips	qps	rps	rmbps	wps	wmbps	rpq	rkbpq	wpi	wkbpi	csps	cpups	cspq	cpupq	dbgb1	dbgb2	rss	maxop	p50	p99	tag
200	1564	7854	122.7	1012.8	29.9	5.020	80.291	5.072	153.511	23285	7.7	14.884	394	103.6	147.4	10.5	0.159	848	48	500m.my5651.cy8
200	1509	7578	118.4	1005.1	29.7	5.023	80.362	5.033	152.122	22685	8.6	15.035	456	103.6	147.4	10.7	0.178	799	48	500m.my5739.cy8
200	1389	6967	108.9	1201.1	30.4	5.016	80.252	6.015	155.775	22441	9.8	16.155	564	103.2	108.7	10.7	0.112	767	64	500m.my8031.cy8
200	4626	115	1.0	7.9	0.6	0.025	0.216	0.040	3.332	18383	25.6	3.974	443	34.2	35.9	6.7	0.089	2333	1950	500m.fbmy5635.cay9c
200	4557	115	0.9	4.3	0.3	0.025	0.209	0.022	1.536	18254	26.0	4.006	456	34.1	36.1	7.1	0.035	2301	1742	500m.fbmy8028.cay9c
q500.1
q500.1: range queries with 500 insert/s per client. Graphs for performance per 1-second interval are here.
Average throughput:
Query response time histogram: each cell has the percentage of responses that take <= the time in the header and max is the max response time in seconds. For max values in the top 25% of the range have a red background and in the bottom 25% of the range have a green background. The red background is not used when the min value is within 80% of the max value.
| dbms | 256us | 1ms | 4ms | 16ms | 64ms | 256ms | 1s | 4s | 16s | gt | max |
|---|---|---|---|---|---|---|---|---|---|---|---|
| my5651.cy8 | 29.983 | 15.494 | 52.365 | 1.343 | 0.788 | 0.027 | 0.177 | ||||
| my5739.cy8 | 7.830 | 36.514 | 54.051 | 0.676 | 0.897 | 0.032 | 0.175 | ||||
| my8031.cy8 | 3.977 | 39.066 | 53.767 | 1.927 | 1.252 | 0.011 | 0.118 | ||||
| fbmy5635.cay9c | 2.599 | 97.391 | 0.009 | 0.002 | nonzero | 0.031 | |||||
| fbmy8028.cay9c | 0.743 | 99.248 | 0.009 | 0.001 | 0.010 |
Insert response time histogram: each cell has the percentage of responses that take <= the time in the header and max is the max response time in seconds. For max values in the top 25% of the range have a red background and in the bottom 25% of the range have a green background. The red background is not used when the min value is within 80% of the max value.
| dbms | 256us | 1ms | 4ms | 16ms | 64ms | 256ms | 1s | 4s | 16s | gt | max |
|---|---|---|---|---|---|---|---|---|---|---|---|
| my5651.cy8 | 16.328 | 62.913 | 20.042 | 0.718 | 0.155 | ||||||
| my5739.cy8 | 16.218 | 79.958 | 3.597 | 0.226 | 0.150 | ||||||
| my8031.cy8 | 0.933 | 94.446 | 4.571 | 0.050 | 0.150 | ||||||
| fbmy5635.cay9c | 99.969 | 0.029 | 0.001 | 0.019 | |||||||
| fbmy8028.cay9c | 99.544 | 0.456 | 0.013 |
Performance metrics for the DBMS listed above. Some are normalized by throughput, others are not. Legend for results is here.
ips	qps	rps	rmbps	wps	wmbps	rpq	rkbpq	wpi	wkbpi	csps	cpups	cspq	cpupq	dbgb1	dbgb2	rss	maxop	p50	p99	tag
999	1461	7300	113.9	1220.2	36.2	4.997	79.809	1.222	37.128	22428	8.3	15.351	454	103.9	147.7	10.5	0.177	752	511	500m.my5651.cy8
999	1465	7317	114.3	1225.6	36.3	4.993	79.894	1.227	37.264	22683	9.5	15.480	519	103.9	147.6	10.7	0.175	751	527	500m.my5739.cy8
999	1248	6233	97.4	1580.9	40.1	4.995	79.917	1.583	41.166	21657	10.4	17.355	667	103.5	109.0	10.7	0.118	640	384	500m.my8031.cy8
999	4802	0	0.0	12.3	1.8	0.000	0.005	0.012	1.803	18971	26.4	3.951	440	34.6	34.8	8.1	0.031	2381	2206	500m.fbmy5635.cay9c
999	4824	0	0.0	9.4	1.5	0.000	0.000	0.009	1.570	19197	27.1	3.979	449	34.6	35.0	7.5	0.010	2397	2014	500m.fbmy8028.cay9c
q1000.1
q1000.1: range queries with 1000 insert/s per client. Graphs for performance per 1-second interval are here.
Average throughput:
Query response time histogram: each cell has the percentage of responses that take <= the time in the header and max is the max response time in seconds. For max values in the top 25% of the range have a red background and in the bottom 25% of the range have a green background. The red background is not used when the min value is within 80% of the max value.
| dbms | 256us | 1ms | 4ms | 16ms | 64ms | 256ms | 1s | 4s | 16s | gt | max |
|---|---|---|---|---|---|---|---|---|---|---|---|
| my5651.cy8 | 27.816 | 16.492 | 52.366 | 1.925 | 1.354 | 0.048 | 0.161 | ||||
| my5739.cy8 | 7.519 | 35.648 | 54.293 | 0.938 | 1.530 | 0.072 | 0.166 | ||||
| my8031.cy8 | 3.677 | 37.955 | 52.655 | 3.451 | 2.241 | 0.022 | 0.133 | ||||
| fbmy5635.cay9c | 3.481 | 96.496 | 0.021 | 0.002 | 0.011 | ||||||
| fbmy8028.cay9c | 0.644 | 99.330 | 0.023 | 0.003 | 0.011 |
Insert response time histogram: each cell has the percentage of responses that take <= the time in the header and max is the max response time in seconds. For max values in the top 25% of the range have a red background and in the bottom 25% of the range have a green background. The red background is not used when the min value is within 80% of the max value.
| dbms | 256us | 1ms | 4ms | 16ms | 64ms | 256ms | 1s | 4s | 16s | gt | max |
|---|---|---|---|---|---|---|---|---|---|---|---|
| my5651.cy8 | 10.072 | 68.732 | 20.436 | 0.760 | 0.163 | ||||||
| my5739.cy8 | 11.904 | 81.491 | 6.312 | 0.292 | 0.194 | ||||||
| my8031.cy8 | 0.125 | 95.172 | 4.640 | 0.063 | 0.134 | ||||||
| fbmy5635.cay9c | 99.916 | 0.084 | 0.015 | ||||||||
| fbmy8028.cay9c | 99.761 | 0.236 | 0.003 | 0.021 |
Performance metrics for the DBMS listed above. Some are normalized by throughput, others are not. Legend for results is here.
ips	qps	rps	rmbps	wps	wmbps	rpq	rkbpq	wpi	wkbpi	csps	cpups	cspq	cpupq	dbgb1	dbgb2	rss	maxop	p50	p99	tag
1998	1254	6464	100.6	1774.2	52.8	5.154	82.136	0.888	27.056	21338	9.3	17.012	593	104.3	148.1	10.5	0.161	671	288	500m.my5651.cy8
1997	1236	6336	99.0	1750.1	52.2	5.129	82.059	0.876	26.767	21158	10.7	17.125	693	104.3	148.1	10.7	0.166	655	288	500m.my5739.cy8
1997	996	5140	80.3	2364.0	60.4	5.159	82.542	1.184	30.994	20802	11.7	20.877	939	103.9	109.5	10.7	0.133	527	96	500m.my8031.cy8
1997	4866	0	0.0	20.3	3.6	0.000	0.007	0.010	1.822	19426	27.7	3.992	455	35.3	36.5	10.5	0.011	2429	2237	500m.fbmy5635.cay9c
1997	4812	1	0.2	15.7	2.9	0.000	0.037	0.008	1.481	19337	28.4	4.019	472	35.1	36.4	10.7	0.011	2398	2014	500m.fbmy8028.cay9c
l.i0
l.i0: load without secondary indexes
Performance metrics for all DBMS, not just the ones listed above. Some are normalized by throughput, others are not. Legend for results is here.
ips	qps	rps	rmbps	wps	wmbps	rpq	rkbpq	wpi	wkbpi	csps	cpups	cspq	cpupq	dbgb1	dbgb2	rss	maxop	p50	p99	tag
163666	0	1433	5.6	682.9	52.7	0.009	0.035	0.004	0.330	20265	40.8	0.124	20	32.9	73.4	10.6	1.268	83907	48047	500m.my5651.cy8
159185	0	0	0.0	735.2	53.1	0.000	0.000	0.005	0.342	17760	43.3	0.112	22	32.9	73.4	10.9	1.072	79911	61731	500m.my5739.cy8
112994	0	0	0.0	736.9	42.8	0.000	0.000	0.007	0.388	13686	42.2	0.121	30	32.8	35.2	11.1	1.710	56751	42154	500m.my8031.cy8
108838	0	0	0.0	201.3	44.7	0.000	0.000	0.002	0.420	12090	43.2	0.111	32	15.7	16.1	4.1	0.630	54141	39375	500m.fbmy5635.cay9c
85222	0	0	0.0	157.6	33.8	0.000	0.001	0.002	0.407	9812	41.2	0.115	39	15.6	16.2	4.3	0.585	42453	33280	500m.fbmy8028.cay9c
l.x
l.x: create secondary indexes
Performance metrics for all DBMS, not just the ones listed above. Some are normalized by throughput, others are not. Legend for results is here.
ips	qps	rps	rmbps	wps	wmbps	rpq	rkbpq	wpi	wkbpi	csps	cpups	cspq	cpupq	dbgb1	dbgb2	rss	maxop	p50	p99	tag
105019	0	1103	90.0	3934.0	169.3	0.010	0.878	0.037	1.651	13890	19.4	0.132	15	67.8	108.3	10.5	0.027	NA	NA	500m.my5651.cy8
189217	0	1298	154.1	2343.1	199.4	0.007	0.834	0.012	1.079	11517	20.2	0.061	9	73.6	114.1	10.2	0.007	NA	NA	500m.my5739.cy8
188362	0	3011	258.8	3681.2	231.5	0.016	1.407	0.020	1.259	12802	65.4	0.068	28	73.3	75.7	10.4	0.009	NA	NA	500m.my8031.cy8
155262	0	198	33.2	106.2	23.1	0.001	0.219	0.001	0.152	1008	24.6	0.006	13	32.9	33.3	6.5	0.003	NA	NA	500m.fbmy5635.cay9c
127058	0	162	27.2	85.4	18.9	0.001	0.219	0.001	0.152	1077	24.7	0.008	16	32.8	33.4	8.4	0.004	NA	NA	500m.fbmy8028.cay9c
l.i1
l.i1: continue load after secondary indexes created
Performance metrics for all DBMS, not just the ones listed above. Some are normalized by throughput, others are not. Legend for results is here.
ips	qps	rps	rmbps	wps	wmbps	rpq	rkbpq	wpi	wkbpi	csps	cpups	cspq	cpupq	dbgb1	dbgb2	rss	maxop	p50	p99	tag
4719	0	2632	40.2	3917.1	132.3	0.558	8.729	0.830	28.711	14396	8.8	3.051	149	103.6	147.4	10.5	1.962	599	0	500m.my5651.cy8
4543	0	2461	38.4	3642.0	123.8	0.542	8.666	0.802	27.902	13892	12.4	3.058	218	103.6	147.3	10.7	1.514	649	50	500m.my5739.cy8
4146	0	2280	35.6	4628.5	135.2	0.550	8.800	1.116	33.390	19132	13.8	4.615	266	103.2	108.7	10.7	0.926	599	50	500m.my8031.cy8
51546	0	2	0.2	236.7	52.9	0.000	0.004	0.005	1.051	12511	44.4	0.243	69	34.4	36.1	6.7	0.221	25971	19536	500m.fbmy5635.cay9c
43860	0	0	0.0	182.1	40.1	0.000	0.000	0.004	0.935	10659	41.7	0.243	76	34.1	36.0	7.1	0.177	21975	17330	500m.fbmy8028.cay9c
q100.1
q100.1: range queries with 100 insert/s per client
Performance metrics for all DBMS, not just the ones listed above. Some are normalized by throughput, others are not. Legend for results is here.
ips	qps	rps	rmbps	wps	wmbps	rpq	rkbpq	wpi	wkbpi	csps	cpups	cspq	cpupq	dbgb1	dbgb2	rss	maxop	p50	p99	tag
200	1564	7854	122.7	1012.8	29.9	5.020	80.291	5.072	153.511	23285	7.7	14.884	394	103.6	147.4	10.5	0.159	848	48	500m.my5651.cy8
200	1509	7578	118.4	1005.1	29.7	5.023	80.362	5.033	152.122	22685	8.6	15.035	456	103.6	147.4	10.7	0.178	799	48	500m.my5739.cy8
200	1389	6967	108.9	1201.1	30.4	5.016	80.252	6.015	155.775	22441	9.8	16.155	564	103.2	108.7	10.7	0.112	767	64	500m.my8031.cy8
200	4626	115	1.0	7.9	0.6	0.025	0.216	0.040	3.332	18383	25.6	3.974	443	34.2	35.9	6.7	0.089	2333	1950	500m.fbmy5635.cay9c
200	4557	115	0.9	4.3	0.3	0.025	0.209	0.022	1.536	18254	26.0	4.006	456	34.1	36.1	7.1	0.035	2301	1742	500m.fbmy8028.cay9c
q500.1
q500.1: range queries with 500 insert/s per client
Performance metrics for all DBMS, not just the ones listed above. Some are normalized by throughput, others are not. Legend for results is here.
ips	qps	rps	rmbps	wps	wmbps	rpq	rkbpq	wpi	wkbpi	csps	cpups	cspq	cpupq	dbgb1	dbgb2	rss	maxop	p50	p99	tag
999	1461	7300	113.9	1220.2	36.2	4.997	79.809	1.222	37.128	22428	8.3	15.351	454	103.9	147.7	10.5	0.177	752	511	500m.my5651.cy8
999	1465	7317	114.3	1225.6	36.3	4.993	79.894	1.227	37.264	22683	9.5	15.480	519	103.9	147.6	10.7	0.175	751	527	500m.my5739.cy8
999	1248	6233	97.4	1580.9	40.1	4.995	79.917	1.583	41.166	21657	10.4	17.355	667	103.5	109.0	10.7	0.118	640	384	500m.my8031.cy8
999	4802	0	0.0	12.3	1.8	0.000	0.005	0.012	1.803	18971	26.4	3.951	440	34.6	34.8	8.1	0.031	2381	2206	500m.fbmy5635.cay9c
999	4824	0	0.0	9.4	1.5	0.000	0.000	0.009	1.570	19197	27.1	3.979	449	34.6	35.0	7.5	0.010	2397	2014	500m.fbmy8028.cay9c
q1000.1
q1000.1: range queries with 1000 insert/s per client
Performance metrics for all DBMS, not just the ones listed above. Some are normalized by throughput, others are not. Legend for results is here.
ips	qps	rps	rmbps	wps	wmbps	rpq	rkbpq	wpi	wkbpi	csps	cpups	cspq	cpupq	dbgb1	dbgb2	rss	maxop	p50	p99	tag
1998	1254	6464	100.6	1774.2	52.8	5.154	82.136	0.888	27.056	21338	9.3	17.012	593	104.3	148.1	10.5	0.161	671	288	500m.my5651.cy8
1997	1236	6336	99.0	1750.1	52.2	5.129	82.059	0.876	26.767	21158	10.7	17.125	693	104.3	148.1	10.7	0.166	655	288	500m.my5739.cy8
1997	996	5140	80.3	2364.0	60.4	5.159	82.542	1.184	30.994	20802	11.7	20.877	939	103.9	109.5	10.7	0.133	527	96	500m.my8031.cy8
1997	4866	0	0.0	20.3	3.6	0.000	0.007	0.010	1.822	19426	27.7	3.992	455	35.3	36.5	10.5	0.011	2429	2237	500m.fbmy5635.cay9c
1997	4812	1	0.2	15.7	2.9	0.000	0.037	0.008	1.481	19337	28.4	4.019	472	35.1	36.4	10.7	0.011	2398	2014	500m.fbmy8028.cay9c
l.i0
- l.i0: load without secondary indexes
- Legend for results is here.
- Each entry lists the percentage of responses that fit in that bucket (slower than max time for previous bucket, faster than min time for next bucket).
Insert response time histogram
256us	1ms	4ms	16ms	64ms	256ms	1s	4s	16s	gt	max	tag
0.000	13.506	86.043	0.305	0.133	0.012	nonzero	nonzero	0.000	0.000	1.268	my5651.cy8
0.000	0.061	99.755	0.160	0.015	0.008	0.001	nonzero	0.000	0.000	1.072	my5739.cy8
0.000	0.000	99.772	0.188	0.032	0.006	0.002	nonzero	0.000	0.000	1.710	my8031.cy8
0.000	0.000	99.982	0.008	0.003	0.005	0.002	0.000	0.000	0.000	0.630	fbmy5635.cay9c
0.000	0.000	99.873	0.111	0.007	0.008	0.002	0.000	0.000	0.000	0.585	fbmy8028.cay9c
l.x
- l.x: create secondary indexes
- Legend for results is here.
- Each entry lists the percentage of responses that fit in that bucket (slower than max time for previous bucket, faster than min time for next bucket).
TODO - determine whether there is data for create index response time
l.i1
- l.i1: continue load after secondary indexes created
- Legend for results is here.
- Each entry lists the percentage of responses that fit in that bucket (slower than max time for previous bucket, faster than min time for next bucket).
Insert response time histogram
256us	1ms	4ms	16ms	64ms	256ms	1s	4s	16s	gt	max	tag
0.000	0.000	25.239	57.047	11.907	4.192	1.544	0.072	0.000	0.000	1.962	my5651.cy8
0.000	0.000	0.815	82.888	10.268	4.386	1.586	0.057	0.000	0.000	1.514	my5739.cy8
0.000	0.000	0.103	78.997	12.318	7.152	1.430	0.000	0.000	0.000	0.926	my8031.cy8
0.000	0.000	99.946	0.041	0.009	0.004	0.000	0.000	0.000	0.000	0.221	fbmy5635.cay9c
0.000	0.000	99.846	0.135	0.013	0.006	0.000	0.000	0.000	0.000	0.177	fbmy8028.cay9c
q100.1
- q100.1: range queries with 100 insert/s per client
- Legend for results is here.
- Each entry lists the percentage of responses that fit in that bucket (slower than max time for previous bucket, faster than min time for next bucket).
Query response time histogram
256us	1ms	4ms	16ms	64ms	256ms	1s	4s	16s	gt	max	tag
31.358	14.786	52.173	1.115	0.543	0.024	0.000	0.000	0.000	0.000	0.159	my5651.cy8
8.615	36.471	53.628	0.530	0.712	0.044	0.000	0.000	0.000	0.000	0.178	my5739.cy8
4.158	39.292	54.366	1.396	0.781	0.007	0.000	0.000	0.000	0.000	0.112	my8031.cy8
1.228	98.756	0.012	0.004	nonzero	nonzero	0.000	0.000	0.000	0.000	0.089	fbmy5635.cay9c
0.521	99.463	0.013	0.003	nonzero	0.000	0.000	0.000	0.000	0.000	0.035	fbmy8028.cay9c
Insert response time histogram
256us	1ms	4ms	16ms	64ms	256ms	1s	4s	16s	gt	max	tag
0.000	0.000	0.014	31.188	55.736	13.062	0.000	0.000	0.000	0.000	0.218	my5651.cy8
0.000	0.000	0.000	81.674	11.979	6.347	0.000	0.000	0.000	0.000	0.244	my5739.cy8
0.000	0.000	0.007	86.854	12.736	0.403	0.000	0.000	0.000	0.000	0.127	my8031.cy8
0.000	0.000	99.951	0.049	0.000	0.000	0.000	0.000	0.000	0.000	0.008	fbmy5635.cay9c
0.000	0.000	88.979	11.021	0.000	0.000	0.000	0.000	0.000	0.000	0.010	fbmy8028.cay9c
q500.1
- q500.1: range queries with 500 insert/s per client
- Legend for results is here.
- Each entry lists the percentage of responses that fit in that bucket (slower than max time for previous bucket, faster than min time for next bucket).
Query response time histogram
256us	1ms	4ms	16ms	64ms	256ms	1s	4s	16s	gt	max	tag
29.983	15.494	52.365	1.343	0.788	0.027	0.000	0.000	0.000	0.000	0.177	my5651.cy8
7.830	36.514	54.051	0.676	0.897	0.032	0.000	0.000	0.000	0.000	0.175	my5739.cy8
3.977	39.066	53.767	1.927	1.252	0.011	0.000	0.000	0.000	0.000	0.118	my8031.cy8
2.599	97.391	0.009	0.002	nonzero	0.000	0.000	0.000	0.000	0.000	0.031	fbmy5635.cay9c
0.743	99.248	0.009	0.001	0.000	0.000	0.000	0.000	0.000	0.000	0.010	fbmy8028.cay9c
Insert response time histogram
256us	1ms	4ms	16ms	64ms	256ms	1s	4s	16s	gt	max	tag
0.000	0.000	16.328	62.913	20.042	0.718	0.000	0.000	0.000	0.000	0.155	my5651.cy8
0.000	0.000	16.218	79.958	3.597	0.226	0.000	0.000	0.000	0.000	0.150	my5739.cy8
0.000	0.000	0.933	94.446	4.571	0.050	0.000	0.000	0.000	0.000	0.150	my8031.cy8
0.000	0.000	99.969	0.029	0.001	0.000	0.000	0.000	0.000	0.000	0.019	fbmy5635.cay9c
0.000	0.000	99.544	0.456	0.000	0.000	0.000	0.000	0.000	0.000	0.013	fbmy8028.cay9c
q1000.1
- q1000.1: range queries with 1000 insert/s per client
- Legend for results is here.
- Each entry lists the percentage of responses that fit in that bucket (slower than max time for previous bucket, faster than min time for next bucket).
Query response time histogram
256us	1ms	4ms	16ms	64ms	256ms	1s	4s	16s	gt	max	tag
27.816	16.492	52.366	1.925	1.354	0.048	0.000	0.000	0.000	0.000	0.161	my5651.cy8
7.519	35.648	54.293	0.938	1.530	0.072	0.000	0.000	0.000	0.000	0.166	my5739.cy8
3.677	37.955	52.655	3.451	2.241	0.022	0.000	0.000	0.000	0.000	0.133	my8031.cy8
3.481	96.496	0.021	0.002	0.000	0.000	0.000	0.000	0.000	0.000	0.011	fbmy5635.cay9c
0.644	99.330	0.023	0.003	0.000	0.000	0.000	0.000	0.000	0.000	0.011	fbmy8028.cay9c
Insert response time histogram
256us	1ms	4ms	16ms	64ms	256ms	1s	4s	16s	gt	max	tag
0.000	0.000	10.072	68.732	20.436	0.760	0.000	0.000	0.000	0.000	0.163	my5651.cy8
0.000	0.000	11.904	81.491	6.312	0.292	0.000	0.000	0.000	0.000	0.194	my5739.cy8
0.000	0.000	0.125	95.172	4.640	0.063	0.000	0.000	0.000	0.000	0.134	my8031.cy8
0.000	0.000	99.916	0.084	0.000	0.000	0.000	0.000	0.000	0.000	0.015	fbmy5635.cay9c
0.000	0.000	99.761	0.236	0.003	0.000	0.000	0.000	0.000	0.000	0.021	fbmy8028.cay9c