Introduction
This is a report for the insert benchmark with 500M docs and 1 client(s). It is generated by scripts (bash, awk, sed) and Tufte might not be impressed. An overview of the insert benchmark is here and a short update is here. Below, by DBMS, I mean DBMS+version.config. An example is my8020.c10b40 where my means MySQL, 8020 is version 8.0.20 and c10b40 is the name for the configuration file.
The test server has 8 AMD cores, 16G RAM and an NVMe SSD. It is described here as the Beelink. The benchmark was run with 1 clients and there were 1 or 2 connections per client (1 for queries, 1 for inserts). The benchmark loads 500M rows without secondary indexes, creates secondary indexes, loads another 10M rows then does 3 read+write tests for one hour each that do queries as fast as possible with 100, 500 and then 1000 writes/second/client concurrent with the queries. The database doesn't fit in memory and parts of the benchmark are IO-bound. Clients and the DBMS share one server. The per-database configs are in the per-database subdirectories here.
The tested DBMS are:
- my5651.cy8 - MySQL 5.6.51, InnoDB and the cy8 config
- my5739.cy8 - MySQL 5.7.39, InnoDB and the cy8 config
- my8031.cy8 - MySQL 8.0.31, InnoDB and the cy8 config
- fbmy5635.cay9c - FB MySQL 5.6.35, MyRocks and the cay9c config
- fbmy8028.cay9c - FB MySQL 8.0.28, MyRocks and the cay9c config
Contents
- Summary
- l.i0: load without secondary indexes
- l.x: create secondary indexes
- l.i1: continue load after secondary indexes created
- q100.1: range queries with 100 insert/s per client
- q500.1: range queries with 500 insert/s per client
- q1000.1: range queries with 1000 insert/s per client
Summary
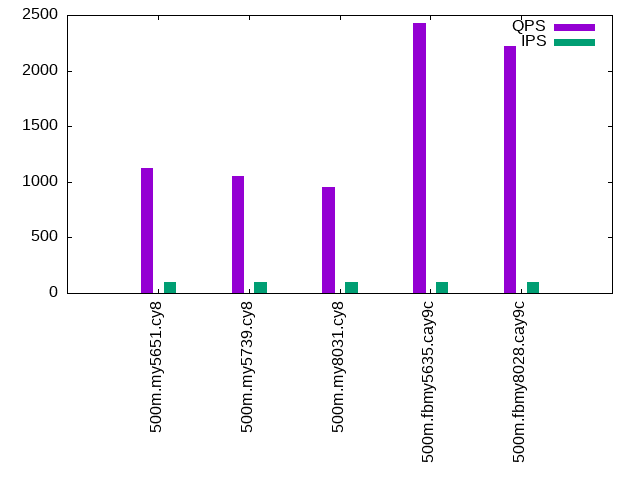
The numbers are inserts/s for l.i0 and l.i1, indexed docs (or rows) /s for l.x and queries/s for q*.2. The values are the average rate over the entire test for inserts (IPS) and queries (QPS). The range of values for IPS and QPS is split into 3 parts: bottom 25%, middle 50%, top 25%. Values in the bottom 25% have a red background, values in the top 25% have a green background and values in the middle have no color. A gray background is used for values that can be ignored because the DBMS did not sustain the target insert rate. Red backgrounds are not used when the minimum value is within 80% of the max value.
| dbms | l.i0 | l.x | l.i1 | q100.1 | q500.1 | q1000.1 |
|---|---|---|---|---|---|---|
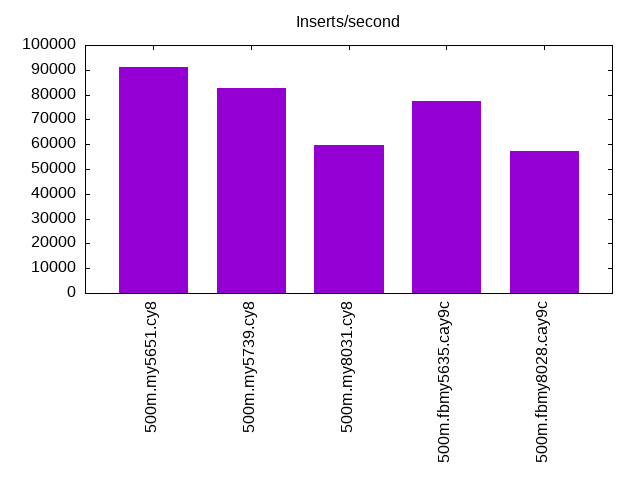
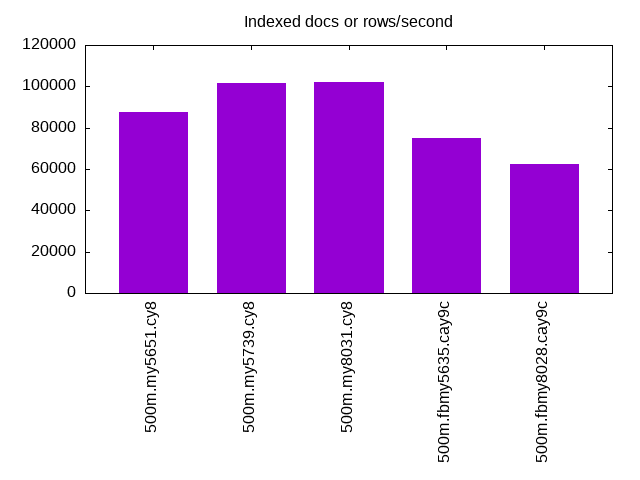
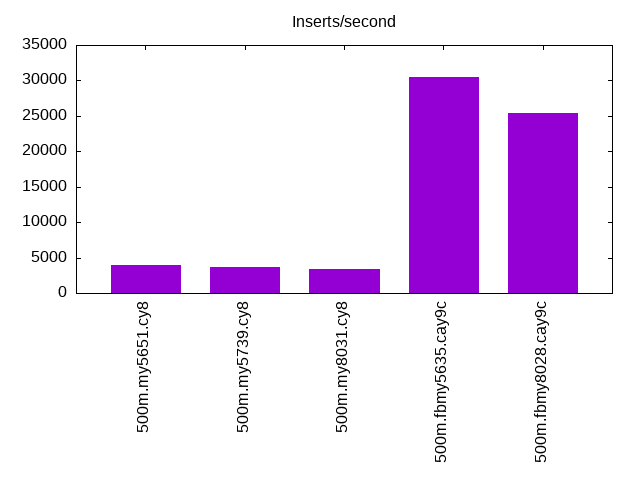
| 500m.my5651.cy8 | 91174 | 87369 | 3989 | 1120 | 1122 | 1140 |
| 500m.my5739.cy8 | 82645 | 101729 | 3731 | 1051 | 1082 | 1024 |
| 500m.my8031.cy8 | 59602 | 101874 | 3442 | 950 | 960 | 863 |
| 500m.fbmy5635.cay9c | 77232 | 75226 | 30488 | 2425 | 2479 | 2439 |
| 500m.fbmy8028.cay9c | 57234 | 62364 | 25445 | 2221 | 2238 | 2279 |
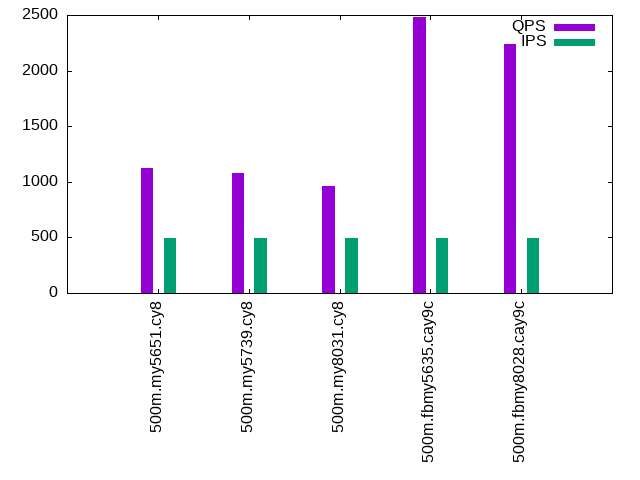
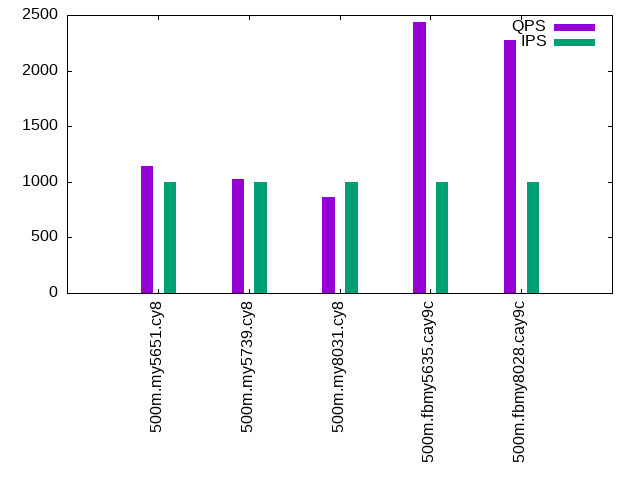
This lists the average rate of inserts/s for the tests that do inserts concurrent with queries. For such tests the query rate is listed in the table above. The read+write tests are setup so that the insert rate should match the target rate every second. Cells that are not at least 95% of the target have a red background to indicate a failure to satisfy the target.
| dbms | q100.1 | q500.1 | q1000.1 |
|---|---|---|---|
| my5651.cy8 | 100 | 499 | 999 |
| my5739.cy8 | 100 | 499 | 999 |
| my8031.cy8 | 100 | 499 | 999 |
| fbmy5635.cay9c | 100 | 499 | 999 |
| fbmy8028.cay9c | 100 | 499 | 999 |
| target | 100 | 500 | 1000 |
l.i0
l.i0: load without secondary indexes. Graphs for performance per 1-second interval are here.
Average throughput:
Insert response time histogram: each cell has the percentage of responses that take <= the time in the header and max is the max response time in seconds. For the max column values in the top 25% of the range have a red background and in the bottom 25% of the range have a green background. The red background is not used when the min value is within 80% of the max value.
| dbms | 256us | 1ms | 4ms | 16ms | 64ms | 256ms | 1s | 4s | 16s | gt | max |
|---|---|---|---|---|---|---|---|---|---|---|---|
| my5651.cy8 | 54.129 | 45.552 | 0.274 | 0.037 | 0.008 | nonzero | 1.118 | ||||
| my5739.cy8 | 0.099 | 99.726 | 0.155 | 0.018 | 0.002 | nonzero | 0.697 | ||||
| my8031.cy8 | 99.805 | 0.185 | 0.010 | nonzero | nonzero | 0.438 | |||||
| fbmy5635.cay9c | 99.995 | 0.001 | 0.004 | nonzero | 0.246 | ||||||
| fbmy8028.cay9c | 99.926 | 0.068 | 0.004 | 0.002 | 0.193 |
Performance metrics for the DBMS listed above. Some are normalized by throughput, others are not. Legend for results is here.
ips	qps	rps	rmbps	wps	wmbps	rpq	rkbpq	wpi	wkbpi	csps	cpups	cspq	cpupq	dbgb1	dbgb2	rss	maxop	p50	p99	tag
91174	0	798	3.1	423.3	30.6	0.009	0.035	0.005	0.343	11611	21.7	0.127	19	32.9	73.4	10.6	1.118	92994	64226	500m.my5651.cy8
82645	0	0	0.0	413.9	28.4	0.000	0.000	0.005	0.352	9527	22.4	0.115	22	32.9	73.4	10.9	0.697	82606	73287	500m.my5739.cy8
59602	0	0	0.0	394.5	22.7	0.000	0.000	0.007	0.390	7529	21.6	0.126	29	32.8	35.2	11.1	0.438	59633	55763	500m.my8031.cy8
77232	0	0	0.0	68.3	13.9	0.000	0.000	0.001	0.184	7999	22.6	0.104	23	15.7	16.1	1.1	0.246	77412	73419	500m.fbmy5635.cay9c
57234	0	0	0.0	67.7	13.1	0.000	0.000	0.001	0.235	6375	23.3	0.111	33	15.7	16.3	1.5	0.193	57235	52941	500m.fbmy8028.cay9c
l.x
l.x: create secondary indexes.
Average throughput:
Performance metrics for the DBMS listed above. Some are normalized by throughput, others are not. Legend for results is here.
ips	qps	rps	rmbps	wps	wmbps	rpq	rkbpq	wpi	wkbpi	csps	cpups	cspq	cpupq	dbgb1	dbgb2	rss	maxop	p50	p99	tag
87369	0	638	78.5	893.9	104.0	0.007	0.920	0.010	1.219	2873	11.6	0.033	11	67.8	108.3	10.3	0.007	NA	NA	500m.my5651.cy8
101729	0	720	87.8	1205.0	112.1	0.007	0.884	0.012	1.129	7053	11.4	0.069	9	73.6	114.1	10.2	0.008	NA	NA	500m.my5739.cy8
101874	0	1663	145.5	2031.7	131.0	0.016	1.463	0.020	1.316	9093	40.4	0.089	32	73.3	75.7	10.4	0.013	NA	NA	500m.my8031.cy8
75226	0	98	15.9	52.8	11.1	0.001	0.216	0.001	0.150	685	12.6	0.009	13	32.3	32.7	9.7	0.002	NA	NA	500m.fbmy5635.cay9c
62364	0	81	13.2	41.9	9.2	0.001	0.217	0.001	0.150	810	12.5	0.013	16	32.2	32.8	10.2	0.004	NA	NA	500m.fbmy8028.cay9c
l.i1
l.i1: continue load after secondary indexes created. Graphs for performance per 1-second interval are here.
Average throughput:
Insert response time histogram: each cell has the percentage of responses that take <= the time in the header and max is the max response time in seconds. For the max column values in the top 25% of the range have a red background and in the bottom 25% of the range have a green background. The red background is not used when the min value is within 80% of the max value.
| dbms | 256us | 1ms | 4ms | 16ms | 64ms | 256ms | 1s | 4s | 16s | gt | max |
|---|---|---|---|---|---|---|---|---|---|---|---|
| my5651.cy8 | 60.414 | 25.904 | 10.748 | 2.404 | 0.526 | 0.005 | 1.136 | ||||
| my5739.cy8 | 21.441 | 65.398 | 10.193 | 2.405 | 0.558 | 0.005 | 1.182 | ||||
| my8031.cy8 | 20.863 | 63.735 | 11.577 | 3.289 | 0.536 | 0.962 | |||||
| fbmy5635.cay9c | 99.987 | 0.009 | 0.002 | 0.002 | 0.103 | ||||||
| fbmy8028.cay9c | 99.926 | 0.065 | 0.006 | 0.003 | 0.127 |
Performance metrics for the DBMS listed above. Some are normalized by throughput, others are not. Legend for results is here.
ips	qps	rps	rmbps	wps	wmbps	rpq	rkbpq	wpi	wkbpi	csps	cpups	cspq	cpupq	dbgb1	dbgb2	rss	maxop	p50	p99	tag
3989	0	2084	31.7	3103.6	106.8	0.522	8.145	0.778	27.419	11110	6.1	2.785	122	101.8	144.2	10.4	1.136	1350	50	500m.my5651.cy8
3731	0	1882	29.4	2864.7	96.8	0.504	8.069	0.768	26.559	11578	8.5	3.103	182	101.8	144.3	10.7	1.182	1548	50	500m.my5739.cy8
3442	0	1757	27.5	3828.9	110.6	0.510	8.166	1.112	32.908	16250	9.9	4.721	230	101.4	105.7	10.7	0.962	1199	100	500m.my8031.cy8
30488	0	18	2.2	211.5	47.7	0.001	0.075	0.007	1.601	7249	29.9	0.238	78	33.5	35.2	9.8	0.103	30433	27419	500m.fbmy5635.cay9c
25445	0	0	0.0	97.0	21.2	0.000	0.000	0.004	0.854	6134	22.7	0.241	71	33.4	35.3	9.8	0.127	25421	21337	500m.fbmy8028.cay9c
q100.1
q100.1: range queries with 100 insert/s per client. Graphs for performance per 1-second interval are here.
Average throughput:
Query response time histogram: each cell has the percentage of responses that take <= the time in the header and max is the max response time in seconds. For max values in the top 25% of the range have a red background and in the bottom 25% of the range have a green background. The red background is not used when the min value is within 80% of the max value.
| dbms | 256us | 1ms | 4ms | 16ms | 64ms | 256ms | 1s | 4s | 16s | gt | max |
|---|---|---|---|---|---|---|---|---|---|---|---|
| my5651.cy8 | 41.776 | 20.080 | 37.263 | 0.640 | 0.236 | 0.005 | 0.108 | ||||
| my5739.cy8 | 11.520 | 44.096 | 43.756 | 0.326 | 0.292 | 0.010 | 0.124 | ||||
| my8031.cy8 | 5.299 | 47.099 | 46.572 | 0.740 | 0.290 | 0.001 | 0.086 | ||||
| fbmy5635.cay9c | 0.879 | 99.080 | 0.028 | 0.013 | nonzero | 0.024 | |||||
| fbmy8028.cay9c | 0.331 | 99.632 | 0.029 | 0.007 | nonzero | 0.022 |
Insert response time histogram: each cell has the percentage of responses that take <= the time in the header and max is the max response time in seconds. For max values in the top 25% of the range have a red background and in the bottom 25% of the range have a green background. The red background is not used when the min value is within 80% of the max value.
| dbms | 256us | 1ms | 4ms | 16ms | 64ms | 256ms | 1s | 4s | 16s | gt | max |
|---|---|---|---|---|---|---|---|---|---|---|---|
| my5651.cy8 | 0.306 | 39.056 | 45.375 | 15.250 | 0.014 | 0.282 | |||||
| my5739.cy8 | 0.181 | 92.833 | 4.528 | 2.458 | 0.204 | ||||||
| my8031.cy8 | 90.986 | 8.792 | 0.222 | 0.107 | |||||||
| fbmy5635.cay9c | 99.944 | 0.056 | 0.013 | ||||||||
| fbmy8028.cay9c | 99.903 | 0.097 | 0.009 |
Performance metrics for the DBMS listed above. Some are normalized by throughput, others are not. Legend for results is here.
ips	qps	rps	rmbps	wps	wmbps	rpq	rkbpq	wpi	wkbpi	csps	cpups	cspq	cpupq	dbgb1	dbgb2	rss	maxop	p50	p99	tag
100	1120	5315	83.0	687.9	20.2	4.745	75.892	6.893	207.045	16025	5.2	14.306	371	101.8	144.3	10.4	0.108	1199	272	500m.my5651.cy8
100	1051	5004	78.2	679.8	19.9	4.760	76.161	6.811	204.562	15340	5.5	14.592	419	101.8	144.3	10.7	0.124	1119	400	500m.my5739.cy8
100	950	4531	70.8	795.3	19.9	4.768	76.295	7.969	204.002	15117	6.3	15.910	530	101.4	105.8	10.7	0.086	1023	304	500m.my8031.cy8
100	2425	58	0.5	7.6	0.6	0.024	0.196	0.076	5.716	9830	12.8	4.054	422	33.5	35.2	9.8	0.024	2429	2062	500m.fbmy5635.cay9c
100	2221	58	0.5	4.3	0.3	0.026	0.213	0.043	2.891	9162	13.3	4.125	479	33.5	35.4	9.8	0.022	2189	1710	500m.fbmy8028.cay9c
q500.1
q500.1: range queries with 500 insert/s per client. Graphs for performance per 1-second interval are here.
Average throughput:
Query response time histogram: each cell has the percentage of responses that take <= the time in the header and max is the max response time in seconds. For max values in the top 25% of the range have a red background and in the bottom 25% of the range have a green background. The red background is not used when the min value is within 80% of the max value.
| dbms | 256us | 1ms | 4ms | 16ms | 64ms | 256ms | 1s | 4s | 16s | gt | max |
|---|---|---|---|---|---|---|---|---|---|---|---|
| my5651.cy8 | 41.029 | 19.492 | 38.646 | 0.635 | 0.196 | 0.002 | 0.111 | ||||
| my5739.cy8 | 12.030 | 42.970 | 44.458 | 0.300 | 0.236 | 0.005 | 0.116 | ||||
| my8031.cy8 | 5.360 | 47.169 | 46.528 | 0.627 | 0.317 | nonzero | 0.092 | ||||
| fbmy5635.cay9c | 1.540 | 98.458 | 0.001 | 0.001 | nonzero | 0.021 | |||||
| fbmy8028.cay9c | 0.126 | 99.873 | 0.001 | nonzero | 0.011 |
Insert response time histogram: each cell has the percentage of responses that take <= the time in the header and max is the max response time in seconds. For max values in the top 25% of the range have a red background and in the bottom 25% of the range have a green background. The red background is not used when the min value is within 80% of the max value.
| dbms | 256us | 1ms | 4ms | 16ms | 64ms | 256ms | 1s | 4s | 16s | gt | max |
|---|---|---|---|---|---|---|---|---|---|---|---|
| my5651.cy8 | 21.764 | 61.528 | 16.592 | 0.117 | 0.111 | ||||||
| my5739.cy8 | 7.142 | 91.731 | 1.119 | 0.008 | 0.070 | ||||||
| my8031.cy8 | 1.797 | 96.814 | 1.378 | 0.011 | 0.098 | ||||||
| fbmy5635.cay9c | 99.961 | 0.019 | 0.019 | 0.022 | |||||||
| fbmy8028.cay9c | 99.928 | 0.072 | 0.010 |
Performance metrics for the DBMS listed above. Some are normalized by throughput, others are not. Legend for results is here.
ips	qps	rps	rmbps	wps	wmbps	rpq	rkbpq	wpi	wkbpi	csps	cpups	cspq	cpupq	dbgb1	dbgb2	rss	maxop	p50	p99	tag
499	1122	5277	82.3	516.1	15.3	4.705	75.176	1.033	31.428	15711	5.3	14.009	378	101.9	144.4	10.4	0.111	1135	959	500m.my5651.cy8
499	1082	5082	79.4	508.6	15.0	4.698	75.164	1.018	30.790	15326	6.2	14.168	459	101.9	144.4	10.7	0.116	1087	927	500m.my5739.cy8
499	960	4508	70.4	704.7	17.8	4.694	75.102	1.411	36.496	14908	6.9	15.523	575	101.6	105.9	10.7	0.092	975	799	500m.my8031.cy8
499	2479	0	0.0	9.5	1.1	0.000	0.000	0.019	2.165	9999	13.6	4.033	439	33.7	35.7	9.8	0.021	2461	2365	500m.fbmy5635.cay9c
499	2238	0	0.0	5.6	0.6	0.000	0.000	0.011	1.264	9216	14.0	4.117	500	33.7	35.8	9.8	0.011	2206	1982	500m.fbmy8028.cay9c
q1000.1
q1000.1: range queries with 1000 insert/s per client. Graphs for performance per 1-second interval are here.
Average throughput:
Query response time histogram: each cell has the percentage of responses that take <= the time in the header and max is the max response time in seconds. For max values in the top 25% of the range have a red background and in the bottom 25% of the range have a green background. The red background is not used when the min value is within 80% of the max value.
| dbms | 256us | 1ms | 4ms | 16ms | 64ms | 256ms | 1s | 4s | 16s | gt | max |
|---|---|---|---|---|---|---|---|---|---|---|---|
| my5651.cy8 | 40.069 | 21.062 | 37.974 | 0.721 | 0.174 | 0.001 | 0.111 | ||||
| my5739.cy8 | 9.950 | 44.936 | 44.380 | 0.359 | 0.364 | 0.011 | 0.125 | ||||
| my8031.cy8 | 5.039 | 47.189 | 46.208 | 0.946 | 0.616 | 0.001 | 0.085 | ||||
| fbmy5635.cay9c | 1.596 | 98.402 | 0.001 | 0.001 | 0.015 | ||||||
| fbmy8028.cay9c | 0.073 | 99.925 | 0.001 | nonzero | 0.007 |
Insert response time histogram: each cell has the percentage of responses that take <= the time in the header and max is the max response time in seconds. For max values in the top 25% of the range have a red background and in the bottom 25% of the range have a green background. The red background is not used when the min value is within 80% of the max value.
| dbms | 256us | 1ms | 4ms | 16ms | 64ms | 256ms | 1s | 4s | 16s | gt | max |
|---|---|---|---|---|---|---|---|---|---|---|---|
| my5651.cy8 | 37.614 | 58.769 | 3.592 | 0.025 | 0.133 | ||||||
| my5739.cy8 | 7.153 | 91.726 | 1.114 | 0.007 | 0.087 | ||||||
| my8031.cy8 | 3.056 | 94.664 | 2.269 | 0.011 | 0.093 | ||||||
| fbmy5635.cay9c | 99.900 | 0.092 | 0.008 | 0.017 | |||||||
| fbmy8028.cay9c | 99.911 | 0.089 | 0.016 |
Performance metrics for the DBMS listed above. Some are normalized by throughput, others are not. Legend for results is here.
ips	qps	rps	rmbps	wps	wmbps	rpq	rkbpq	wpi	wkbpi	csps	cpups	cspq	cpupq	dbgb1	dbgb2	rss	maxop	p50	p99	tag
999	1140	5414	84.4	784.5	23.4	4.750	75.812	0.785	24.020	16750	6.4	14.698	449	102.2	144.6	10.4	0.111	1151	927	500m.my5651.cy8
999	1024	4856	75.9	749.8	22.4	4.741	75.861	0.751	22.917	15303	6.9	14.943	539	102.2	144.6	10.7	0.125	1055	831	500m.my5739.cy8
999	863	4098	64.0	1152.3	29.3	4.749	75.978	1.154	30.035	15059	7.5	17.451	695	101.8	106.1	10.7	0.085	895	655	500m.my8031.cy8
999	2439	0	0.0	15.0	2.3	0.000	0.000	0.015	2.403	9961	14.7	4.084	482	34.1	34.5	10.1	0.015	2429	2272	500m.fbmy5635.cay9c
999	2279	0	0.0	7.9	1.2	0.000	0.000	0.008	1.214	9475	14.6	4.157	512	34.1	34.7	9.9	0.007	2253	1982	500m.fbmy8028.cay9c
l.i0
l.i0: load without secondary indexes
Performance metrics for all DBMS, not just the ones listed above. Some are normalized by throughput, others are not. Legend for results is here.
ips	qps	rps	rmbps	wps	wmbps	rpq	rkbpq	wpi	wkbpi	csps	cpups	cspq	cpupq	dbgb1	dbgb2	rss	maxop	p50	p99	tag
91174	0	798	3.1	423.3	30.6	0.009	0.035	0.005	0.343	11611	21.7	0.127	19	32.9	73.4	10.6	1.118	92994	64226	500m.my5651.cy8
82645	0	0	0.0	413.9	28.4	0.000	0.000	0.005	0.352	9527	22.4	0.115	22	32.9	73.4	10.9	0.697	82606	73287	500m.my5739.cy8
59602	0	0	0.0	394.5	22.7	0.000	0.000	0.007	0.390	7529	21.6	0.126	29	32.8	35.2	11.1	0.438	59633	55763	500m.my8031.cy8
77232	0	0	0.0	68.3	13.9	0.000	0.000	0.001	0.184	7999	22.6	0.104	23	15.7	16.1	1.1	0.246	77412	73419	500m.fbmy5635.cay9c
57234	0	0	0.0	67.7	13.1	0.000	0.000	0.001	0.235	6375	23.3	0.111	33	15.7	16.3	1.5	0.193	57235	52941	500m.fbmy8028.cay9c
l.x
l.x: create secondary indexes
Performance metrics for all DBMS, not just the ones listed above. Some are normalized by throughput, others are not. Legend for results is here.
ips	qps	rps	rmbps	wps	wmbps	rpq	rkbpq	wpi	wkbpi	csps	cpups	cspq	cpupq	dbgb1	dbgb2	rss	maxop	p50	p99	tag
87369	0	638	78.5	893.9	104.0	0.007	0.920	0.010	1.219	2873	11.6	0.033	11	67.8	108.3	10.3	0.007	NA	NA	500m.my5651.cy8
101729	0	720	87.8	1205.0	112.1	0.007	0.884	0.012	1.129	7053	11.4	0.069	9	73.6	114.1	10.2	0.008	NA	NA	500m.my5739.cy8
101874	0	1663	145.5	2031.7	131.0	0.016	1.463	0.020	1.316	9093	40.4	0.089	32	73.3	75.7	10.4	0.013	NA	NA	500m.my8031.cy8
75226	0	98	15.9	52.8	11.1	0.001	0.216	0.001	0.150	685	12.6	0.009	13	32.3	32.7	9.7	0.002	NA	NA	500m.fbmy5635.cay9c
62364	0	81	13.2	41.9	9.2	0.001	0.217	0.001	0.150	810	12.5	0.013	16	32.2	32.8	10.2	0.004	NA	NA	500m.fbmy8028.cay9c
l.i1
l.i1: continue load after secondary indexes created
Performance metrics for all DBMS, not just the ones listed above. Some are normalized by throughput, others are not. Legend for results is here.
ips	qps	rps	rmbps	wps	wmbps	rpq	rkbpq	wpi	wkbpi	csps	cpups	cspq	cpupq	dbgb1	dbgb2	rss	maxop	p50	p99	tag
3989	0	2084	31.7	3103.6	106.8	0.522	8.145	0.778	27.419	11110	6.1	2.785	122	101.8	144.2	10.4	1.136	1350	50	500m.my5651.cy8
3731	0	1882	29.4	2864.7	96.8	0.504	8.069	0.768	26.559	11578	8.5	3.103	182	101.8	144.3	10.7	1.182	1548	50	500m.my5739.cy8
3442	0	1757	27.5	3828.9	110.6	0.510	8.166	1.112	32.908	16250	9.9	4.721	230	101.4	105.7	10.7	0.962	1199	100	500m.my8031.cy8
30488	0	18	2.2	211.5	47.7	0.001	0.075	0.007	1.601	7249	29.9	0.238	78	33.5	35.2	9.8	0.103	30433	27419	500m.fbmy5635.cay9c
25445	0	0	0.0	97.0	21.2	0.000	0.000	0.004	0.854	6134	22.7	0.241	71	33.4	35.3	9.8	0.127	25421	21337	500m.fbmy8028.cay9c
q100.1
q100.1: range queries with 100 insert/s per client
Performance metrics for all DBMS, not just the ones listed above. Some are normalized by throughput, others are not. Legend for results is here.
ips	qps	rps	rmbps	wps	wmbps	rpq	rkbpq	wpi	wkbpi	csps	cpups	cspq	cpupq	dbgb1	dbgb2	rss	maxop	p50	p99	tag
100	1120	5315	83.0	687.9	20.2	4.745	75.892	6.893	207.045	16025	5.2	14.306	371	101.8	144.3	10.4	0.108	1199	272	500m.my5651.cy8
100	1051	5004	78.2	679.8	19.9	4.760	76.161	6.811	204.562	15340	5.5	14.592	419	101.8	144.3	10.7	0.124	1119	400	500m.my5739.cy8
100	950	4531	70.8	795.3	19.9	4.768	76.295	7.969	204.002	15117	6.3	15.910	530	101.4	105.8	10.7	0.086	1023	304	500m.my8031.cy8
100	2425	58	0.5	7.6	0.6	0.024	0.196	0.076	5.716	9830	12.8	4.054	422	33.5	35.2	9.8	0.024	2429	2062	500m.fbmy5635.cay9c
100	2221	58	0.5	4.3	0.3	0.026	0.213	0.043	2.891	9162	13.3	4.125	479	33.5	35.4	9.8	0.022	2189	1710	500m.fbmy8028.cay9c
q500.1
q500.1: range queries with 500 insert/s per client
Performance metrics for all DBMS, not just the ones listed above. Some are normalized by throughput, others are not. Legend for results is here.
ips	qps	rps	rmbps	wps	wmbps	rpq	rkbpq	wpi	wkbpi	csps	cpups	cspq	cpupq	dbgb1	dbgb2	rss	maxop	p50	p99	tag
499	1122	5277	82.3	516.1	15.3	4.705	75.176	1.033	31.428	15711	5.3	14.009	378	101.9	144.4	10.4	0.111	1135	959	500m.my5651.cy8
499	1082	5082	79.4	508.6	15.0	4.698	75.164	1.018	30.790	15326	6.2	14.168	459	101.9	144.4	10.7	0.116	1087	927	500m.my5739.cy8
499	960	4508	70.4	704.7	17.8	4.694	75.102	1.411	36.496	14908	6.9	15.523	575	101.6	105.9	10.7	0.092	975	799	500m.my8031.cy8
499	2479	0	0.0	9.5	1.1	0.000	0.000	0.019	2.165	9999	13.6	4.033	439	33.7	35.7	9.8	0.021	2461	2365	500m.fbmy5635.cay9c
499	2238	0	0.0	5.6	0.6	0.000	0.000	0.011	1.264	9216	14.0	4.117	500	33.7	35.8	9.8	0.011	2206	1982	500m.fbmy8028.cay9c
q1000.1
q1000.1: range queries with 1000 insert/s per client
Performance metrics for all DBMS, not just the ones listed above. Some are normalized by throughput, others are not. Legend for results is here.
ips	qps	rps	rmbps	wps	wmbps	rpq	rkbpq	wpi	wkbpi	csps	cpups	cspq	cpupq	dbgb1	dbgb2	rss	maxop	p50	p99	tag
999	1140	5414	84.4	784.5	23.4	4.750	75.812	0.785	24.020	16750	6.4	14.698	449	102.2	144.6	10.4	0.111	1151	927	500m.my5651.cy8
999	1024	4856	75.9	749.8	22.4	4.741	75.861	0.751	22.917	15303	6.9	14.943	539	102.2	144.6	10.7	0.125	1055	831	500m.my5739.cy8
999	863	4098	64.0	1152.3	29.3	4.749	75.978	1.154	30.035	15059	7.5	17.451	695	101.8	106.1	10.7	0.085	895	655	500m.my8031.cy8
999	2439	0	0.0	15.0	2.3	0.000	0.000	0.015	2.403	9961	14.7	4.084	482	34.1	34.5	10.1	0.015	2429	2272	500m.fbmy5635.cay9c
999	2279	0	0.0	7.9	1.2	0.000	0.000	0.008	1.214	9475	14.6	4.157	512	34.1	34.7	9.9	0.007	2253	1982	500m.fbmy8028.cay9c
l.i0
- l.i0: load without secondary indexes
- Legend for results is here.
- Each entry lists the percentage of responses that fit in that bucket (slower than max time for previous bucket, faster than min time for next bucket).
Insert response time histogram
256us	1ms	4ms	16ms	64ms	256ms	1s	4s	16s	gt	max	tag
0.000	54.129	45.552	0.274	0.037	0.008	0.000	nonzero	0.000	0.000	1.118	my5651.cy8
0.000	0.099	99.726	0.155	0.018	0.002	nonzero	0.000	0.000	0.000	0.697	my5739.cy8
0.000	0.000	99.805	0.185	0.010	nonzero	nonzero	0.000	0.000	0.000	0.438	my8031.cy8
0.000	0.000	99.995	0.001	0.004	nonzero	0.000	0.000	0.000	0.000	0.246	fbmy5635.cay9c
0.000	0.000	99.926	0.068	0.004	0.002	0.000	0.000	0.000	0.000	0.193	fbmy8028.cay9c
l.x
- l.x: create secondary indexes
- Legend for results is here.
- Each entry lists the percentage of responses that fit in that bucket (slower than max time for previous bucket, faster than min time for next bucket).
TODO - determine whether there is data for create index response time
l.i1
- l.i1: continue load after secondary indexes created
- Legend for results is here.
- Each entry lists the percentage of responses that fit in that bucket (slower than max time for previous bucket, faster than min time for next bucket).
Insert response time histogram
256us	1ms	4ms	16ms	64ms	256ms	1s	4s	16s	gt	max	tag
0.000	0.000	60.414	25.904	10.748	2.404	0.526	0.005	0.000	0.000	1.136	my5651.cy8
0.000	0.000	21.441	65.398	10.193	2.405	0.558	0.005	0.000	0.000	1.182	my5739.cy8
0.000	0.000	20.863	63.735	11.577	3.289	0.536	0.000	0.000	0.000	0.962	my8031.cy8
0.000	0.000	99.987	0.009	0.002	0.002	0.000	0.000	0.000	0.000	0.103	fbmy5635.cay9c
0.000	0.000	99.926	0.065	0.006	0.003	0.000	0.000	0.000	0.000	0.127	fbmy8028.cay9c
q100.1
- q100.1: range queries with 100 insert/s per client
- Legend for results is here.
- Each entry lists the percentage of responses that fit in that bucket (slower than max time for previous bucket, faster than min time for next bucket).
Query response time histogram
256us	1ms	4ms	16ms	64ms	256ms	1s	4s	16s	gt	max	tag
41.776	20.080	37.263	0.640	0.236	0.005	0.000	0.000	0.000	0.000	0.108	my5651.cy8
11.520	44.096	43.756	0.326	0.292	0.010	0.000	0.000	0.000	0.000	0.124	my5739.cy8
5.299	47.099	46.572	0.740	0.290	0.001	0.000	0.000	0.000	0.000	0.086	my8031.cy8
0.879	99.080	0.028	0.013	nonzero	0.000	0.000	0.000	0.000	0.000	0.024	fbmy5635.cay9c
0.331	99.632	0.029	0.007	nonzero	0.000	0.000	0.000	0.000	0.000	0.022	fbmy8028.cay9c
Insert response time histogram
256us	1ms	4ms	16ms	64ms	256ms	1s	4s	16s	gt	max	tag
0.000	0.000	0.306	39.056	45.375	15.250	0.014	0.000	0.000	0.000	0.282	my5651.cy8
0.000	0.000	0.181	92.833	4.528	2.458	0.000	0.000	0.000	0.000	0.204	my5739.cy8
0.000	0.000	0.000	90.986	8.792	0.222	0.000	0.000	0.000	0.000	0.107	my8031.cy8
0.000	0.000	99.944	0.056	0.000	0.000	0.000	0.000	0.000	0.000	0.013	fbmy5635.cay9c
0.000	0.000	99.903	0.097	0.000	0.000	0.000	0.000	0.000	0.000	0.009	fbmy8028.cay9c
q500.1
- q500.1: range queries with 500 insert/s per client
- Legend for results is here.
- Each entry lists the percentage of responses that fit in that bucket (slower than max time for previous bucket, faster than min time for next bucket).
Query response time histogram
256us	1ms	4ms	16ms	64ms	256ms	1s	4s	16s	gt	max	tag
41.029	19.492	38.646	0.635	0.196	0.002	0.000	0.000	0.000	0.000	0.111	my5651.cy8
12.030	42.970	44.458	0.300	0.236	0.005	0.000	0.000	0.000	0.000	0.116	my5739.cy8
5.360	47.169	46.528	0.627	0.317	nonzero	0.000	0.000	0.000	0.000	0.092	my8031.cy8
1.540	98.458	0.001	0.001	nonzero	0.000	0.000	0.000	0.000	0.000	0.021	fbmy5635.cay9c
0.126	99.873	0.001	nonzero	0.000	0.000	0.000	0.000	0.000	0.000	0.011	fbmy8028.cay9c
Insert response time histogram
256us	1ms	4ms	16ms	64ms	256ms	1s	4s	16s	gt	max	tag
0.000	0.000	21.764	61.528	16.592	0.117	0.000	0.000	0.000	0.000	0.111	my5651.cy8
0.000	0.000	7.142	91.731	1.119	0.008	0.000	0.000	0.000	0.000	0.070	my5739.cy8
0.000	0.000	1.797	96.814	1.378	0.011	0.000	0.000	0.000	0.000	0.098	my8031.cy8
0.000	0.000	99.961	0.019	0.019	0.000	0.000	0.000	0.000	0.000	0.022	fbmy5635.cay9c
0.000	0.000	99.928	0.072	0.000	0.000	0.000	0.000	0.000	0.000	0.010	fbmy8028.cay9c
q1000.1
- q1000.1: range queries with 1000 insert/s per client
- Legend for results is here.
- Each entry lists the percentage of responses that fit in that bucket (slower than max time for previous bucket, faster than min time for next bucket).
Query response time histogram
256us	1ms	4ms	16ms	64ms	256ms	1s	4s	16s	gt	max	tag
40.069	21.062	37.974	0.721	0.174	0.001	0.000	0.000	0.000	0.000	0.111	my5651.cy8
9.950	44.936	44.380	0.359	0.364	0.011	0.000	0.000	0.000	0.000	0.125	my5739.cy8
5.039	47.189	46.208	0.946	0.616	0.001	0.000	0.000	0.000	0.000	0.085	my8031.cy8
1.596	98.402	0.001	0.001	0.000	0.000	0.000	0.000	0.000	0.000	0.015	fbmy5635.cay9c
0.073	99.925	0.001	nonzero	0.000	0.000	0.000	0.000	0.000	0.000	0.007	fbmy8028.cay9c
Insert response time histogram
256us	1ms	4ms	16ms	64ms	256ms	1s	4s	16s	gt	max	tag
0.000	0.000	37.614	58.769	3.592	0.025	0.000	0.000	0.000	0.000	0.133	my5651.cy8
0.000	0.000	7.153	91.726	1.114	0.007	0.000	0.000	0.000	0.000	0.087	my5739.cy8
0.000	0.000	3.056	94.664	2.269	0.011	0.000	0.000	0.000	0.000	0.093	my8031.cy8
0.000	0.000	99.900	0.092	0.008	0.000	0.000	0.000	0.000	0.000	0.017	fbmy5635.cay9c
0.000	0.000	99.911	0.089	0.000	0.000	0.000	0.000	0.000	0.000	0.016	fbmy8028.cay9c