Introduction
This is a report for the insert benchmark with 150M docs and 22 client(s). It is generated by scripts (bash, awk, sed) and Tufte might not be impressed. An overview of the insert benchmark is here and a short update is here. Below, by DBMS, I mean DBMS+version.config. An example is my8020.c10b40 where my means MySQL, 8020 is version 8.0.20 and c10b40 is the name for the configuration file.
The test server is an c7g.16xl with 64 cores, 128G RAM and io2 storage (5T, 100K IOPs). The benchmark was run with 22 clients and there was 1 or 2 connections per client (1 for queries, 1 for inserts). The benchmark loads 100M rows without secondary indexes, creates secondary indexes, loads another 50M rows then does 3 read+write tests for one hour each that do queries as fast as possible with 100, 500 and then 1000 writes/second/client concurrent with the queries. The database is cached by the storage engine and the only IO is for writes. Clients and the DBMS share one server. The per-database configs are in the per-database subdirectories here.
The tested DBMS are:
- my8031.cy8 - MySQL 8.0.31 with InnoDB and the cy8_128gram_64kiops config
- fbmy8028.clang.cy9c - FB MySQL 8.0.28 with MyRocks and the cy9c_128gram_64kiops config, compiled with clang
- fbmy8028.gcc.cy9c - FB MySQL 8.0.28 with MyRocks and the cy9c_128gram_64kiops config, compiled with gcc
- pg151.cx7 - Postgres 15.1 and the cx7_128gram_64kiops config
Contents
- Summary
- l.i0: load without secondary indexes
- l.x: create secondary indexes
- l.i1: continue load after secondary indexes created
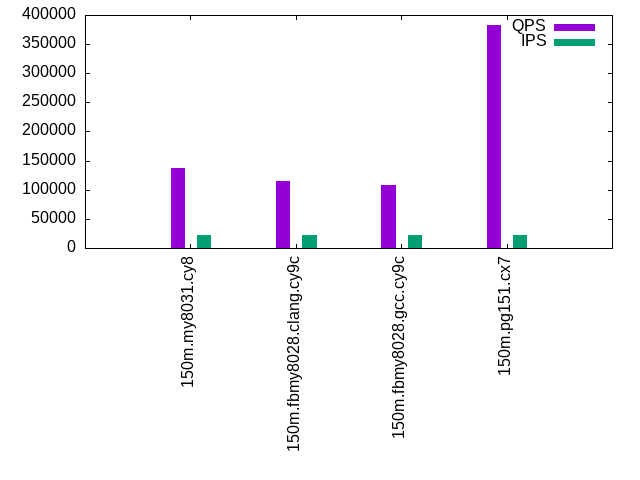
- q100.1: range queries with 100 insert/s per client
- q500.1: range queries with 500 insert/s per client
- q1000.1: range queries with 1000 insert/s per client
Summary
The numbers are inserts/s for l.i0 and l.i1, indexed docs (or rows) /s for l.x and queries/s for q*.2. The values are the average rate over the entire test for inserts (IPS) and queries (QPS). The range of values for IPS and QPS is split into 3 parts: bottom 25%, middle 50%, top 25%. Values in the bottom 25% have a red background, values in the top 25% have a green background and values in the middle have no color. A gray background is used for values that can be ignored because the DBMS did not sustain the target insert rate. Red backgrounds are not used when the minimum value is within 80% of the max value.
| dbms | l.i0 | l.x | l.i1 | q100.1 | q500.1 | q1000.1 |
|---|---|---|---|---|---|---|
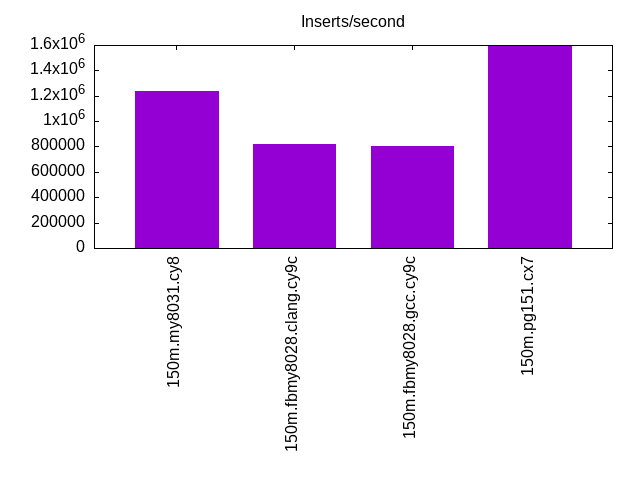
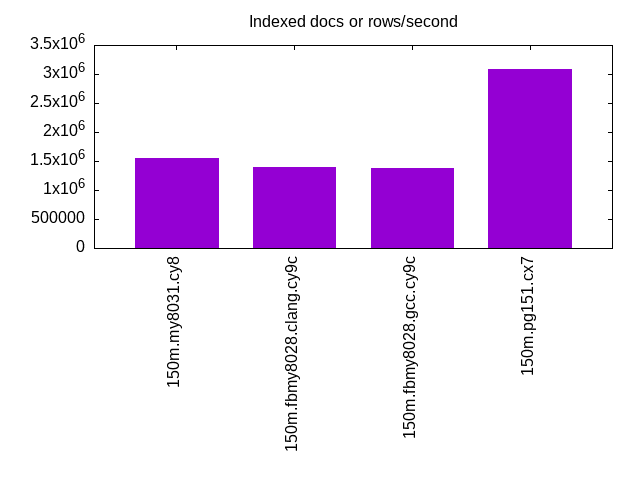
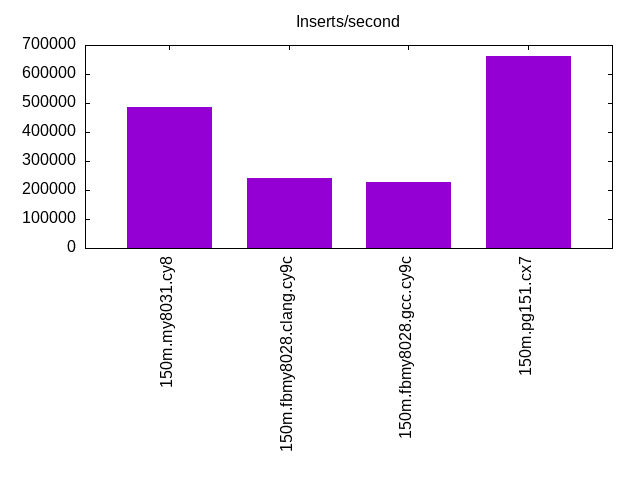
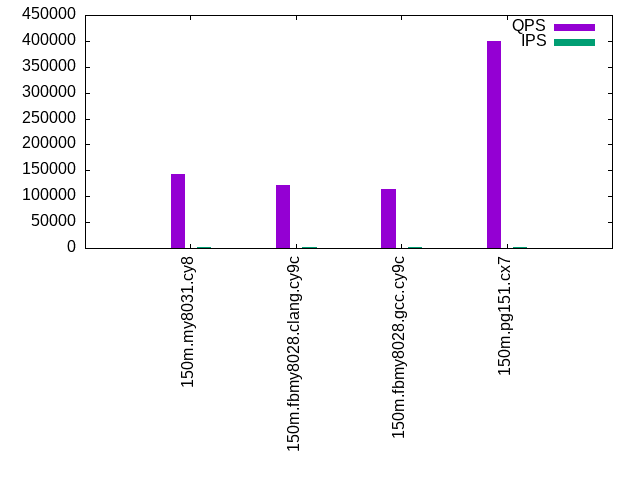
| 150m.my8031.cy8 | 1233619 | 1543494 | 485452 | 143181 | 141291 | 137408 |
| 150m.fbmy8028.clang.cy9c | 819200 | 1399435 | 241607 | 122453 | 119638 | 115103 |
| 150m.fbmy8028.gcc.cy9c | 806597 | 1381021 | 225986 | 113961 | 112014 | 107790 |
| 150m.pg151.cx7 | 1588752 | 3086988 | 663656 | 400317 | 386464 | 382136 |
This lists the average rate of inserts/s for the tests that do inserts concurrent with queries. For such tests the query rate is listed in the table above. The read+write tests are setup so that the insert rate should match the target rate every second. Cells that are not at least 95% of the target have a red background to indicate a failure to satisfy the target.
| dbms | q100.1 | q500.1 | q1000.1 |
|---|---|---|---|
| my8031.cy8 | 2185 | 10924 | 21848 |
| fbmy8028.clang.cy9c | 2185 | 10924 | 21854 |
| fbmy8028.gcc.cy9c | 2185 | 10924 | 21848 |
| pg151.cx7 | 2185 | 10924 | 21854 |
| target | 2200 | 11000 | 22000 |
l.i0
l.i0: load without secondary indexes. Graphs for performance per 1-second interval are here.
Average throughput:
Insert response time histogram: each cell has the percentage of responses that take <= the time in the header and max is the max response time in seconds. For the max column values in the top 25% of the range have a red background and in the bottom 25% of the range have a green background. The red background is not used when the min value is within 80% of the max value.
| dbms | 256us | 1ms | 4ms | 16ms | 64ms | 256ms | 1s | 4s | 16s | gt | max |
|---|---|---|---|---|---|---|---|---|---|---|---|
| my8031.cy8 | 15.465 | 84.300 | 0.161 | 0.021 | 0.054 | 0.143 | |||||
| fbmy8028.clang.cy9c | 6.105 | 93.726 | 0.098 | 0.070 | 0.001 | 0.070 | |||||
| fbmy8028.gcc.cy9c | 5.063 | 94.771 | 0.095 | 0.068 | 0.002 | 0.073 | |||||
| pg151.cx7 | 99.766 | 0.231 | 0.003 | 0.006 |
Performance metrics for the DBMS listed above. Some are normalized by throughput, others are not. Legend for results is here.
ips	qps	rps	rmbps	wps	wmbps	rpq	rkbpq	wpi	wkbpi	csps	cpups	cspq	cpupq	dbgb1	dbgb2	rss	maxop	p50	p99	tag
1233619	0	0	0.0	1843.7	316.6	0.000	0.000	0.001	0.263	209592	31.9	0.170	17	7.0	135.6	14.6	0.143	89303	17681	150m.my8031.cy8
819200	0	0	0.0	1277.8	290.7	0.000	0.000	0.002	0.363	242858	32.0	0.296	25	6.2	6.7	1.8	0.070	50546	14984	150m.fbmy8028.clang.cy9c
806597	0	0	0.0	1247.4	285.0	0.000	0.000	0.002	0.362	213442	31.8	0.265	25	4.0	4.5	1.8	0.073	45351	34863	150m.fbmy8028.gcc.cy9c
1588752	0	0	0.0	2915.3	680.7	0.000	0.000	0.002	0.439	198608	31.3	0.125	13	10.0	27.1	9.8	0.006	140450	14984	150m.pg151.cx7
l.x
l.x: create secondary indexes.
Average throughput:
Performance metrics for the DBMS listed above. Some are normalized by throughput, others are not. Legend for results is here.
ips	qps	rps	rmbps	wps	wmbps	rpq	rkbpq	wpi	wkbpi	csps	cpups	cspq	cpupq	dbgb1	dbgb2	rss	maxop	p50	p99	tag
1543494	0	8857	569.2	30425.4	1454.0	0.006	0.378	0.020	0.965	151184	22.8	0.098	9	15.6	144.1	18.1	0.002	NA	NA	150m.my8031.cy8
1399435	0	4	0.2	1168.4	264.4	0.000	0.000	0.001	0.193	9297	26.2	0.007	12	7.2	7.8	11.2	0.002	NA	NA	150m.fbmy8028.clang.cy9c
1381021	0	4	0.2	1155.0	260.5	0.000	0.000	0.001	0.193	9066	26.1	0.007	12	7.3	7.8	10.7	0.008	NA	NA	150m.fbmy8028.gcc.cy9c
3086988	0	0	0.0	3257.7	789.7	0.000	0.000	0.001	0.262	51015	14.1	0.017	3	19.3	44.8	0.0	0.023	NA	NA	150m.pg151.cx7
l.i1
l.i1: continue load after secondary indexes created. Graphs for performance per 1-second interval are here.
Average throughput:
Insert response time histogram: each cell has the percentage of responses that take <= the time in the header and max is the max response time in seconds. For the max column values in the top 25% of the range have a red background and in the bottom 25% of the range have a green background. The red background is not used when the min value is within 80% of the max value.
| dbms | 256us | 1ms | 4ms | 16ms | 64ms | 256ms | 1s | 4s | 16s | gt | max |
|---|---|---|---|---|---|---|---|---|---|---|---|
| my8031.cy8 | 99.299 | 0.349 | 0.205 | 0.147 | 0.217 | ||||||
| fbmy8028.clang.cy9c | 0.667 | 40.489 | 58.765 | 0.077 | 0.003 | 0.087 | |||||
| fbmy8028.gcc.cy9c | 0.481 | 32.434 | 67.043 | 0.038 | 0.004 | 0.083 | |||||
| pg151.cx7 | 7.629 | 92.357 | 0.013 | 0.012 |
Performance metrics for the DBMS listed above. Some are normalized by throughput, others are not. Legend for results is here.
ips	qps	rps	rmbps	wps	wmbps	rpq	rkbpq	wpi	wkbpi	csps	cpups	cspq	cpupq	dbgb1	dbgb2	rss	maxop	p50	p99	tag
485452	0	4540	70.9	3423.1	389.4	0.009	0.150	0.007	0.821	188999	30.3	0.389	40	27.7	156.3	32.8	0.217	30318	350	150m.my8031.cy8
241607	0	147	18.2	1312.5	305.3	0.001	0.077	0.005	1.294	108278	18.4	0.448	49	14.6	15.8	12.9	0.087	11288	7692	150m.fbmy8028.clang.cy9c
225986	0	138	17.0	1307.3	303.7	0.001	0.077	0.006	1.376	101564	18.7	0.449	53	13.0	14.2	12.5	0.083	10639	9290	150m.fbmy8028.gcc.cy9c
663656	0	0	0.0	3306.0	776.0	0.000	0.000	0.005	1.197	226966	31.1	0.342	30	33.6	82.3	15.7	0.012	40257	17731	150m.pg151.cx7
q100.1
q100.1: range queries with 100 insert/s per client. Graphs for performance per 1-second interval are here.
Average throughput:
Query response time histogram: each cell has the percentage of responses that take <= the time in the header and max is the max response time in seconds. For max values in the top 25% of the range have a red background and in the bottom 25% of the range have a green background. The red background is not used when the min value is within 80% of the max value.
| dbms | 256us | 1ms | 4ms | 16ms | 64ms | 256ms | 1s | 4s | 16s | gt | max |
|---|---|---|---|---|---|---|---|---|---|---|---|
| my8031.cy8 | 99.996 | 0.003 | nonzero | nonzero | 0.004 | ||||||
| fbmy8028.clang.cy9c | 99.972 | 0.028 | nonzero | nonzero | nonzero | 0.023 | |||||
| fbmy8028.gcc.cy9c | 99.979 | 0.021 | nonzero | nonzero | nonzero | 0.037 | |||||
| pg151.cx7 | 99.999 | 0.001 | nonzero | nonzero | 0.011 |
Insert response time histogram: each cell has the percentage of responses that take <= the time in the header and max is the max response time in seconds. For max values in the top 25% of the range have a red background and in the bottom 25% of the range have a green background. The red background is not used when the min value is within 80% of the max value.
| dbms | 256us | 1ms | 4ms | 16ms | 64ms | 256ms | 1s | 4s | 16s | gt | max |
|---|---|---|---|---|---|---|---|---|---|---|---|
| my8031.cy8 | 99.911 | 0.089 | 0.010 | ||||||||
| fbmy8028.clang.cy9c | 6.157 | 92.571 | 1.271 | 0.011 | |||||||
| fbmy8028.gcc.cy9c | 0.996 | 96.747 | 2.256 | 0.010 | |||||||
| pg151.cx7 | 97.017 | 2.748 | 0.235 | 0.024 |
Performance metrics for the DBMS listed above. Some are normalized by throughput, others are not. Legend for results is here.
ips	qps	rps	rmbps	wps	wmbps	rpq	rkbpq	wpi	wkbpi	csps	cpups	cspq	cpupq	dbgb1	dbgb2	rss	maxop	p50	p99	tag
2185	143181	0	0.0	401.5	11.7	0.000	0.000	0.184	5.488	549556	34.3	3.838	153	28.2	156.8	33.3	0.004	6569	6137	150m.my8031.cy8
2185	122453	0	0.0	31.5	6.7	0.000	0.000	0.014	3.160	470024	34.8	3.838	182	11.6	11.8	33.5	0.023	5674	5099	150m.fbmy8028.clang.cy9c
2185	113961	0	0.0	30.4	6.5	0.000	0.000	0.014	3.047	437631	34.9	3.840	196	11.6	11.8	32.9	0.037	5210	4747	150m.fbmy8028.gcc.cy9c
2185	400317	0	0.0	1875.1	61.0	0.000	0.000	0.858	28.567	1529656	33.9	3.821	54	34.3	79.9	0.0	0.011	18956	18317	150m.pg151.cx7
q500.1
q500.1: range queries with 500 insert/s per client. Graphs for performance per 1-second interval are here.
Average throughput:

Query response time histogram: each cell has the percentage of responses that take <= the time in the header and max is the max response time in seconds. For max values in the top 25% of the range have a red background and in the bottom 25% of the range have a green background. The red background is not used when the min value is within 80% of the max value.
| dbms | 256us | 1ms | 4ms | 16ms | 64ms | 256ms | 1s | 4s | 16s | gt | max |
|---|---|---|---|---|---|---|---|---|---|---|---|
| my8031.cy8 | 99.936 | 0.060 | 0.004 | nonzero | 0.011 | ||||||
| fbmy8028.clang.cy9c | 99.897 | 0.102 | 0.001 | nonzero | nonzero | 0.035 | |||||
| fbmy8028.gcc.cy9c | 99.798 | 0.200 | 0.002 | nonzero | nonzero | 0.036 | |||||
| pg151.cx7 | 99.993 | 0.006 | 0.001 | nonzero | 0.012 |
Insert response time histogram: each cell has the percentage of responses that take <= the time in the header and max is the max response time in seconds. For max values in the top 25% of the range have a red background and in the bottom 25% of the range have a green background. The red background is not used when the min value is within 80% of the max value.
| dbms | 256us | 1ms | 4ms | 16ms | 64ms | 256ms | 1s | 4s | 16s | gt | max |
|---|---|---|---|---|---|---|---|---|---|---|---|
| my8031.cy8 | 99.587 | 0.413 | nonzero | 0.018 | |||||||
| fbmy8028.clang.cy9c | 0.237 | 48.947 | 50.807 | 0.009 | 0.023 | ||||||
| fbmy8028.gcc.cy9c | 0.063 | 30.690 | 69.239 | 0.008 | 0.023 | ||||||
| pg151.cx7 | 0.002 | 75.856 | 23.208 | 0.934 | 0.035 |
Performance metrics for the DBMS listed above. Some are normalized by throughput, others are not. Legend for results is here.
ips	qps	rps	rmbps	wps	wmbps	rpq	rkbpq	wpi	wkbpi	csps	cpups	cspq	cpupq	dbgb1	dbgb2	rss	maxop	p50	p99	tag
10924	141291	0	0.0	412.4	17.7	0.000	0.000	0.038	1.663	545272	35.3	3.859	160	37.4	166.0	41.7	0.011	6413	5994	150m.my8031.cy8
10924	119638	0	0.0	95.4	22.3	0.000	0.000	0.009	2.094	464348	35.6	3.881	190	14.4	15.7	80.1	0.035	5546	5051	150m.fbmy8028.clang.cy9c
10924	112014	0	0.0	95.8	22.4	0.000	0.000	0.009	2.104	435045	35.6	3.884	203	14.4	15.7	79.6	0.036	5036	4620	150m.fbmy8028.gcc.cy9c
10924	386464	0	0.0	1534.3	109.5	0.000	0.000	0.140	10.264	1481998	34.3	3.835	57	39.4	75.1	0.0	0.012	18173	17293	150m.pg151.cx7
q1000.1
q1000.1: range queries with 1000 insert/s per client. Graphs for performance per 1-second interval are here.
Average throughput:
Query response time histogram: each cell has the percentage of responses that take <= the time in the header and max is the max response time in seconds. For max values in the top 25% of the range have a red background and in the bottom 25% of the range have a green background. The red background is not used when the min value is within 80% of the max value.
| dbms | 256us | 1ms | 4ms | 16ms | 64ms | 256ms | 1s | 4s | 16s | gt | max |
|---|---|---|---|---|---|---|---|---|---|---|---|
| my8031.cy8 | 99.900 | 0.095 | 0.005 | nonzero | 0.013 | ||||||
| fbmy8028.clang.cy9c | 99.619 | 0.378 | 0.003 | nonzero | nonzero | 0.040 | |||||
| fbmy8028.gcc.cy9c | 99.291 | 0.706 | 0.004 | nonzero | nonzero | 0.037 | |||||
| pg151.cx7 | 99.984 | 0.014 | 0.002 | 0.001 | 0.016 |
Insert response time histogram: each cell has the percentage of responses that take <= the time in the header and max is the max response time in seconds. For max values in the top 25% of the range have a red background and in the bottom 25% of the range have a green background. The red background is not used when the min value is within 80% of the max value.
| dbms | 256us | 1ms | 4ms | 16ms | 64ms | 256ms | 1s | 4s | 16s | gt | max |
|---|---|---|---|---|---|---|---|---|---|---|---|
| my8031.cy8 | 99.632 | 0.357 | 0.011 | 0.025 | |||||||
| fbmy8028.clang.cy9c | 0.189 | 31.427 | 68.349 | 0.034 | 0.031 | ||||||
| fbmy8028.gcc.cy9c | 0.048 | 23.934 | 75.983 | 0.036 | 0.031 | ||||||
| pg151.cx7 | 0.002 | 82.044 | 16.985 | 0.969 | 0.036 |
Performance metrics for the DBMS listed above. Some are normalized by throughput, others are not. Legend for results is here.
ips	qps	rps	rmbps	wps	wmbps	rpq	rkbpq	wpi	wkbpi	csps	cpups	cspq	cpupq	dbgb1	dbgb2	rss	maxop	p50	p99	tag
21848	137408	0	0.0	1044.5	40.9	0.000	0.000	0.048	1.918	536678	35.6	3.906	166	53.5	182.1	56.3	0.013	6313	5962	150m.my8031.cy8
21854	115103	0	0.0	198.5	46.5	0.000	0.000	0.009	2.177	453651	36.7	3.941	204	20.2	21.6	94.5	0.040	5308	4876	150m.fbmy8028.clang.cy9c
21848	107790	0	0.0	200.1	46.8	0.000	0.000	0.009	2.192	425326	36.7	3.946	218	19.9	21.4	94.0	0.037	4907	4491	150m.fbmy8028.gcc.cy9c
21854	382136	0	0.0	2001.1	175.9	0.000	0.000	0.092	8.241	1469707	35.2	3.846	59	63.8	112.6	0.0	0.016	17293	15999	150m.pg151.cx7
l.i0
l.i0: load without secondary indexes
Performance metrics for all DBMS, not just the ones listed above. Some are normalized by throughput, others are not. Legend for results is here.
ips	qps	rps	rmbps	wps	wmbps	rpq	rkbpq	wpi	wkbpi	csps	cpups	cspq	cpupq	dbgb1	dbgb2	rss	maxop	p50	p99	tag
1233619	0	0	0.0	1843.7	316.6	0.000	0.000	0.001	0.263	209592	31.9	0.170	17	7.0	135.6	14.6	0.143	89303	17681	150m.my8031.cy8
819200	0	0	0.0	1277.8	290.7	0.000	0.000	0.002	0.363	242858	32.0	0.296	25	6.2	6.7	1.8	0.070	50546	14984	150m.fbmy8028.clang.cy9c
806597	0	0	0.0	1247.4	285.0	0.000	0.000	0.002	0.362	213442	31.8	0.265	25	4.0	4.5	1.8	0.073	45351	34863	150m.fbmy8028.gcc.cy9c
1588752	0	0	0.0	2915.3	680.7	0.000	0.000	0.002	0.439	198608	31.3	0.125	13	10.0	27.1	9.8	0.006	140450	14984	150m.pg151.cx7
l.x
l.x: create secondary indexes
Performance metrics for all DBMS, not just the ones listed above. Some are normalized by throughput, others are not. Legend for results is here.
ips	qps	rps	rmbps	wps	wmbps	rpq	rkbpq	wpi	wkbpi	csps	cpups	cspq	cpupq	dbgb1	dbgb2	rss	maxop	p50	p99	tag
1543494	0	8857	569.2	30425.4	1454.0	0.006	0.378	0.020	0.965	151184	22.8	0.098	9	15.6	144.1	18.1	0.002	NA	NA	150m.my8031.cy8
1399435	0	4	0.2	1168.4	264.4	0.000	0.000	0.001	0.193	9297	26.2	0.007	12	7.2	7.8	11.2	0.002	NA	NA	150m.fbmy8028.clang.cy9c
1381021	0	4	0.2	1155.0	260.5	0.000	0.000	0.001	0.193	9066	26.1	0.007	12	7.3	7.8	10.7	0.008	NA	NA	150m.fbmy8028.gcc.cy9c
3086988	0	0	0.0	3257.7	789.7	0.000	0.000	0.001	0.262	51015	14.1	0.017	3	19.3	44.8	0.0	0.023	NA	NA	150m.pg151.cx7
l.i1
l.i1: continue load after secondary indexes created
Performance metrics for all DBMS, not just the ones listed above. Some are normalized by throughput, others are not. Legend for results is here.
ips	qps	rps	rmbps	wps	wmbps	rpq	rkbpq	wpi	wkbpi	csps	cpups	cspq	cpupq	dbgb1	dbgb2	rss	maxop	p50	p99	tag
485452	0	4540	70.9	3423.1	389.4	0.009	0.150	0.007	0.821	188999	30.3	0.389	40	27.7	156.3	32.8	0.217	30318	350	150m.my8031.cy8
241607	0	147	18.2	1312.5	305.3	0.001	0.077	0.005	1.294	108278	18.4	0.448	49	14.6	15.8	12.9	0.087	11288	7692	150m.fbmy8028.clang.cy9c
225986	0	138	17.0	1307.3	303.7	0.001	0.077	0.006	1.376	101564	18.7	0.449	53	13.0	14.2	12.5	0.083	10639	9290	150m.fbmy8028.gcc.cy9c
663656	0	0	0.0	3306.0	776.0	0.000	0.000	0.005	1.197	226966	31.1	0.342	30	33.6	82.3	15.7	0.012	40257	17731	150m.pg151.cx7
q100.1
q100.1: range queries with 100 insert/s per client
Performance metrics for all DBMS, not just the ones listed above. Some are normalized by throughput, others are not. Legend for results is here.
ips	qps	rps	rmbps	wps	wmbps	rpq	rkbpq	wpi	wkbpi	csps	cpups	cspq	cpupq	dbgb1	dbgb2	rss	maxop	p50	p99	tag
2185	143181	0	0.0	401.5	11.7	0.000	0.000	0.184	5.488	549556	34.3	3.838	153	28.2	156.8	33.3	0.004	6569	6137	150m.my8031.cy8
2185	122453	0	0.0	31.5	6.7	0.000	0.000	0.014	3.160	470024	34.8	3.838	182	11.6	11.8	33.5	0.023	5674	5099	150m.fbmy8028.clang.cy9c
2185	113961	0	0.0	30.4	6.5	0.000	0.000	0.014	3.047	437631	34.9	3.840	196	11.6	11.8	32.9	0.037	5210	4747	150m.fbmy8028.gcc.cy9c
2185	400317	0	0.0	1875.1	61.0	0.000	0.000	0.858	28.567	1529656	33.9	3.821	54	34.3	79.9	0.0	0.011	18956	18317	150m.pg151.cx7
q500.1
q500.1: range queries with 500 insert/s per client
Performance metrics for all DBMS, not just the ones listed above. Some are normalized by throughput, others are not. Legend for results is here.
ips	qps	rps	rmbps	wps	wmbps	rpq	rkbpq	wpi	wkbpi	csps	cpups	cspq	cpupq	dbgb1	dbgb2	rss	maxop	p50	p99	tag
10924	141291	0	0.0	412.4	17.7	0.000	0.000	0.038	1.663	545272	35.3	3.859	160	37.4	166.0	41.7	0.011	6413	5994	150m.my8031.cy8
10924	119638	0	0.0	95.4	22.3	0.000	0.000	0.009	2.094	464348	35.6	3.881	190	14.4	15.7	80.1	0.035	5546	5051	150m.fbmy8028.clang.cy9c
10924	112014	0	0.0	95.8	22.4	0.000	0.000	0.009	2.104	435045	35.6	3.884	203	14.4	15.7	79.6	0.036	5036	4620	150m.fbmy8028.gcc.cy9c
10924	386464	0	0.0	1534.3	109.5	0.000	0.000	0.140	10.264	1481998	34.3	3.835	57	39.4	75.1	0.0	0.012	18173	17293	150m.pg151.cx7
q1000.1
q1000.1: range queries with 1000 insert/s per client
Performance metrics for all DBMS, not just the ones listed above. Some are normalized by throughput, others are not. Legend for results is here.
ips	qps	rps	rmbps	wps	wmbps	rpq	rkbpq	wpi	wkbpi	csps	cpups	cspq	cpupq	dbgb1	dbgb2	rss	maxop	p50	p99	tag
21848	137408	0	0.0	1044.5	40.9	0.000	0.000	0.048	1.918	536678	35.6	3.906	166	53.5	182.1	56.3	0.013	6313	5962	150m.my8031.cy8
21854	115103	0	0.0	198.5	46.5	0.000	0.000	0.009	2.177	453651	36.7	3.941	204	20.2	21.6	94.5	0.040	5308	4876	150m.fbmy8028.clang.cy9c
21848	107790	0	0.0	200.1	46.8	0.000	0.000	0.009	2.192	425326	36.7	3.946	218	19.9	21.4	94.0	0.037	4907	4491	150m.fbmy8028.gcc.cy9c
21854	382136	0	0.0	2001.1	175.9	0.000	0.000	0.092	8.241	1469707	35.2	3.846	59	63.8	112.6	0.0	0.016	17293	15999	150m.pg151.cx7
l.i0
- l.i0: load without secondary indexes
- Legend for results is here.
- Each entry lists the percentage of responses that fit in that bucket (slower than max time for previous bucket, faster than min time for next bucket).
Insert response time histogram
256us	1ms	4ms	16ms	64ms	256ms	1s	4s	16s	gt	max	tag
0.000	15.465	84.300	0.161	0.021	0.054	0.000	0.000	0.000	0.000	0.143	my8031.cy8
0.000	6.105	93.726	0.098	0.070	0.001	0.000	0.000	0.000	0.000	0.070	fbmy8028.clang.cy9c
0.000	5.063	94.771	0.095	0.068	0.002	0.000	0.000	0.000	0.000	0.073	fbmy8028.gcc.cy9c
0.000	99.766	0.231	0.003	0.000	0.000	0.000	0.000	0.000	0.000	0.006	pg151.cx7
l.x
- l.x: create secondary indexes
- Legend for results is here.
- Each entry lists the percentage of responses that fit in that bucket (slower than max time for previous bucket, faster than min time for next bucket).
TODO - determine whether there is data for create index response time
l.i1
- l.i1: continue load after secondary indexes created
- Legend for results is here.
- Each entry lists the percentage of responses that fit in that bucket (slower than max time for previous bucket, faster than min time for next bucket).
Insert response time histogram
256us	1ms	4ms	16ms	64ms	256ms	1s	4s	16s	gt	max	tag
0.000	0.000	99.299	0.349	0.205	0.147	0.000	0.000	0.000	0.000	0.217	my8031.cy8
0.000	0.667	40.489	58.765	0.077	0.003	0.000	0.000	0.000	0.000	0.087	fbmy8028.clang.cy9c
0.000	0.481	32.434	67.043	0.038	0.004	0.000	0.000	0.000	0.000	0.083	fbmy8028.gcc.cy9c
0.000	7.629	92.357	0.013	0.000	0.000	0.000	0.000	0.000	0.000	0.012	pg151.cx7
q100.1
- q100.1: range queries with 100 insert/s per client
- Legend for results is here.
- Each entry lists the percentage of responses that fit in that bucket (slower than max time for previous bucket, faster than min time for next bucket).
Query response time histogram
256us	1ms	4ms	16ms	64ms	256ms	1s	4s	16s	gt	max	tag
99.996	0.003	nonzero	nonzero	0.000	0.000	0.000	0.000	0.000	0.000	0.004	my8031.cy8
99.972	0.028	nonzero	nonzero	nonzero	0.000	0.000	0.000	0.000	0.000	0.023	fbmy8028.clang.cy9c
99.979	0.021	nonzero	nonzero	nonzero	0.000	0.000	0.000	0.000	0.000	0.037	fbmy8028.gcc.cy9c
99.999	0.001	nonzero	nonzero	0.000	0.000	0.000	0.000	0.000	0.000	0.011	pg151.cx7
Insert response time histogram
256us	1ms	4ms	16ms	64ms	256ms	1s	4s	16s	gt	max	tag
0.000	0.000	99.911	0.089	0.000	0.000	0.000	0.000	0.000	0.000	0.010	my8031.cy8
0.000	6.157	92.571	1.271	0.000	0.000	0.000	0.000	0.000	0.000	0.011	fbmy8028.clang.cy9c
0.000	0.996	96.747	2.256	0.000	0.000	0.000	0.000	0.000	0.000	0.010	fbmy8028.gcc.cy9c
0.000	0.000	97.017	2.748	0.235	0.000	0.000	0.000	0.000	0.000	0.024	pg151.cx7
q500.1
- q500.1: range queries with 500 insert/s per client
- Legend for results is here.
- Each entry lists the percentage of responses that fit in that bucket (slower than max time for previous bucket, faster than min time for next bucket).
Query response time histogram
256us	1ms	4ms	16ms	64ms	256ms	1s	4s	16s	gt	max	tag
99.936	0.060	0.004	nonzero	0.000	0.000	0.000	0.000	0.000	0.000	0.011	my8031.cy8
99.897	0.102	0.001	nonzero	nonzero	0.000	0.000	0.000	0.000	0.000	0.035	fbmy8028.clang.cy9c
99.798	0.200	0.002	nonzero	nonzero	0.000	0.000	0.000	0.000	0.000	0.036	fbmy8028.gcc.cy9c
99.993	0.006	0.001	nonzero	0.000	0.000	0.000	0.000	0.000	0.000	0.012	pg151.cx7
Insert response time histogram
256us	1ms	4ms	16ms	64ms	256ms	1s	4s	16s	gt	max	tag
0.000	0.000	99.587	0.413	nonzero	0.000	0.000	0.000	0.000	0.000	0.018	my8031.cy8
0.000	0.237	48.947	50.807	0.009	0.000	0.000	0.000	0.000	0.000	0.023	fbmy8028.clang.cy9c
0.000	0.063	30.690	69.239	0.008	0.000	0.000	0.000	0.000	0.000	0.023	fbmy8028.gcc.cy9c
0.000	0.002	75.856	23.208	0.934	0.000	0.000	0.000	0.000	0.000	0.035	pg151.cx7
q1000.1
- q1000.1: range queries with 1000 insert/s per client
- Legend for results is here.
- Each entry lists the percentage of responses that fit in that bucket (slower than max time for previous bucket, faster than min time for next bucket).
Query response time histogram
256us	1ms	4ms	16ms	64ms	256ms	1s	4s	16s	gt	max	tag
99.900	0.095	0.005	nonzero	0.000	0.000	0.000	0.000	0.000	0.000	0.013	my8031.cy8
99.619	0.378	0.003	nonzero	nonzero	0.000	0.000	0.000	0.000	0.000	0.040	fbmy8028.clang.cy9c
99.291	0.706	0.004	nonzero	nonzero	0.000	0.000	0.000	0.000	0.000	0.037	fbmy8028.gcc.cy9c
99.984	0.014	0.002	0.001	0.000	0.000	0.000	0.000	0.000	0.000	0.016	pg151.cx7
Insert response time histogram
256us	1ms	4ms	16ms	64ms	256ms	1s	4s	16s	gt	max	tag
0.000	0.000	99.632	0.357	0.011	0.000	0.000	0.000	0.000	0.000	0.025	my8031.cy8
0.000	0.189	31.427	68.349	0.034	0.000	0.000	0.000	0.000	0.000	0.031	fbmy8028.clang.cy9c
0.000	0.048	23.934	75.983	0.036	0.000	0.000	0.000	0.000	0.000	0.031	fbmy8028.gcc.cy9c
0.000	0.002	82.044	16.985	0.969	0.000	0.000	0.000	0.000	0.000	0.036	pg151.cx7