Introduction
This is a report for the insert benchmark with 150M docs and 44 client(s). It is generated by scripts (bash, awk, sed) and Tufte might not be impressed. An overview of the insert benchmark is here and a short update is here. Below, by DBMS, I mean DBMS+version.config. An example is my8020.c10b40 where my means MySQL, 8020 is version 8.0.20 and c10b40 is the name for the configuration file.
The test server is an c6i.16xl with 32 cores, 64 HW threads (hyperthread enabled), 128G RAM and io2 storage (5T, 64K IOPs). The benchmark was run with 44 clients and there was 1 or 2 connections per client (1 for queries, 1 for inserts). The benchmark loads 100M rows without secondary indexes, creates secondary indexes, loads another 50M rows then does 3 read+write tests for one hour each that do queries as fast as possible with 100, 500 and then 1000 writes/second/client concurrent with the queries. The database is cached by the storage engine and the only IO is for writes. Clients and the DBMS share one server. The per-database configs are in the per-database subdirectories here.
The tested DBMS are:
- my8031.cy8_128gram_64kiops - MySQL 8.0.31 with InnoDB and the cy8_128gram_64kiops config
- fbmy8028.cy9c_128gram_64kiops - FB MySQL 8.0.28 with MyRocks and the cy9c_128gram_64kiops config
- pg151.cx7_128gram_64kiops - Postgres 15.1 and the cx7_128gram_64kiops config
Contents
- Summary
- l.i0: load without secondary indexes
- l.x: create secondary indexes
- l.i1: continue load after secondary indexes created
- q100.1: range queries with 100 insert/s per client
- q500.1: range queries with 500 insert/s per client
- q1000.1: range queries with 1000 insert/s per client
Summary
The numbers are inserts/s for l.i0 and l.i1, indexed docs (or rows) /s for l.x and queries/s for q*.2. The values are the average rate over the entire test for inserts (IPS) and queries (QPS). The range of values for IPS and QPS is split into 3 parts: bottom 25%, middle 50%, top 25%. Values in the bottom 25% have a red background, values in the top 25% have a green background and values in the middle have no color. A gray background is used for values that can be ignored because the DBMS did not sustain the target insert rate. Red backgrounds are not used when the minimum value is within 80% of the max value.
| dbms | l.i0 | l.x | l.i1 | q100.1 | q500.1 | q1000.1 |
|---|---|---|---|---|---|---|
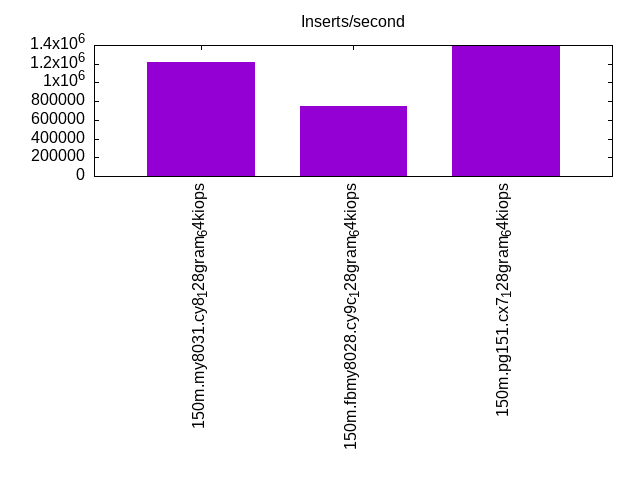
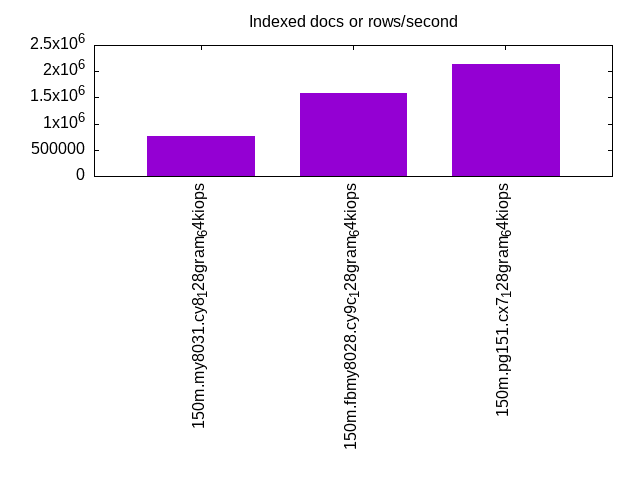
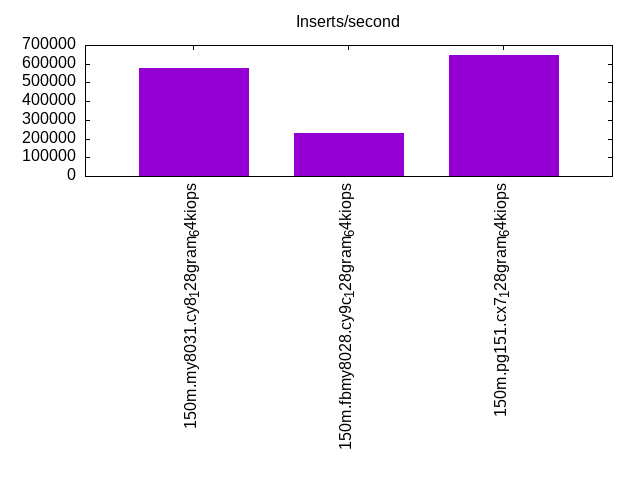
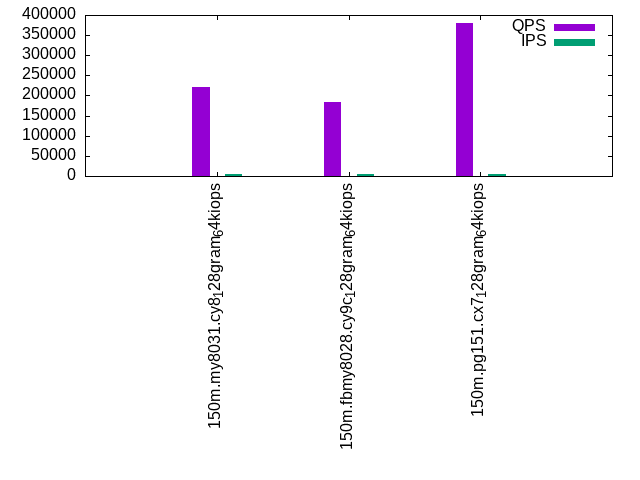
| 150m.my8031.cy8_128gram_64kiops | 1219274 | 766114 | 576141 | 220229 | 215457 | 210453 |
| 150m.fbmy8028.cy9c_128gram_64kiops | 748983 | 1590267 | 231986 | 183174 | 172590 | 154735 |
| 150m.pg151.cx7_128gram_64kiops | 1398101 | 2141992 | 647269 | 379577 | 368892 | 360321 |
This lists the average rate of inserts/s for the tests that do inserts concurrent with queries. For such tests the query rate is listed in the table above. The read+write tests are setup so that the insert rate should match the target rate every second. Cells that are not at least 95% of the target have a red background to indicate a failure to satisfy the target.
| dbms | q100.1 | q500.1 | q1000.1 |
|---|---|---|---|
| my8031.cy8_128gram_64kiops | 4343 | 21710 | 43433 |
| fbmy8028.cy9c_128gram_64kiops | 4343 | 21716 | 43445 |
| pg151.cx7_128gram_64kiops | 4343 | 21716 | 43373 |
| target | 4400 | 22000 | 44000 |
l.i0
l.i0: load without secondary indexes. Graphs for performance per 1-second interval are here.
Average throughput:
Insert response time histogram: each cell has the percentage of responses that take <= the time in the header and max is the max response time in seconds. For the max column values in the top 25% of the range have a red background and in the bottom 25% of the range have a green background. The red background is not used when the min value is within 80% of the max value.
| dbms | 256us | 1ms | 4ms | 16ms | 64ms | 256ms | 1s | 4s | 16s | gt | max |
|---|---|---|---|---|---|---|---|---|---|---|---|
| my8031.cy8_128gram_64kiops | 11.756 | 87.868 | 0.275 | 0.051 | 0.050 | 0.106 | |||||
| fbmy8028.cy9c_128gram_64kiops | 1.637 | 58.307 | 39.938 | 0.107 | 0.012 | 0.102 | |||||
| pg151.cx7_128gram_64kiops | 53.405 | 46.538 | 0.021 | 0.037 | 0.041 |
Performance metrics for the DBMS listed above. Some are normalized by throughput, others are not. Legend for results is here.
ips	qps	rps	rmbps	wps	wmbps	rpq	rkbpq	wpi	wkbpi	csps	cpups	cspq	cpupq	dbgb1	dbgb2	rss	maxop	p50	p99	tag
1219274	0	0	0.0	1862.8	317.2	0.000	0.000	0.002	0.266	189589	41.0	0.155	22	7.2	135.8	14.6	0.106	89284	19379	150m.my8031.cy8_128gram_64kiops
748983	0	0	0.0	1087.0	246.6	0.000	0.000	0.001	0.337	591973	47.2	0.790	40	4.2	4.8	1.8	0.102	66044	29469	150m.fbmy8028.cy9c_128gram_64kiops
1398101	0	0	0.0	2420.0	561.7	0.000	0.000	0.002	0.411	165565	36.8	0.118	17	10.0	27.1	9.0	0.041	139349	60835	150m.pg151.cx7_128gram_64kiops
l.x
l.x: create secondary indexes.
Average throughput:
Performance metrics for the DBMS listed above. Some are normalized by throughput, others are not. Legend for results is here.
ips	qps	rps	rmbps	wps	wmbps	rpq	rkbpq	wpi	wkbpi	csps	cpups	cspq	cpupq	dbgb1	dbgb2	rss	maxop	p50	p99	tag
766114	0	4549	280.0	15038.3	670.7	0.006	0.374	0.020	0.896	180068	21.7	0.235	18	15.6	144.2	17.5	0.005	NA	NA	150m.my8031.cy8_128gram_64kiops
1590267	0	9	0.3	1731.2	389.4	0.000	0.000	0.001	0.251	11959	26.1	0.008	11	7.3	7.8	9.5	0.006	NA	NA	150m.fbmy8028.cy9c_128gram_64kiops
2141992	0	0	0.0	2352.1	568.3	0.000	0.000	0.001	0.272	22141	10.5	0.010	3	19.3	44.8	0.0	0.019	NA	NA	150m.pg151.cx7_128gram_64kiops
l.i1
l.i1: continue load after secondary indexes created. Graphs for performance per 1-second interval are here.
Average throughput:
Insert response time histogram: each cell has the percentage of responses that take <= the time in the header and max is the max response time in seconds. For the max column values in the top 25% of the range have a red background and in the bottom 25% of the range have a green background. The red background is not used when the min value is within 80% of the max value.
| dbms | 256us | 1ms | 4ms | 16ms | 64ms | 256ms | 1s | 4s | 16s | gt | max |
|---|---|---|---|---|---|---|---|---|---|---|---|
| my8031.cy8_128gram_64kiops | 0.056 | 98.632 | 0.928 | 0.223 | 0.161 | nonzero | 0.267 | ||||
| fbmy8028.cy9c_128gram_64kiops | 0.240 | 9.060 | 90.627 | 0.073 | nonzero | 0.065 | |||||
| pg151.cx7_128gram_64kiops | 7.326 | 91.830 | 0.376 | 0.467 | 0.057 |
Performance metrics for the DBMS listed above. Some are normalized by throughput, others are not. Legend for results is here.
ips	qps	rps	rmbps	wps	wmbps	rpq	rkbpq	wpi	wkbpi	csps	cpups	cspq	cpupq	dbgb1	dbgb2	rss	maxop	p50	p99	tag
576141	0	5241	81.9	3503.5	441.5	0.009	0.146	0.006	0.785	212819	42.6	0.369	47	27.8	156.4	32.8	0.267	26571	200	150m.my8031.cy8_128gram_64kiops
231986	0	110	13.5	1067.4	245.7	0.000	0.060	0.005	1.085	101751	21.3	0.439	59	19.1	20.4	11.1	0.065	5644	1299	150m.fbmy8028.cy9c_128gram_64kiops
647269	0	0	0.0	3205.2	756.0	0.000	0.000	0.005	1.196	355659	37.1	0.549	37	33.6	82.3	0.0	0.057	38991	13539	150m.pg151.cx7_128gram_64kiops
q100.1
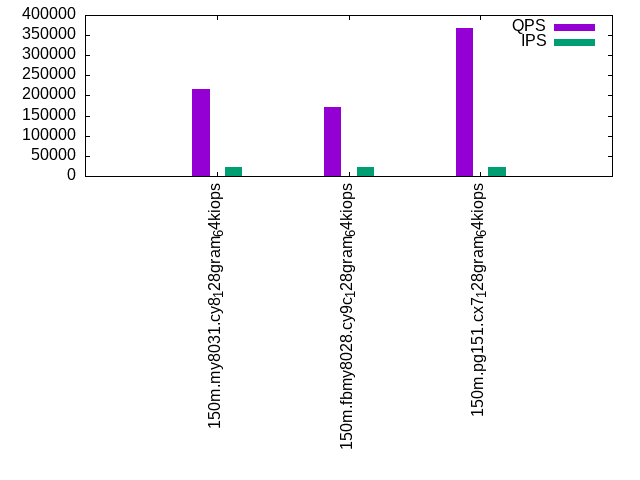
q100.1: range queries with 100 insert/s per client. Graphs for performance per 1-second interval are here.
Average throughput:
Query response time histogram: each cell has the percentage of responses that take <= the time in the header and max is the max response time in seconds. For max values in the top 25% of the range have a red background and in the bottom 25% of the range have a green background. The red background is not used when the min value is within 80% of the max value.
| dbms | 256us | 1ms | 4ms | 16ms | 64ms | 256ms | 1s | 4s | 16s | gt | max |
|---|---|---|---|---|---|---|---|---|---|---|---|
| my8031.cy8_128gram_64kiops | 94.590 | 5.402 | 0.008 | nonzero | nonzero | 0.023 | |||||
| fbmy8028.cy9c_128gram_64kiops | 87.744 | 12.245 | 0.011 | nonzero | nonzero | nonzero | 0.124 | ||||
| pg151.cx7_128gram_64kiops | 99.937 | 0.059 | 0.004 | nonzero | nonzero | 0.022 |
Insert response time histogram: each cell has the percentage of responses that take <= the time in the header and max is the max response time in seconds. For max values in the top 25% of the range have a red background and in the bottom 25% of the range have a green background. The red background is not used when the min value is within 80% of the max value.
| dbms | 256us | 1ms | 4ms | 16ms | 64ms | 256ms | 1s | 4s | 16s | gt | max |
|---|---|---|---|---|---|---|---|---|---|---|---|
| my8031.cy8_128gram_64kiops | 98.962 | 1.038 | 0.013 | ||||||||
| fbmy8028.cy9c_128gram_64kiops | 0.064 | 97.648 | 2.288 | 0.013 | |||||||
| pg151.cx7_128gram_64kiops | nonzero | 93.253 | 5.787 | 0.959 | 0.001 | 0.072 |
Performance metrics for the DBMS listed above. Some are normalized by throughput, others are not. Legend for results is here.
ips	qps	rps	rmbps	wps	wmbps	rpq	rkbpq	wpi	wkbpi	csps	cpups	cspq	cpupq	dbgb1	dbgb2	rss	maxop	p50	p99	tag
4343	220229	0	0.0	411.9	12.8	0.000	0.000	0.095	3.018	830900	65.2	3.773	189	28.9	157.5	33.8	0.023	5066	5003	150m.my8031.cy8_128gram_64kiops
4343	183174	32	0.3	56.6	12.8	0.000	0.001	0.013	3.013	696301	66.3	3.801	232	12.2	13.6	45.6	0.124	4219	3885	150m.fbmy8028.cy9c_128gram_64kiops
4343	379577	0	0.0	1906.2	85.1	0.000	0.000	0.439	20.054	1414295	62.9	3.726	106	35.1	85.5	23.0	0.022	8679	8551	150m.pg151.cx7_128gram_64kiops
q500.1
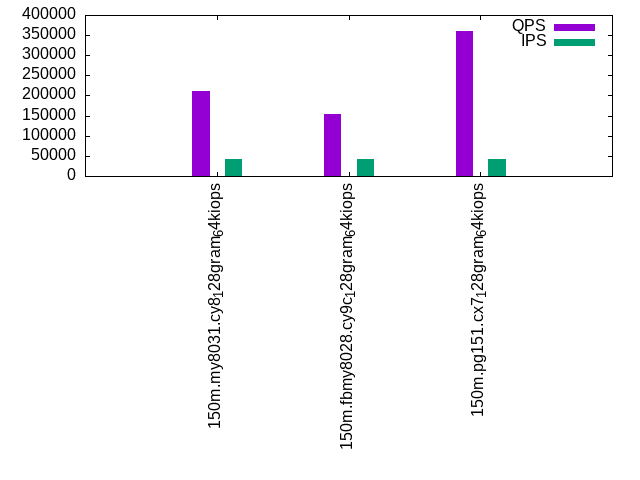
q500.1: range queries with 500 insert/s per client. Graphs for performance per 1-second interval are here.
Average throughput:
Query response time histogram: each cell has the percentage of responses that take <= the time in the header and max is the max response time in seconds. For max values in the top 25% of the range have a red background and in the bottom 25% of the range have a green background. The red background is not used when the min value is within 80% of the max value.
| dbms | 256us | 1ms | 4ms | 16ms | 64ms | 256ms | 1s | 4s | 16s | gt | max |
|---|---|---|---|---|---|---|---|---|---|---|---|
| my8031.cy8_128gram_64kiops | 93.886 | 6.072 | 0.039 | 0.002 | nonzero | 0.024 | |||||
| fbmy8028.cy9c_128gram_64kiops | 77.648 | 22.301 | 0.050 | 0.001 | nonzero | 0.039 | |||||
| pg151.cx7_128gram_64kiops | 99.761 | 0.215 | 0.022 | 0.002 | nonzero | 0.025 |
Insert response time histogram: each cell has the percentage of responses that take <= the time in the header and max is the max response time in seconds. For max values in the top 25% of the range have a red background and in the bottom 25% of the range have a green background. The red background is not used when the min value is within 80% of the max value.
| dbms | 256us | 1ms | 4ms | 16ms | 64ms | 256ms | 1s | 4s | 16s | gt | max |
|---|---|---|---|---|---|---|---|---|---|---|---|
| my8031.cy8_128gram_64kiops | 80.167 | 19.810 | 0.023 | 0.030 | |||||||
| fbmy8028.cy9c_128gram_64kiops | 0.004 | 5.233 | 93.119 | 1.644 | 0.041 | ||||||
| pg151.cx7_128gram_64kiops | 58.895 | 33.388 | 7.680 | 0.038 | 0.101 |
Performance metrics for the DBMS listed above. Some are normalized by throughput, others are not. Legend for results is here.
ips	qps	rps	rmbps	wps	wmbps	rpq	rkbpq	wpi	wkbpi	csps	cpups	cspq	cpupq	dbgb1	dbgb2	rss	maxop	p50	p99	tag
21710	215457	0	0.0	1006.7	42.1	0.000	0.000	0.046	1.987	814633	66.5	3.781	198	51.4	180.0	53.9	0.024	4971	4877	150m.my8031.cy8_128gram_64kiops
21716	172590	0	0.0	195.9	45.7	0.000	0.000	0.009	2.154	659890	68.1	3.823	253	17.8	19.8	82.6	0.039	3996	3676	150m.fbmy8028.cy9c_128gram_64kiops
21716	368892	0	0.0	1411.7	146.9	0.000	0.000	0.065	6.929	1379571	64.0	3.740	111	58.1	102.8	0.0	0.025	8439	8103	150m.pg151.cx7_128gram_64kiops
q1000.1
q1000.1: range queries with 1000 insert/s per client. Graphs for performance per 1-second interval are here.
Average throughput:
Query response time histogram: each cell has the percentage of responses that take <= the time in the header and max is the max response time in seconds. For max values in the top 25% of the range have a red background and in the bottom 25% of the range have a green background. The red background is not used when the min value is within 80% of the max value.
| dbms | 256us | 1ms | 4ms | 16ms | 64ms | 256ms | 1s | 4s | 16s | gt | max |
|---|---|---|---|---|---|---|---|---|---|---|---|
| my8031.cy8_128gram_64kiops | 93.128 | 6.818 | 0.052 | 0.002 | nonzero | 0.026 | |||||
| fbmy8028.cy9c_128gram_64kiops | 47.274 | 52.617 | 0.107 | 0.002 | nonzero | nonzero | 0.064 | ||||
| pg151.cx7_128gram_64kiops | 99.649 | 0.303 | 0.036 | 0.009 | 0.003 | nonzero | nonzero | 0.428 |
Insert response time histogram: each cell has the percentage of responses that take <= the time in the header and max is the max response time in seconds. For max values in the top 25% of the range have a red background and in the bottom 25% of the range have a green background. The red background is not used when the min value is within 80% of the max value.
| dbms | 256us | 1ms | 4ms | 16ms | 64ms | 256ms | 1s | 4s | 16s | gt | max |
|---|---|---|---|---|---|---|---|---|---|---|---|
| my8031.cy8_128gram_64kiops | 84.231 | 15.706 | 0.063 | 0.044 | |||||||
| fbmy8028.cy9c_128gram_64kiops | 0.008 | 12.817 | 84.603 | 2.573 | 0.059 | ||||||
| pg151.cx7_128gram_64kiops | 0.010 | 70.840 | 21.838 | 6.609 | 0.700 | 0.003 | 0.526 |
Performance metrics for the DBMS listed above. Some are normalized by throughput, others are not. Legend for results is here.
ips	qps	rps	rmbps	wps	wmbps	rpq	rkbpq	wpi	wkbpi	csps	cpups	cspq	cpupq	dbgb1	dbgb2	rss	maxop	p50	p99	tag
43433	210453	0	0.0	1810.7	71.6	0.000	0.000	0.042	1.688	794004	67.6	3.773	206	76.5	205.1	77.0	0.026	4827	4731	150m.my8031.cy8_128gram_64kiops
43445	154735	0	0.0	386.0	87.5	0.000	0.000	0.009	2.062	594546	70.6	3.842	292	29.3	30.5	83.4	0.064	3580	3165	150m.fbmy8028.cy9c_128gram_64kiops
43373	360321	2	0.0	2152.1	258.5	0.000	0.000	0.050	6.104	1347131	64.5	3.739	115	80.4	157.3	0.0	0.428	8231	6201	150m.pg151.cx7_128gram_64kiops
l.i0
l.i0: load without secondary indexes
Performance metrics for all DBMS, not just the ones listed above. Some are normalized by throughput, others are not. Legend for results is here.
ips	qps	rps	rmbps	wps	wmbps	rpq	rkbpq	wpi	wkbpi	csps	cpups	cspq	cpupq	dbgb1	dbgb2	rss	maxop	p50	p99	tag
1219274	0	0	0.0	1862.8	317.2	0.000	0.000	0.002	0.266	189589	41.0	0.155	22	7.2	135.8	14.6	0.106	89284	19379	150m.my8031.cy8_128gram_64kiops
748983	0	0	0.0	1087.0	246.6	0.000	0.000	0.001	0.337	591973	47.2	0.790	40	4.2	4.8	1.8	0.102	66044	29469	150m.fbmy8028.cy9c_128gram_64kiops
1398101	0	0	0.0	2420.0	561.7	0.000	0.000	0.002	0.411	165565	36.8	0.118	17	10.0	27.1	9.0	0.041	139349	60835	150m.pg151.cx7_128gram_64kiops
l.x
l.x: create secondary indexes
Performance metrics for all DBMS, not just the ones listed above. Some are normalized by throughput, others are not. Legend for results is here.
ips	qps	rps	rmbps	wps	wmbps	rpq	rkbpq	wpi	wkbpi	csps	cpups	cspq	cpupq	dbgb1	dbgb2	rss	maxop	p50	p99	tag
766114	0	4549	280.0	15038.3	670.7	0.006	0.374	0.020	0.896	180068	21.7	0.235	18	15.6	144.2	17.5	0.005	NA	NA	150m.my8031.cy8_128gram_64kiops
1590267	0	9	0.3	1731.2	389.4	0.000	0.000	0.001	0.251	11959	26.1	0.008	11	7.3	7.8	9.5	0.006	NA	NA	150m.fbmy8028.cy9c_128gram_64kiops
2141992	0	0	0.0	2352.1	568.3	0.000	0.000	0.001	0.272	22141	10.5	0.010	3	19.3	44.8	0.0	0.019	NA	NA	150m.pg151.cx7_128gram_64kiops
l.i1
l.i1: continue load after secondary indexes created
Performance metrics for all DBMS, not just the ones listed above. Some are normalized by throughput, others are not. Legend for results is here.
ips	qps	rps	rmbps	wps	wmbps	rpq	rkbpq	wpi	wkbpi	csps	cpups	cspq	cpupq	dbgb1	dbgb2	rss	maxop	p50	p99	tag
576141	0	5241	81.9	3503.5	441.5	0.009	0.146	0.006	0.785	212819	42.6	0.369	47	27.8	156.4	32.8	0.267	26571	200	150m.my8031.cy8_128gram_64kiops
231986	0	110	13.5	1067.4	245.7	0.000	0.060	0.005	1.085	101751	21.3	0.439	59	19.1	20.4	11.1	0.065	5644	1299	150m.fbmy8028.cy9c_128gram_64kiops
647269	0	0	0.0	3205.2	756.0	0.000	0.000	0.005	1.196	355659	37.1	0.549	37	33.6	82.3	0.0	0.057	38991	13539	150m.pg151.cx7_128gram_64kiops
q100.1
q100.1: range queries with 100 insert/s per client
Performance metrics for all DBMS, not just the ones listed above. Some are normalized by throughput, others are not. Legend for results is here.
ips	qps	rps	rmbps	wps	wmbps	rpq	rkbpq	wpi	wkbpi	csps	cpups	cspq	cpupq	dbgb1	dbgb2	rss	maxop	p50	p99	tag
4343	220229	0	0.0	411.9	12.8	0.000	0.000	0.095	3.018	830900	65.2	3.773	189	28.9	157.5	33.8	0.023	5066	5003	150m.my8031.cy8_128gram_64kiops
4343	183174	32	0.3	56.6	12.8	0.000	0.001	0.013	3.013	696301	66.3	3.801	232	12.2	13.6	45.6	0.124	4219	3885	150m.fbmy8028.cy9c_128gram_64kiops
4343	379577	0	0.0	1906.2	85.1	0.000	0.000	0.439	20.054	1414295	62.9	3.726	106	35.1	85.5	23.0	0.022	8679	8551	150m.pg151.cx7_128gram_64kiops
q500.1
q500.1: range queries with 500 insert/s per client
Performance metrics for all DBMS, not just the ones listed above. Some are normalized by throughput, others are not. Legend for results is here.
ips	qps	rps	rmbps	wps	wmbps	rpq	rkbpq	wpi	wkbpi	csps	cpups	cspq	cpupq	dbgb1	dbgb2	rss	maxop	p50	p99	tag
21710	215457	0	0.0	1006.7	42.1	0.000	0.000	0.046	1.987	814633	66.5	3.781	198	51.4	180.0	53.9	0.024	4971	4877	150m.my8031.cy8_128gram_64kiops
21716	172590	0	0.0	195.9	45.7	0.000	0.000	0.009	2.154	659890	68.1	3.823	253	17.8	19.8	82.6	0.039	3996	3676	150m.fbmy8028.cy9c_128gram_64kiops
21716	368892	0	0.0	1411.7	146.9	0.000	0.000	0.065	6.929	1379571	64.0	3.740	111	58.1	102.8	0.0	0.025	8439	8103	150m.pg151.cx7_128gram_64kiops
q1000.1
q1000.1: range queries with 1000 insert/s per client
Performance metrics for all DBMS, not just the ones listed above. Some are normalized by throughput, others are not. Legend for results is here.
ips	qps	rps	rmbps	wps	wmbps	rpq	rkbpq	wpi	wkbpi	csps	cpups	cspq	cpupq	dbgb1	dbgb2	rss	maxop	p50	p99	tag
43433	210453	0	0.0	1810.7	71.6	0.000	0.000	0.042	1.688	794004	67.6	3.773	206	76.5	205.1	77.0	0.026	4827	4731	150m.my8031.cy8_128gram_64kiops
43445	154735	0	0.0	386.0	87.5	0.000	0.000	0.009	2.062	594546	70.6	3.842	292	29.3	30.5	83.4	0.064	3580	3165	150m.fbmy8028.cy9c_128gram_64kiops
43373	360321	2	0.0	2152.1	258.5	0.000	0.000	0.050	6.104	1347131	64.5	3.739	115	80.4	157.3	0.0	0.428	8231	6201	150m.pg151.cx7_128gram_64kiops
l.i0
- l.i0: load without secondary indexes
- Legend for results is here.
- Each entry lists the percentage of responses that fit in that bucket (slower than max time for previous bucket, faster than min time for next bucket).
Insert response time histogram
256us	1ms	4ms	16ms	64ms	256ms	1s	4s	16s	gt	max	tag
0.000	11.756	87.868	0.275	0.051	0.050	0.000	0.000	0.000	0.000	0.106	my8031.cy8_128gram_64kiops
0.000	1.637	58.307	39.938	0.107	0.012	0.000	0.000	0.000	0.000	0.102	fbmy8028.cy9c_128gram_64kiops
0.000	53.405	46.538	0.021	0.037	0.000	0.000	0.000	0.000	0.000	0.041	pg151.cx7_128gram_64kiops
l.x
- l.x: create secondary indexes
- Legend for results is here.
- Each entry lists the percentage of responses that fit in that bucket (slower than max time for previous bucket, faster than min time for next bucket).
TODO - determine whether there is data for create index response time
l.i1
- l.i1: continue load after secondary indexes created
- Legend for results is here.
- Each entry lists the percentage of responses that fit in that bucket (slower than max time for previous bucket, faster than min time for next bucket).
Insert response time histogram
256us	1ms	4ms	16ms	64ms	256ms	1s	4s	16s	gt	max	tag
0.000	0.056	98.632	0.928	0.223	0.161	nonzero	0.000	0.000	0.000	0.267	my8031.cy8_128gram_64kiops
0.000	0.240	9.060	90.627	0.073	nonzero	0.000	0.000	0.000	0.000	0.065	fbmy8028.cy9c_128gram_64kiops
0.000	7.326	91.830	0.376	0.467	0.000	0.000	0.000	0.000	0.000	0.057	pg151.cx7_128gram_64kiops
q100.1
- q100.1: range queries with 100 insert/s per client
- Legend for results is here.
- Each entry lists the percentage of responses that fit in that bucket (slower than max time for previous bucket, faster than min time for next bucket).
Query response time histogram
256us	1ms	4ms	16ms	64ms	256ms	1s	4s	16s	gt	max	tag
94.590	5.402	0.008	nonzero	nonzero	0.000	0.000	0.000	0.000	0.000	0.023	my8031.cy8_128gram_64kiops
87.744	12.245	0.011	nonzero	nonzero	nonzero	0.000	0.000	0.000	0.000	0.124	fbmy8028.cy9c_128gram_64kiops
99.937	0.059	0.004	nonzero	nonzero	0.000	0.000	0.000	0.000	0.000	0.022	pg151.cx7_128gram_64kiops
Insert response time histogram
256us	1ms	4ms	16ms	64ms	256ms	1s	4s	16s	gt	max	tag
0.000	0.000	98.962	1.038	0.000	0.000	0.000	0.000	0.000	0.000	0.013	my8031.cy8_128gram_64kiops
0.000	0.064	97.648	2.288	0.000	0.000	0.000	0.000	0.000	0.000	0.013	fbmy8028.cy9c_128gram_64kiops
0.000	nonzero	93.253	5.787	0.959	0.001	0.000	0.000	0.000	0.000	0.072	pg151.cx7_128gram_64kiops
q500.1
- q500.1: range queries with 500 insert/s per client
- Legend for results is here.
- Each entry lists the percentage of responses that fit in that bucket (slower than max time for previous bucket, faster than min time for next bucket).
Query response time histogram
256us	1ms	4ms	16ms	64ms	256ms	1s	4s	16s	gt	max	tag
93.886	6.072	0.039	0.002	nonzero	0.000	0.000	0.000	0.000	0.000	0.024	my8031.cy8_128gram_64kiops
77.648	22.301	0.050	0.001	nonzero	0.000	0.000	0.000	0.000	0.000	0.039	fbmy8028.cy9c_128gram_64kiops
99.761	0.215	0.022	0.002	nonzero	0.000	0.000	0.000	0.000	0.000	0.025	pg151.cx7_128gram_64kiops
Insert response time histogram
256us	1ms	4ms	16ms	64ms	256ms	1s	4s	16s	gt	max	tag
0.000	0.000	80.167	19.810	0.023	0.000	0.000	0.000	0.000	0.000	0.030	my8031.cy8_128gram_64kiops
0.000	0.004	5.233	93.119	1.644	0.000	0.000	0.000	0.000	0.000	0.041	fbmy8028.cy9c_128gram_64kiops
0.000	0.000	58.895	33.388	7.680	0.038	0.000	0.000	0.000	0.000	0.101	pg151.cx7_128gram_64kiops
q1000.1
- q1000.1: range queries with 1000 insert/s per client
- Legend for results is here.
- Each entry lists the percentage of responses that fit in that bucket (slower than max time for previous bucket, faster than min time for next bucket).
Query response time histogram
256us	1ms	4ms	16ms	64ms	256ms	1s	4s	16s	gt	max	tag
93.128	6.818	0.052	0.002	nonzero	0.000	0.000	0.000	0.000	0.000	0.026	my8031.cy8_128gram_64kiops
47.274	52.617	0.107	0.002	nonzero	nonzero	0.000	0.000	0.000	0.000	0.064	fbmy8028.cy9c_128gram_64kiops
99.649	0.303	0.036	0.009	0.003	nonzero	nonzero	0.000	0.000	0.000	0.428	pg151.cx7_128gram_64kiops
Insert response time histogram
256us	1ms	4ms	16ms	64ms	256ms	1s	4s	16s	gt	max	tag
0.000	0.000	84.231	15.706	0.063	0.000	0.000	0.000	0.000	0.000	0.044	my8031.cy8_128gram_64kiops
0.000	0.008	12.817	84.603	2.573	0.000	0.000	0.000	0.000	0.000	0.059	fbmy8028.cy9c_128gram_64kiops
0.000	0.010	70.840	21.838	6.609	0.700	0.003	0.000	0.000	0.000	0.526	pg151.cx7_128gram_64kiops