Introduction
This is a report for the insert benchmark with 150M docs and 22 client(s). It is generated by scripts (bash, awk, sed) and Tufte might not be impressed. An overview of the insert benchmark is here and a short update is here. Below, by DBMS, I mean DBMS+version.config. An example is my8020.c10b40 where my means MySQL, 8020 is version 8.0.20 and c10b40 is the name for the configuration file.
The test server is an c6i.16xl with 32 cores, 64 HW threads (hyperthread enabled), 128G RAM and io2 storage (5T, 64K IOPs). The benchmark was run with 22 clients and there was 1 or 2 connections per client (1 for queries, 1 for inserts). The benchmark loads 100M rows without secondary indexes, creates secondary indexes, loads another 50M rows then does 3 read+write tests for one hour each that do queries as fast as possible with 100, 500 and then 1000 writes/second/client concurrent with the queries. The database is cached by the storage engine and the only IO is for writes. Clients and the DBMS share one server. The per-database configs are in the per-database subdirectories here.
The tested DBMS are:
- my8031.cy8_128gram_64kiops - MySQL 8.0.31 with InnoDB and the cy8_128gram_64kiops config
- fbmy8028.cy9c_128gram_64kiops - FB MySQL 8.0.28 with MyRocks and the cy9c_128gram_64kiops config
- pg151.cx7_128gram_64kiops - Postgres 15.1 and the cx7_128gram_64kiops config
Contents
- Summary
- l.i0: load without secondary indexes
- l.x: create secondary indexes
- l.i1: continue load after secondary indexes created
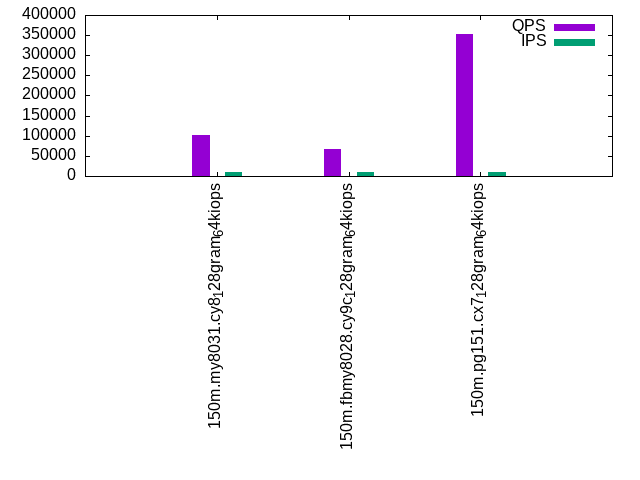
- q100.1: range queries with 100 insert/s per client
- q500.1: range queries with 500 insert/s per client
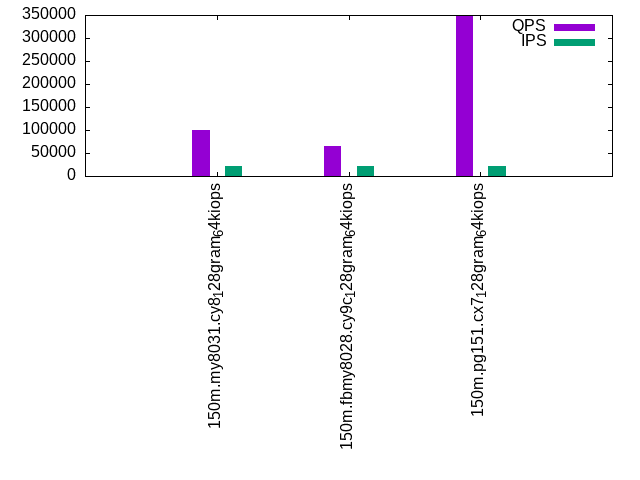
- q1000.1: range queries with 1000 insert/s per client
Summary
The numbers are inserts/s for l.i0 and l.i1, indexed docs (or rows) /s for l.x and queries/s for q*.2. The values are the average rate over the entire test for inserts (IPS) and queries (QPS). The range of values for IPS and QPS is split into 3 parts: bottom 25%, middle 50%, top 25%. Values in the bottom 25% have a red background, values in the top 25% have a green background and values in the middle have no color. A gray background is used for values that can be ignored because the DBMS did not sustain the target insert rate. Red backgrounds are not used when the minimum value is within 80% of the max value.
| dbms | l.i0 | l.x | l.i1 | q100.1 | q500.1 | q1000.1 |
|---|---|---|---|---|---|---|
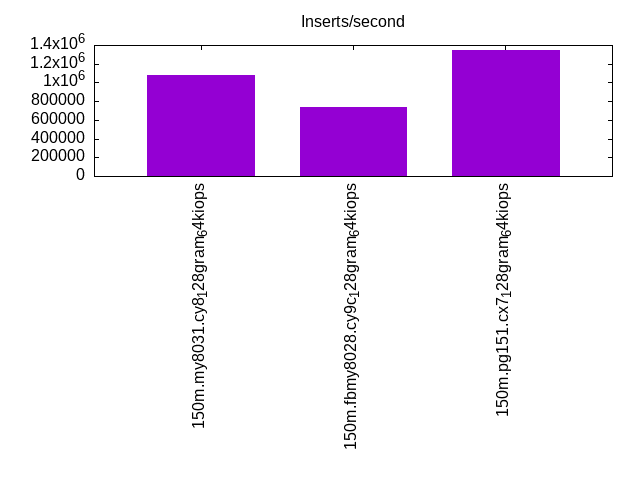
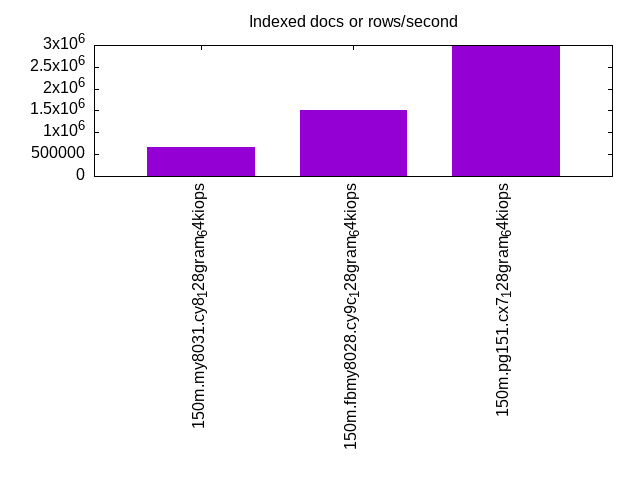
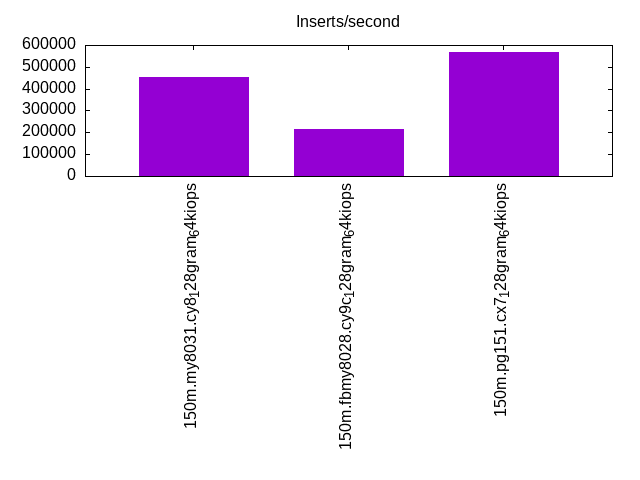
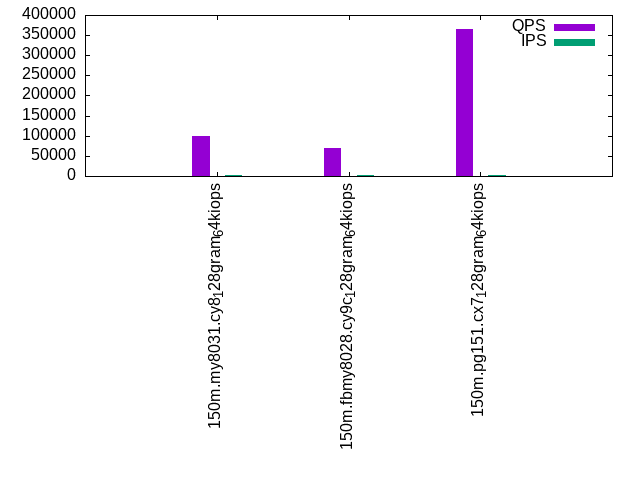
| 150m.my8031.cy8_128gram_64kiops | 1081006 | 668520 | 451972 | 98973 | 101466 | 101083 |
| 150m.fbmy8028.cy9c_128gram_64kiops | 738434 | 1521125 | 217547 | 70300 | 67980 | 65494 |
| 150m.pg151.cx7_128gram_64kiops | 1344328 | 2998788 | 569878 | 365228 | 351809 | 348034 |
This lists the average rate of inserts/s for the tests that do inserts concurrent with queries. For such tests the query rate is listed in the table above. The read+write tests are setup so that the insert rate should match the target rate every second. Cells that are not at least 95% of the target have a red background to indicate a failure to satisfy the target.
| dbms | q100.1 | q500.1 | q1000.1 |
|---|---|---|---|
| my8031.cy8_128gram_64kiops | 2185 | 10924 | 21842 |
| fbmy8028.cy9c_128gram_64kiops | 2184 | 10924 | 21854 |
| pg151.cx7_128gram_64kiops | 2185 | 10927 | 21848 |
| target | 2200 | 11000 | 22000 |
l.i0
l.i0: load without secondary indexes. Graphs for performance per 1-second interval are here.
Average throughput:
Insert response time histogram: each cell has the percentage of responses that take <= the time in the header and max is the max response time in seconds. For the max column values in the top 25% of the range have a red background and in the bottom 25% of the range have a green background. The red background is not used when the min value is within 80% of the max value.
| dbms | 256us | 1ms | 4ms | 16ms | 64ms | 256ms | 1s | 4s | 16s | gt | max |
|---|---|---|---|---|---|---|---|---|---|---|---|
| my8031.cy8_128gram_64kiops | 18.602 | 81.122 | 0.200 | 0.028 | 0.048 | 0.113 | |||||
| fbmy8028.cy9c_128gram_64kiops | 1.814 | 96.723 | 1.391 | 0.067 | 0.005 | 0.075 | |||||
| pg151.cx7_128gram_64kiops | 56.722 | 43.101 | 0.064 | 0.113 | 0.040 |
Performance metrics for the DBMS listed above. Some are normalized by throughput, others are not. Legend for results is here.
ips	qps	rps	rmbps	wps	wmbps	rpq	rkbpq	wpi	wkbpi	csps	cpups	cspq	cpupq	dbgb1	dbgb2	rss	maxop	p50	p99	tag
1081006	0	0	0.0	1692.7	282.6	0.000	0.000	0.002	0.268	166025	35.0	0.154	21	7.0	135.6	14.6	0.113	70225	11188	150m.my8031.cy8_128gram_64kiops
738434	0	0	0.0	1199.0	273.0	0.000	0.000	0.002	0.379	168545	31.3	0.228	27	5.1	5.7	1.6	0.075	40157	8391	150m.fbmy8028.cy9c_128gram_64kiops
1344328	0	0	0.0	2387.9	555.3	0.000	0.000	0.002	0.423	153773	35.1	0.114	17	10.0	27.1	10.1	0.040	109644	54242	150m.pg151.cx7_128gram_64kiops
l.x
l.x: create secondary indexes.
Average throughput:
Performance metrics for the DBMS listed above. Some are normalized by throughput, others are not. Legend for results is here.
ips	qps	rps	rmbps	wps	wmbps	rpq	rkbpq	wpi	wkbpi	csps	cpups	cspq	cpupq	dbgb1	dbgb2	rss	maxop	p50	p99	tag
668520	0	3746	239.6	13139.3	615.8	0.006	0.367	0.020	0.943	132750	18.3	0.199	18	15.6	144.1	19.1	0.004	NA	NA	150m.my8031.cy8_128gram_64kiops
1521125	0	4	0.3	1188.6	269.2	0.000	0.000	0.001	0.181	8882	24.7	0.006	10	7.2	7.7	8.6	0.005	NA	NA	150m.fbmy8028.cy9c_128gram_64kiops
2998788	0	0	0.0	3417.6	829.2	0.000	0.000	0.001	0.283	49566	12.5	0.017	3	19.3	44.8	5.0	0.100	NA	NA	150m.pg151.cx7_128gram_64kiops
l.i1
l.i1: continue load after secondary indexes created. Graphs for performance per 1-second interval are here.
Average throughput:
Insert response time histogram: each cell has the percentage of responses that take <= the time in the header and max is the max response time in seconds. For the max column values in the top 25% of the range have a red background and in the bottom 25% of the range have a green background. The red background is not used when the min value is within 80% of the max value.
| dbms | 256us | 1ms | 4ms | 16ms | 64ms | 256ms | 1s | 4s | 16s | gt | max |
|---|---|---|---|---|---|---|---|---|---|---|---|
| my8031.cy8_128gram_64kiops | nonzero | 99.245 | 0.387 | 0.224 | 0.144 | 0.228 | |||||
| fbmy8028.cy9c_128gram_64kiops | 0.229 | 25.260 | 74.471 | 0.038 | 0.002 | 0.115 | |||||
| pg151.cx7_128gram_64kiops | 4.669 | 94.753 | 0.296 | 0.283 | 0.042 |
Performance metrics for the DBMS listed above. Some are normalized by throughput, others are not. Legend for results is here.
ips	qps	rps	rmbps	wps	wmbps	rpq	rkbpq	wpi	wkbpi	csps	cpups	cspq	cpupq	dbgb1	dbgb2	rss	maxop	p50	p99	tag
451972	0	4141	64.7	3105.9	355.6	0.009	0.147	0.007	0.806	148197	31.6	0.328	45	27.7	156.3	32.8	0.228	27271	250	150m.my8031.cy8_128gram_64kiops
217547	0	132	16.3	1206.8	278.0	0.001	0.077	0.006	1.308	72361	18.9	0.333	56	12.8	14.0	10.4	0.115	10340	8747	150m.fbmy8028.cy9c_128gram_64kiops
569878	0	0	0.0	2898.0	682.4	0.000	0.000	0.005	1.226	202873	31.7	0.356	36	33.6	82.3	0.0	0.042	35062	20078	150m.pg151.cx7_128gram_64kiops
q100.1
q100.1: range queries with 100 insert/s per client. Graphs for performance per 1-second interval are here.
Average throughput:
Query response time histogram: each cell has the percentage of responses that take <= the time in the header and max is the max response time in seconds. For max values in the top 25% of the range have a red background and in the bottom 25% of the range have a green background. The red background is not used when the min value is within 80% of the max value.
| dbms | 256us | 1ms | 4ms | 16ms | 64ms | 256ms | 1s | 4s | 16s | gt | max |
|---|---|---|---|---|---|---|---|---|---|---|---|
| my8031.cy8_128gram_64kiops | 81.074 | 18.622 | 0.304 | nonzero | 0.010 | ||||||
| fbmy8028.cy9c_128gram_64kiops | 69.898 | 29.501 | 0.601 | nonzero | nonzero | 0.026 | |||||
| pg151.cx7_128gram_64kiops | 99.977 | 0.023 | nonzero | nonzero | nonzero | 0.021 |
Insert response time histogram: each cell has the percentage of responses that take <= the time in the header and max is the max response time in seconds. For max values in the top 25% of the range have a red background and in the bottom 25% of the range have a green background. The red background is not used when the min value is within 80% of the max value.
| dbms | 256us | 1ms | 4ms | 16ms | 64ms | 256ms | 1s | 4s | 16s | gt | max |
|---|---|---|---|---|---|---|---|---|---|---|---|
| my8031.cy8_128gram_64kiops | 99.905 | 0.095 | 0.011 | ||||||||
| fbmy8028.cy9c_128gram_64kiops | 3.183 | 96.302 | 0.515 | 0.015 | |||||||
| pg151.cx7_128gram_64kiops | 98.445 | 1.151 | 0.404 | 0.026 |
Performance metrics for the DBMS listed above. Some are normalized by throughput, others are not. Legend for results is here.
ips	qps	rps	rmbps	wps	wmbps	rpq	rkbpq	wpi	wkbpi	csps	cpups	cspq	cpupq	dbgb1	dbgb2	rss	maxop	p50	p99	tag
2185	98973	0	0.0	401.6	11.7	0.000	0.000	0.184	5.486	380597	29.4	3.845	190	28.2	156.8	33.3	0.010	4459	2431	150m.my8031.cy8_128gram_64kiops
2184	70300	0	0.0	30.7	6.5	0.000	0.000	0.014	3.055	270124	29.6	3.842	269	11.5	11.8	31.3	0.026	3100	1981	150m.fbmy8028.cy9c_128gram_64kiops
2185	365228	0	0.0	1896.2	61.4	0.000	0.000	0.868	28.797	1395872	32.6	3.822	57	34.3	79.9	0.0	0.021	16701	14176	150m.pg151.cx7_128gram_64kiops
q500.1
q500.1: range queries with 500 insert/s per client. Graphs for performance per 1-second interval are here.
Average throughput:
Query response time histogram: each cell has the percentage of responses that take <= the time in the header and max is the max response time in seconds. For max values in the top 25% of the range have a red background and in the bottom 25% of the range have a green background. The red background is not used when the min value is within 80% of the max value.
| dbms | 256us | 1ms | 4ms | 16ms | 64ms | 256ms | 1s | 4s | 16s | gt | max |
|---|---|---|---|---|---|---|---|---|---|---|---|
| my8031.cy8_128gram_64kiops | 82.243 | 17.480 | 0.276 | nonzero | nonzero | 0.119 | |||||
| fbmy8028.cy9c_128gram_64kiops | 68.567 | 30.703 | 0.730 | nonzero | nonzero | 0.017 | |||||
| pg151.cx7_128gram_64kiops | 99.974 | 0.025 | 0.001 | nonzero | 0.012 |
Insert response time histogram: each cell has the percentage of responses that take <= the time in the header and max is the max response time in seconds. For max values in the top 25% of the range have a red background and in the bottom 25% of the range have a green background. The red background is not used when the min value is within 80% of the max value.
| dbms | 256us | 1ms | 4ms | 16ms | 64ms | 256ms | 1s | 4s | 16s | gt | max |
|---|---|---|---|---|---|---|---|---|---|---|---|
| my8031.cy8_128gram_64kiops | 99.644 | 0.355 | nonzero | nonzero | 0.121 | ||||||
| fbmy8028.cy9c_128gram_64kiops | 0.433 | 33.963 | 65.591 | 0.013 | 0.023 | ||||||
| pg151.cx7_128gram_64kiops | 0.119 | 74.440 | 24.295 | 1.146 | 0.031 |
Performance metrics for the DBMS listed above. Some are normalized by throughput, others are not. Legend for results is here.
ips	qps	rps	rmbps	wps	wmbps	rpq	rkbpq	wpi	wkbpi	csps	cpups	cspq	cpupq	dbgb1	dbgb2	rss	maxop	p50	p99	tag
10924	101466	0	0.0	410.1	17.7	0.000	0.000	0.038	1.657	392680	30.4	3.870	192	37.5	166.0	41.7	0.119	4619	2605	150m.my8031.cy8_128gram_64kiops
10924	67980	0	0.0	96.2	22.4	0.000	0.000	0.009	2.100	264327	30.5	3.888	287	14.5	15.9	77.1	0.017	3006	1982	150m.fbmy8028.cy9c_128gram_64kiops
10927	351809	0	0.0	1530.2	108.6	0.000	0.000	0.140	10.179	1350768	33.3	3.839	61	39.4	74.6	0.0	0.012	15999	13697	150m.pg151.cx7_128gram_64kiops
q1000.1
q1000.1: range queries with 1000 insert/s per client. Graphs for performance per 1-second interval are here.
Average throughput:
Query response time histogram: each cell has the percentage of responses that take <= the time in the header and max is the max response time in seconds. For max values in the top 25% of the range have a red background and in the bottom 25% of the range have a green background. The red background is not used when the min value is within 80% of the max value.
| dbms | 256us | 1ms | 4ms | 16ms | 64ms | 256ms | 1s | 4s | 16s | gt | max |
|---|---|---|---|---|---|---|---|---|---|---|---|
| my8031.cy8_128gram_64kiops | 82.498 | 17.234 | 0.267 | nonzero | 0.011 | ||||||
| fbmy8028.cy9c_128gram_64kiops | 67.125 | 31.925 | 0.950 | nonzero | nonzero | 0.031 | |||||
| pg151.cx7_128gram_64kiops | 99.966 | 0.031 | 0.002 | 0.001 | 0.015 |
Insert response time histogram: each cell has the percentage of responses that take <= the time in the header and max is the max response time in seconds. For max values in the top 25% of the range have a red background and in the bottom 25% of the range have a green background. The red background is not used when the min value is within 80% of the max value.
| dbms | 256us | 1ms | 4ms | 16ms | 64ms | 256ms | 1s | 4s | 16s | gt | max |
|---|---|---|---|---|---|---|---|---|---|---|---|
| my8031.cy8_128gram_64kiops | 99.658 | 0.323 | 0.019 | 0.024 | |||||||
| fbmy8028.cy9c_128gram_64kiops | 0.019 | 13.804 | 86.141 | 0.036 | 0.039 | ||||||
| pg151.cx7_128gram_64kiops | 0.019 | 81.264 | 17.682 | 1.035 | 0.036 |
Performance metrics for the DBMS listed above. Some are normalized by throughput, others are not. Legend for results is here.
ips	qps	rps	rmbps	wps	wmbps	rpq	rkbpq	wpi	wkbpi	csps	cpups	cspq	cpupq	dbgb1	dbgb2	rss	maxop	p50	p99	tag
21842	101083	0	0.0	1075.0	41.8	0.000	0.000	0.049	1.959	396567	31.3	3.923	198	53.5	182.1	56.2	0.011	4587	2653	150m.my8031.cy8_128gram_64kiops
21854	65494	0	0.0	199.7	45.9	0.000	0.000	0.009	2.149	259136	31.5	3.957	308	19.9	21.4	82.8	0.031	2926	1966	150m.fbmy8028.cy9c_128gram_64kiops
21848	348034	0	0.0	2000.2	176.4	0.000	0.000	0.092	8.269	1341226	34.2	3.854	63	63.8	112.4	0.0	0.015	15812	13585	150m.pg151.cx7_128gram_64kiops
l.i0
l.i0: load without secondary indexes
Performance metrics for all DBMS, not just the ones listed above. Some are normalized by throughput, others are not. Legend for results is here.
ips	qps	rps	rmbps	wps	wmbps	rpq	rkbpq	wpi	wkbpi	csps	cpups	cspq	cpupq	dbgb1	dbgb2	rss	maxop	p50	p99	tag
1081006	0	0	0.0	1692.7	282.6	0.000	0.000	0.002	0.268	166025	35.0	0.154	21	7.0	135.6	14.6	0.113	70225	11188	150m.my8031.cy8_128gram_64kiops
738434	0	0	0.0	1199.0	273.0	0.000	0.000	0.002	0.379	168545	31.3	0.228	27	5.1	5.7	1.6	0.075	40157	8391	150m.fbmy8028.cy9c_128gram_64kiops
1344328	0	0	0.0	2387.9	555.3	0.000	0.000	0.002	0.423	153773	35.1	0.114	17	10.0	27.1	10.1	0.040	109644	54242	150m.pg151.cx7_128gram_64kiops
l.x
l.x: create secondary indexes
Performance metrics for all DBMS, not just the ones listed above. Some are normalized by throughput, others are not. Legend for results is here.
ips	qps	rps	rmbps	wps	wmbps	rpq	rkbpq	wpi	wkbpi	csps	cpups	cspq	cpupq	dbgb1	dbgb2	rss	maxop	p50	p99	tag
668520	0	3746	239.6	13139.3	615.8	0.006	0.367	0.020	0.943	132750	18.3	0.199	18	15.6	144.1	19.1	0.004	NA	NA	150m.my8031.cy8_128gram_64kiops
1521125	0	4	0.3	1188.6	269.2	0.000	0.000	0.001	0.181	8882	24.7	0.006	10	7.2	7.7	8.6	0.005	NA	NA	150m.fbmy8028.cy9c_128gram_64kiops
2998788	0	0	0.0	3417.6	829.2	0.000	0.000	0.001	0.283	49566	12.5	0.017	3	19.3	44.8	5.0	0.100	NA	NA	150m.pg151.cx7_128gram_64kiops
l.i1
l.i1: continue load after secondary indexes created
Performance metrics for all DBMS, not just the ones listed above. Some are normalized by throughput, others are not. Legend for results is here.
ips	qps	rps	rmbps	wps	wmbps	rpq	rkbpq	wpi	wkbpi	csps	cpups	cspq	cpupq	dbgb1	dbgb2	rss	maxop	p50	p99	tag
451972	0	4141	64.7	3105.9	355.6	0.009	0.147	0.007	0.806	148197	31.6	0.328	45	27.7	156.3	32.8	0.228	27271	250	150m.my8031.cy8_128gram_64kiops
217547	0	132	16.3	1206.8	278.0	0.001	0.077	0.006	1.308	72361	18.9	0.333	56	12.8	14.0	10.4	0.115	10340	8747	150m.fbmy8028.cy9c_128gram_64kiops
569878	0	0	0.0	2898.0	682.4	0.000	0.000	0.005	1.226	202873	31.7	0.356	36	33.6	82.3	0.0	0.042	35062	20078	150m.pg151.cx7_128gram_64kiops
q100.1
q100.1: range queries with 100 insert/s per client
Performance metrics for all DBMS, not just the ones listed above. Some are normalized by throughput, others are not. Legend for results is here.
ips	qps	rps	rmbps	wps	wmbps	rpq	rkbpq	wpi	wkbpi	csps	cpups	cspq	cpupq	dbgb1	dbgb2	rss	maxop	p50	p99	tag
2185	98973	0	0.0	401.6	11.7	0.000	0.000	0.184	5.486	380597	29.4	3.845	190	28.2	156.8	33.3	0.010	4459	2431	150m.my8031.cy8_128gram_64kiops
2184	70300	0	0.0	30.7	6.5	0.000	0.000	0.014	3.055	270124	29.6	3.842	269	11.5	11.8	31.3	0.026	3100	1981	150m.fbmy8028.cy9c_128gram_64kiops
2185	365228	0	0.0	1896.2	61.4	0.000	0.000	0.868	28.797	1395872	32.6	3.822	57	34.3	79.9	0.0	0.021	16701	14176	150m.pg151.cx7_128gram_64kiops
q500.1
q500.1: range queries with 500 insert/s per client
Performance metrics for all DBMS, not just the ones listed above. Some are normalized by throughput, others are not. Legend for results is here.
ips	qps	rps	rmbps	wps	wmbps	rpq	rkbpq	wpi	wkbpi	csps	cpups	cspq	cpupq	dbgb1	dbgb2	rss	maxop	p50	p99	tag
10924	101466	0	0.0	410.1	17.7	0.000	0.000	0.038	1.657	392680	30.4	3.870	192	37.5	166.0	41.7	0.119	4619	2605	150m.my8031.cy8_128gram_64kiops
10924	67980	0	0.0	96.2	22.4	0.000	0.000	0.009	2.100	264327	30.5	3.888	287	14.5	15.9	77.1	0.017	3006	1982	150m.fbmy8028.cy9c_128gram_64kiops
10927	351809	0	0.0	1530.2	108.6	0.000	0.000	0.140	10.179	1350768	33.3	3.839	61	39.4	74.6	0.0	0.012	15999	13697	150m.pg151.cx7_128gram_64kiops
q1000.1
q1000.1: range queries with 1000 insert/s per client
Performance metrics for all DBMS, not just the ones listed above. Some are normalized by throughput, others are not. Legend for results is here.
ips	qps	rps	rmbps	wps	wmbps	rpq	rkbpq	wpi	wkbpi	csps	cpups	cspq	cpupq	dbgb1	dbgb2	rss	maxop	p50	p99	tag
21842	101083	0	0.0	1075.0	41.8	0.000	0.000	0.049	1.959	396567	31.3	3.923	198	53.5	182.1	56.2	0.011	4587	2653	150m.my8031.cy8_128gram_64kiops
21854	65494	0	0.0	199.7	45.9	0.000	0.000	0.009	2.149	259136	31.5	3.957	308	19.9	21.4	82.8	0.031	2926	1966	150m.fbmy8028.cy9c_128gram_64kiops
21848	348034	0	0.0	2000.2	176.4	0.000	0.000	0.092	8.269	1341226	34.2	3.854	63	63.8	112.4	0.0	0.015	15812	13585	150m.pg151.cx7_128gram_64kiops
l.i0
- l.i0: load without secondary indexes
- Legend for results is here.
- Each entry lists the percentage of responses that fit in that bucket (slower than max time for previous bucket, faster than min time for next bucket).
Insert response time histogram
256us	1ms	4ms	16ms	64ms	256ms	1s	4s	16s	gt	max	tag
0.000	18.602	81.122	0.200	0.028	0.048	0.000	0.000	0.000	0.000	0.113	my8031.cy8_128gram_64kiops
0.000	1.814	96.723	1.391	0.067	0.005	0.000	0.000	0.000	0.000	0.075	fbmy8028.cy9c_128gram_64kiops
0.000	56.722	43.101	0.064	0.113	0.000	0.000	0.000	0.000	0.000	0.040	pg151.cx7_128gram_64kiops
l.x
- l.x: create secondary indexes
- Legend for results is here.
- Each entry lists the percentage of responses that fit in that bucket (slower than max time for previous bucket, faster than min time for next bucket).
TODO - determine whether there is data for create index response time
l.i1
- l.i1: continue load after secondary indexes created
- Legend for results is here.
- Each entry lists the percentage of responses that fit in that bucket (slower than max time for previous bucket, faster than min time for next bucket).
Insert response time histogram
256us	1ms	4ms	16ms	64ms	256ms	1s	4s	16s	gt	max	tag
0.000	nonzero	99.245	0.387	0.224	0.144	0.000	0.000	0.000	0.000	0.228	my8031.cy8_128gram_64kiops
0.000	0.229	25.260	74.471	0.038	0.002	0.000	0.000	0.000	0.000	0.115	fbmy8028.cy9c_128gram_64kiops
0.000	4.669	94.753	0.296	0.283	0.000	0.000	0.000	0.000	0.000	0.042	pg151.cx7_128gram_64kiops
q100.1
- q100.1: range queries with 100 insert/s per client
- Legend for results is here.
- Each entry lists the percentage of responses that fit in that bucket (slower than max time for previous bucket, faster than min time for next bucket).
Query response time histogram
256us	1ms	4ms	16ms	64ms	256ms	1s	4s	16s	gt	max	tag
81.074	18.622	0.304	nonzero	0.000	0.000	0.000	0.000	0.000	0.000	0.010	my8031.cy8_128gram_64kiops
69.898	29.501	0.601	nonzero	nonzero	0.000	0.000	0.000	0.000	0.000	0.026	fbmy8028.cy9c_128gram_64kiops
99.977	0.023	nonzero	nonzero	nonzero	0.000	0.000	0.000	0.000	0.000	0.021	pg151.cx7_128gram_64kiops
Insert response time histogram
256us	1ms	4ms	16ms	64ms	256ms	1s	4s	16s	gt	max	tag
0.000	0.000	99.905	0.095	0.000	0.000	0.000	0.000	0.000	0.000	0.011	my8031.cy8_128gram_64kiops
0.000	3.183	96.302	0.515	0.000	0.000	0.000	0.000	0.000	0.000	0.015	fbmy8028.cy9c_128gram_64kiops
0.000	0.000	98.445	1.151	0.404	0.000	0.000	0.000	0.000	0.000	0.026	pg151.cx7_128gram_64kiops
q500.1
- q500.1: range queries with 500 insert/s per client
- Legend for results is here.
- Each entry lists the percentage of responses that fit in that bucket (slower than max time for previous bucket, faster than min time for next bucket).
Query response time histogram
256us	1ms	4ms	16ms	64ms	256ms	1s	4s	16s	gt	max	tag
82.243	17.480	0.276	nonzero	0.000	nonzero	0.000	0.000	0.000	0.000	0.119	my8031.cy8_128gram_64kiops
68.567	30.703	0.730	nonzero	nonzero	0.000	0.000	0.000	0.000	0.000	0.017	fbmy8028.cy9c_128gram_64kiops
99.974	0.025	0.001	nonzero	0.000	0.000	0.000	0.000	0.000	0.000	0.012	pg151.cx7_128gram_64kiops
Insert response time histogram
256us	1ms	4ms	16ms	64ms	256ms	1s	4s	16s	gt	max	tag
0.000	0.000	99.644	0.355	nonzero	nonzero	0.000	0.000	0.000	0.000	0.121	my8031.cy8_128gram_64kiops
0.000	0.433	33.963	65.591	0.013	0.000	0.000	0.000	0.000	0.000	0.023	fbmy8028.cy9c_128gram_64kiops
0.000	0.119	74.440	24.295	1.146	0.000	0.000	0.000	0.000	0.000	0.031	pg151.cx7_128gram_64kiops
q1000.1
- q1000.1: range queries with 1000 insert/s per client
- Legend for results is here.
- Each entry lists the percentage of responses that fit in that bucket (slower than max time for previous bucket, faster than min time for next bucket).
Query response time histogram
256us	1ms	4ms	16ms	64ms	256ms	1s	4s	16s	gt	max	tag
82.498	17.234	0.267	nonzero	0.000	0.000	0.000	0.000	0.000	0.000	0.011	my8031.cy8_128gram_64kiops
67.125	31.925	0.950	nonzero	nonzero	0.000	0.000	0.000	0.000	0.000	0.031	fbmy8028.cy9c_128gram_64kiops
99.966	0.031	0.002	0.001	0.000	0.000	0.000	0.000	0.000	0.000	0.015	pg151.cx7_128gram_64kiops
Insert response time histogram
256us	1ms	4ms	16ms	64ms	256ms	1s	4s	16s	gt	max	tag
0.000	0.000	99.658	0.323	0.019	0.000	0.000	0.000	0.000	0.000	0.024	my8031.cy8_128gram_64kiops
0.000	0.019	13.804	86.141	0.036	0.000	0.000	0.000	0.000	0.000	0.039	fbmy8028.cy9c_128gram_64kiops
0.000	0.019	81.264	17.682	1.035	0.000	0.000	0.000	0.000	0.000	0.036	pg151.cx7_128gram_64kiops