Introduction
This is a report for the insert benchmark with 150M docs and 44 client(s). It is generated by scripts (bash, awk, sed) and Tufte might not be impressed. An overview of the insert benchmark is here and a short update is here. Below, by DBMS, I mean DBMS+version.config. An example is my8020.c10b40 where my means MySQL, 8020 is version 8.0.20 and c10b40 is the name for the configuration file.
The test server is an c6i.16xl with 32 cores, 64 HW threads (hyperthread disabled), 128G RAM and io2 storage (5T, 64K IOPs). The benchmark was run with 44 clients and there was 1 or 2 connections per client (1 for queries, 1 for inserts). The benchmark loads 100M rows without secondary indexes, creates secondary indexes, loads another 50M rows then does 3 read+write tests for one hour each that do queries as fast as possible with 100, 500 and then 1000 writes/second/client concurrent with the queries. The database is cached by the storage engine and the only IO is for writes. Clients and the DBMS share one server. The per-database configs are in the per-database subdirectories here.
The tested DBMS are:
- my8031.cy8_128gram_64kiops - MySQL 8.0.31 with InnoDB and the cy8_128gram_64kiops config
- fbmy8028.cy9c_128gram_64kiops - FB MySQL 8.0.28 with MyRocks and the cy9c_128gram_64kiops config
- pg151.cx7_128gram_64kiops - Postgres 15.1 and the cx7_128gram_64kiops config, uses prepared statements for queries
- pg151.cx7_128gram_64kiops_noprep - Postgres 15.1 and the cx7_128gram_64kiops config, does not use prepared statements
Contents
- Summary
- l.i0: load without secondary indexes
- l.x: create secondary indexes
- l.i1: continue load after secondary indexes created
- q100.1: range queries with 100 insert/s per client
- q500.1: range queries with 500 insert/s per client
- q1000.1: range queries with 1000 insert/s per client
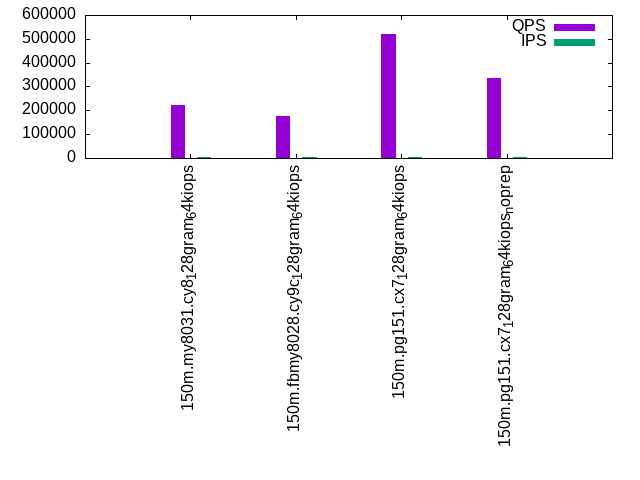
Summary
The numbers are inserts/s for l.i0 and l.i1, indexed docs (or rows) /s for l.x and queries/s for q*.2. The values are the average rate over the entire test for inserts (IPS) and queries (QPS). The range of values for IPS and QPS is split into 3 parts: bottom 25%, middle 50%, top 25%. Values in the bottom 25% have a red background, values in the top 25% have a green background and values in the middle have no color. A gray background is used for values that can be ignored because the DBMS did not sustain the target insert rate. Red backgrounds are not used when the minimum value is within 80% of the max value.
| dbms | l.i0 | l.x | l.i1 | q100.1 | q500.1 | q1000.1 |
|---|---|---|---|---|---|---|
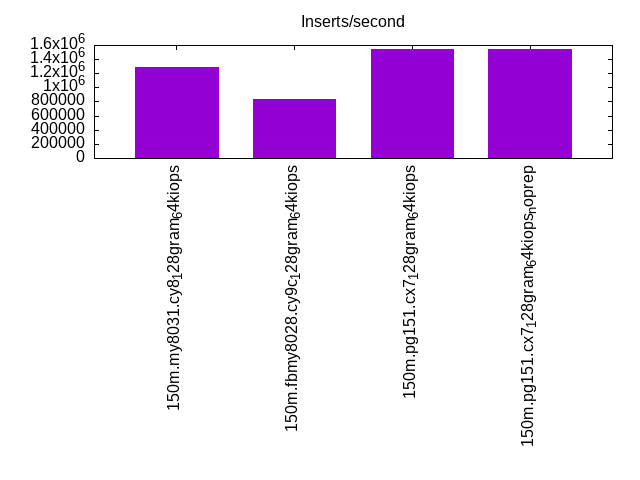
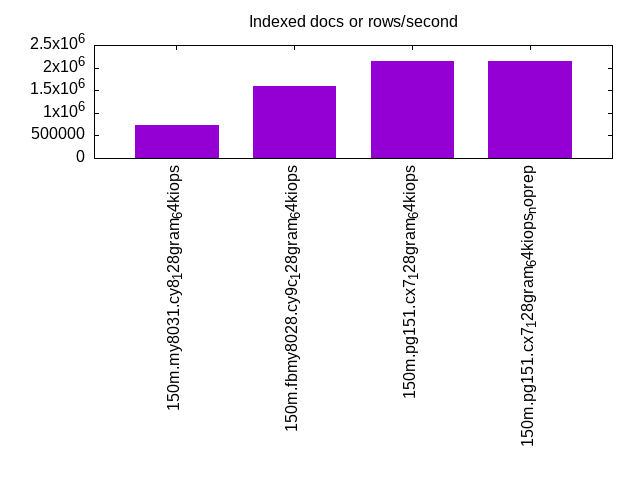
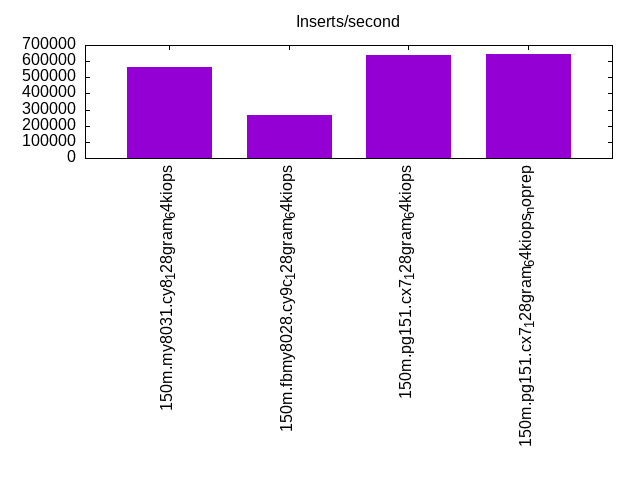
| 150m.my8031.cy8_128gram_64kiops | 1294538 | 739138 | 563750 | 223653 | 217569 | 208874 |
| 150m.fbmy8028.cy9c_128gram_64kiops | 838861 | 1590267 | 267494 | 177033 | 164464 | 142574 |
| 150m.pg151.cx7_128gram_64kiops | 1542024 | 2141992 | 639376 | 519215 | 496050 | 474375 |
| 150m.pg151.cx7_128gram_64kiops_noprep | 1542024 | 2141992 | 647269 | 334881 | 322304 | 309354 |
This lists the average rate of inserts/s for the tests that do inserts concurrent with queries. For such tests the query rate is listed in the table above. The read+write tests are setup so that the insert rate should match the target rate every second. Cells that are not at least 95% of the target have a red background to indicate a failure to satisfy the target.
| dbms | q100.1 | q500.1 | q1000.1 |
|---|---|---|---|
| my8031.cy8_128gram_64kiops | 4342 | 21716 | 43433 |
| fbmy8028.cy9c_128gram_64kiops | 4343 | 21710 | 43433 |
| pg151.cx7_128gram_64kiops | 4342 | 21710 | 43314 |
| pg151.cx7_128gram_64kiops_noprep | 4342 | 21710 | 43314 |
| target | 4400 | 22000 | 44000 |
l.i0
l.i0: load without secondary indexes. Graphs for performance per 1-second interval are here.
Average throughput:
Insert response time histogram: each cell has the percentage of responses that take <= the time in the header and max is the max response time in seconds. For the max column values in the top 25% of the range have a red background and in the bottom 25% of the range have a green background. The red background is not used when the min value is within 80% of the max value.
| dbms | 256us | 1ms | 4ms | 16ms | 64ms | 256ms | 1s | 4s | 16s | gt | max |
|---|---|---|---|---|---|---|---|---|---|---|---|
| my8031.cy8_128gram_64kiops | 54.310 | 45.354 | 0.252 | 0.045 | 0.038 | 0.108 | |||||
| fbmy8028.cy9c_128gram_64kiops | 8.753 | 68.159 | 22.951 | 0.133 | 0.004 | 0.078 | |||||
| pg151.cx7_128gram_64kiops | 96.077 | 3.855 | 0.039 | 0.030 | 0.043 | ||||||
| pg151.cx7_128gram_64kiops_noprep | 96.177 | 3.757 | 0.045 | 0.020 | 0.033 |
Performance metrics for the DBMS listed above. Some are normalized by throughput, others are not. Legend for results is here.
ips	qps	rps	rmbps	wps	wmbps	rpq	rkbpq	wpi	wkbpi	csps	cpups	cspq	cpupq	dbgb1	dbgb2	rss	maxop	p50	p99	tag
1294538	0	0	0.0	1953.4	336.6	0.000	0.000	0.002	0.266	178314	59.2	0.138	15	7.2	135.8	14.6	0.108	133963	1898	150m.my8031.cy8_128gram_64kiops
838861	0	0	0.0	1325.3	300.2	0.000	0.000	0.002	0.366	426078	63.9	0.508	24	4.8	5.4	1.8	0.078	120995	57353	150m.fbmy8028.cy9c_128gram_64kiops
1542024	0	0	0.0	2689.0	623.6	0.000	0.000	0.002	0.414	168575	57.0	0.109	12	10.0	27.1	8.1	0.043	166428	73222	150m.pg151.cx7_128gram_64kiops
1542024	0	0	0.0	2688.0	624.0	0.000	0.000	0.002	0.414	169359	55.3	0.110	11	10.0	27.1	7.9	0.033	167524	55055	150m.pg151.cx7_128gram_64kiops_noprep
l.x
l.x: create secondary indexes.
Average throughput:
Performance metrics for the DBMS listed above. Some are normalized by throughput, others are not. Legend for results is here.
ips	qps	rps	rmbps	wps	wmbps	rpq	rkbpq	wpi	wkbpi	csps	cpups	cspq	cpupq	dbgb1	dbgb2	rss	maxop	p50	p99	tag
739138	0	4382	270.2	14222.4	642.3	0.006	0.374	0.019	0.890	141866	31.1	0.192	13	15.6	144.2	17.5	0.004	NA	NA	150m.my8031.cy8_128gram_64kiops
1590267	0	9	0.3	1610.4	361.1	0.000	0.000	0.001	0.232	10969	51.1	0.007	10	7.2	7.8	8.4	0.003	NA	NA	150m.fbmy8028.cy9c_128gram_64kiops
2141992	0	0	0.0	2472.6	596.8	0.000	0.000	0.001	0.285	24042	19.7	0.011	3	19.3	44.8	0.0	0.018	NA	NA	150m.pg151.cx7_128gram_64kiops
2141992	0	0	0.0	2470.8	596.8	0.000	0.000	0.001	0.285	23910	17.6	0.011	3	19.3	44.8	0.0	0.024	NA	NA	150m.pg151.cx7_128gram_64kiops_noprep
l.i1
l.i1: continue load after secondary indexes created. Graphs for performance per 1-second interval are here.
Average throughput:
Insert response time histogram: each cell has the percentage of responses that take <= the time in the header and max is the max response time in seconds. For the max column values in the top 25% of the range have a red background and in the bottom 25% of the range have a green background. The red background is not used when the min value is within 80% of the max value.
| dbms | 256us | 1ms | 4ms | 16ms | 64ms | 256ms | 1s | 4s | 16s | gt | max |
|---|---|---|---|---|---|---|---|---|---|---|---|
| my8031.cy8_128gram_64kiops | 0.261 | 96.906 | 2.446 | 0.222 | 0.165 | nonzero | 0.283 | ||||
| fbmy8028.cy9c_128gram_64kiops | 1.691 | 14.539 | 83.608 | 0.147 | 0.014 | 0.082 | |||||
| pg151.cx7_128gram_64kiops | 19.330 | 78.661 | 1.699 | 0.310 | 0.033 | ||||||
| pg151.cx7_128gram_64kiops_noprep | 20.665 | 77.487 | 1.559 | 0.289 | 0.035 |
Performance metrics for the DBMS listed above. Some are normalized by throughput, others are not. Legend for results is here.
ips	qps	rps	rmbps	wps	wmbps	rpq	rkbpq	wpi	wkbpi	csps	cpups	cspq	cpupq	dbgb1	dbgb2	rss	maxop	p50	p99	tag
563750	0	5241	81.9	3439.5	439.5	0.009	0.149	0.006	0.798	183896	62.5	0.326	35	27.8	156.4	32.8	0.283	32673	300	150m.my8031.cy8_128gram_64kiops
267494	0	166	20.5	1551.9	358.3	0.001	0.078	0.006	1.372	147784	40.5	0.552	48	14.3	15.6	10.2	0.082	6343	1399	150m.fbmy8028.cy9c_128gram_64kiops
639376	0	0	0.0	3225.7	754.1	0.000	0.000	0.005	1.208	335425	59.6	0.525	30	33.6	82.3	25.3	0.033	50696	28470	150m.pg151.cx7_128gram_64kiops
647269	0	0	0.0	3227.0	754.4	0.000	0.000	0.005	1.193	334913	57.8	0.517	29	33.6	82.3	24.9	0.035	50859	20584	150m.pg151.cx7_128gram_64kiops_noprep
q100.1
q100.1: range queries with 100 insert/s per client. Graphs for performance per 1-second interval are here.
Average throughput:
Query response time histogram: each cell has the percentage of responses that take <= the time in the header and max is the max response time in seconds. For max values in the top 25% of the range have a red background and in the bottom 25% of the range have a green background. The red background is not used when the min value is within 80% of the max value.
| dbms | 256us | 1ms | 4ms | 16ms | 64ms | 256ms | 1s | 4s | 16s | gt | max |
|---|---|---|---|---|---|---|---|---|---|---|---|
| my8031.cy8_128gram_64kiops | 66.053 | 33.915 | 0.029 | 0.002 | nonzero | 0.029 | |||||
| fbmy8028.cy9c_128gram_64kiops | 65.258 | 34.683 | 0.050 | 0.008 | nonzero | 0.049 | |||||
| pg151.cx7_128gram_64kiops | 99.962 | 0.025 | 0.012 | 0.001 | nonzero | 0.050 | |||||
| pg151.cx7_128gram_64kiops_noprep | 99.288 | 0.692 | 0.019 | 0.001 | nonzero | 0.032 |
Insert response time histogram: each cell has the percentage of responses that take <= the time in the header and max is the max response time in seconds. For max values in the top 25% of the range have a red background and in the bottom 25% of the range have a green background. The red background is not used when the min value is within 80% of the max value.
| dbms | 256us | 1ms | 4ms | 16ms | 64ms | 256ms | 1s | 4s | 16s | gt | max |
|---|---|---|---|---|---|---|---|---|---|---|---|
| my8031.cy8_128gram_64kiops | 98.666 | 1.330 | 0.003 | 0.022 | |||||||
| fbmy8028.cy9c_128gram_64kiops | 35.036 | 63.689 | 1.250 | 0.025 | 0.029 | ||||||
| pg151.cx7_128gram_64kiops | 0.013 | 98.837 | 0.841 | 0.309 | 0.062 | ||||||
| pg151.cx7_128gram_64kiops_noprep | 0.026 | 98.985 | 0.709 | 0.279 | nonzero | 0.075 |
Performance metrics for the DBMS listed above. Some are normalized by throughput, others are not. Legend for results is here.
ips	qps	rps	rmbps	wps	wmbps	rpq	rkbpq	wpi	wkbpi	csps	cpups	cspq	cpupq	dbgb1	dbgb2	rss	maxop	p50	p99	tag
4342	223653	0	0.0	416.9	12.9	0.000	0.000	0.096	3.047	433149	94.8	1.937	136	28.9	157.5	33.8	0.029	5370	3181	150m.my8031.cy8_128gram_64kiops
4343	177033	0	0.0	47.4	10.6	0.000	0.000	0.011	2.492	342514	94.6	1.935	171	12.2	13.6	40.1	0.049	3420	2477	150m.fbmy8028.cy9c_128gram_64kiops
4342	519215	0	0.0	1903.1	84.9	0.000	0.000	0.438	20.017	1000170	94.7	1.926	58	35.1	85.5	19.8	0.050	11571	7032	150m.pg151.cx7_128gram_64kiops
4342	334881	0	0.0	1906.5	85.0	0.000	0.000	0.439	20.056	645539	94.7	1.928	90	35.1	85.5	19.2	0.032	5514	4507	150m.pg151.cx7_128gram_64kiops_noprep
q500.1
q500.1: range queries with 500 insert/s per client. Graphs for performance per 1-second interval are here.
Average throughput:

Query response time histogram: each cell has the percentage of responses that take <= the time in the header and max is the max response time in seconds. For max values in the top 25% of the range have a red background and in the bottom 25% of the range have a green background. The red background is not used when the min value is within 80% of the max value.
| dbms | 256us | 1ms | 4ms | 16ms | 64ms | 256ms | 1s | 4s | 16s | gt | max |
|---|---|---|---|---|---|---|---|---|---|---|---|
| my8031.cy8_128gram_64kiops | 65.050 | 34.836 | 0.088 | 0.025 | 0.001 | nonzero | 0.074 | ||||
| fbmy8028.cy9c_128gram_64kiops | 62.137 | 37.684 | 0.142 | 0.035 | 0.002 | 0.056 | |||||
| pg151.cx7_128gram_64kiops | 99.948 | 0.026 | 0.013 | 0.011 | 0.002 | nonzero | 0.111 | ||||
| pg151.cx7_128gram_64kiops_noprep | 99.135 | 0.824 | 0.020 | 0.018 | 0.003 | nonzero | 0.089 |
Insert response time histogram: each cell has the percentage of responses that take <= the time in the header and max is the max response time in seconds. For max values in the top 25% of the range have a red background and in the bottom 25% of the range have a green background. The red background is not used when the min value is within 80% of the max value.
| dbms | 256us | 1ms | 4ms | 16ms | 64ms | 256ms | 1s | 4s | 16s | gt | max |
|---|---|---|---|---|---|---|---|---|---|---|---|
| my8031.cy8_128gram_64kiops | 67.083 | 32.175 | 0.742 | nonzero | 0.077 | ||||||
| fbmy8028.cy9c_128gram_64kiops | 20.182 | 58.894 | 20.085 | 0.839 | nonzero | 0.067 | |||||
| pg151.cx7_128gram_64kiops | 5.785 | 81.379 | 8.150 | 4.099 | 0.586 | 0.001 | 0.362 | ||||
| pg151.cx7_128gram_64kiops_noprep | 6.664 | 80.935 | 8.015 | 3.841 | 0.544 | 0.001 | 0.325 |
Performance metrics for the DBMS listed above. Some are normalized by throughput, others are not. Legend for results is here.
ips	qps	rps	rmbps	wps	wmbps	rpq	rkbpq	wpi	wkbpi	csps	cpups	cspq	cpupq	dbgb1	dbgb2	rss	maxop	p50	p99	tag
21716	217569	0	0.0	991.0	41.6	0.000	0.000	0.046	1.964	425693	94.7	1.957	139	51.4	180.0	53.9	0.074	5150	3149	150m.my8031.cy8_128gram_64kiops
21710	164464	0	0.0	200.5	46.6	0.000	0.000	0.009	2.200	322421	94.0	1.960	183	17.8	19.8	82.6	0.056	3022	2365	150m.fbmy8028.cy9c_128gram_64kiops
21710	496050	0	0.0	1411.5	146.8	0.000	0.000	0.065	6.923	957508	94.6	1.930	61	58.1	102.8	0.0	0.111	8318	6617	150m.pg151.cx7_128gram_64kiops
21710	322304	0	0.0	1417.3	147.2	0.000	0.000	0.065	6.943	623736	94.5	1.935	94	58.1	103.0	0.0	0.089	6233	4333	150m.pg151.cx7_128gram_64kiops_noprep
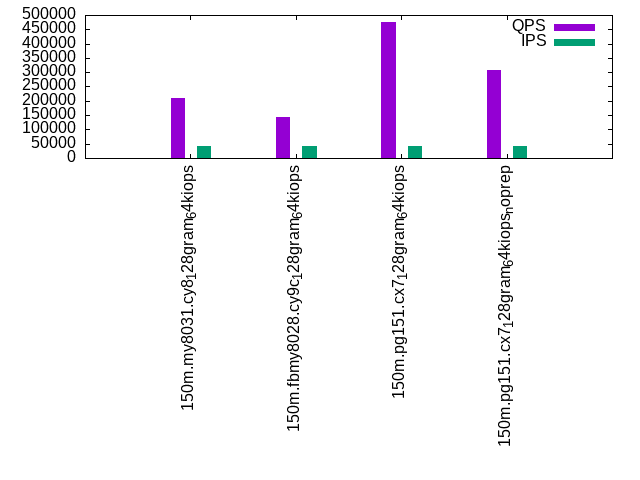
q1000.1
q1000.1: range queries with 1000 insert/s per client. Graphs for performance per 1-second interval are here.
Average throughput:
Query response time histogram: each cell has the percentage of responses that take <= the time in the header and max is the max response time in seconds. For max values in the top 25% of the range have a red background and in the bottom 25% of the range have a green background. The red background is not used when the min value is within 80% of the max value.
| dbms | 256us | 1ms | 4ms | 16ms | 64ms | 256ms | 1s | 4s | 16s | gt | max |
|---|---|---|---|---|---|---|---|---|---|---|---|
| my8031.cy8_128gram_64kiops | 62.994 | 36.770 | 0.197 | 0.039 | 0.001 | 0.044 | |||||
| fbmy8028.cy9c_128gram_64kiops | 57.775 | 41.714 | 0.444 | 0.065 | 0.002 | nonzero | 0.104 | ||||
| pg151.cx7_128gram_64kiops | 99.831 | 0.063 | 0.083 | 0.013 | 0.010 | nonzero | nonzero | 0.482 | |||
| pg151.cx7_128gram_64kiops_noprep | 98.811 | 1.025 | 0.125 | 0.023 | 0.016 | nonzero | nonzero | 0.494 |
Insert response time histogram: each cell has the percentage of responses that take <= the time in the header and max is the max response time in seconds. For max values in the top 25% of the range have a red background and in the bottom 25% of the range have a green background. The red background is not used when the min value is within 80% of the max value.
| dbms | 256us | 1ms | 4ms | 16ms | 64ms | 256ms | 1s | 4s | 16s | gt | max |
|---|---|---|---|---|---|---|---|---|---|---|---|
| my8031.cy8_128gram_64kiops | 55.372 | 43.884 | 0.744 | nonzero | 0.086 | ||||||
| fbmy8028.cy9c_128gram_64kiops | 5.680 | 53.773 | 39.135 | 1.412 | 0.062 | ||||||
| pg151.cx7_128gram_64kiops | 0.200 | 81.639 | 13.401 | 3.599 | 1.140 | 0.020 | 0.731 | ||||
| pg151.cx7_128gram_64kiops_noprep | 0.347 | 81.891 | 12.562 | 4.043 | 1.143 | 0.015 | 0.713 |
Performance metrics for the DBMS listed above. Some are normalized by throughput, others are not. Legend for results is here.
ips	qps	rps	rmbps	wps	wmbps	rpq	rkbpq	wpi	wkbpi	csps	cpups	cspq	cpupq	dbgb1	dbgb2	rss	maxop	p50	p99	tag
43433	208874	0	0.0	1814.4	71.6	0.000	0.000	0.042	1.689	415516	94.7	1.989	145	76.5	205.1	77.0	0.044	4365	3117	150m.my8031.cy8_128gram_64kiops
43433	142574	1	0.1	403.1	91.0	0.000	0.000	0.009	2.145	286115	93.3	2.007	209	29.3	30.4	83.1	0.104	2717	2142	150m.fbmy8028.cy9c_128gram_64kiops
43314	474375	2	0.0	2155.9	258.3	0.000	0.000	0.050	6.106	924488	93.7	1.949	63	80.4	157.3	0.0	0.482	7736	5896	150m.pg151.cx7_128gram_64kiops
43314	309354	2	0.0	2160.4	258.7	0.000	0.000	0.050	6.116	608240	93.4	1.966	97	80.4	157.4	0.0	0.494	5558	3692	150m.pg151.cx7_128gram_64kiops_noprep
l.i0
l.i0: load without secondary indexes
Performance metrics for all DBMS, not just the ones listed above. Some are normalized by throughput, others are not. Legend for results is here.
ips	qps	rps	rmbps	wps	wmbps	rpq	rkbpq	wpi	wkbpi	csps	cpups	cspq	cpupq	dbgb1	dbgb2	rss	maxop	p50	p99	tag
1294538	0	0	0.0	1953.4	336.6	0.000	0.000	0.002	0.266	178314	59.2	0.138	15	7.2	135.8	14.6	0.108	133963	1898	150m.my8031.cy8_128gram_64kiops
838861	0	0	0.0	1325.3	300.2	0.000	0.000	0.002	0.366	426078	63.9	0.508	24	4.8	5.4	1.8	0.078	120995	57353	150m.fbmy8028.cy9c_128gram_64kiops
1542024	0	0	0.0	2689.0	623.6	0.000	0.000	0.002	0.414	168575	57.0	0.109	12	10.0	27.1	8.1	0.043	166428	73222	150m.pg151.cx7_128gram_64kiops
1542024	0	0	0.0	2688.0	624.0	0.000	0.000	0.002	0.414	169359	55.3	0.110	11	10.0	27.1	7.9	0.033	167524	55055	150m.pg151.cx7_128gram_64kiops_noprep
l.x
l.x: create secondary indexes
Performance metrics for all DBMS, not just the ones listed above. Some are normalized by throughput, others are not. Legend for results is here.
ips	qps	rps	rmbps	wps	wmbps	rpq	rkbpq	wpi	wkbpi	csps	cpups	cspq	cpupq	dbgb1	dbgb2	rss	maxop	p50	p99	tag
739138	0	4382	270.2	14222.4	642.3	0.006	0.374	0.019	0.890	141866	31.1	0.192	13	15.6	144.2	17.5	0.004	NA	NA	150m.my8031.cy8_128gram_64kiops
1590267	0	9	0.3	1610.4	361.1	0.000	0.000	0.001	0.232	10969	51.1	0.007	10	7.2	7.8	8.4	0.003	NA	NA	150m.fbmy8028.cy9c_128gram_64kiops
2141992	0	0	0.0	2472.6	596.8	0.000	0.000	0.001	0.285	24042	19.7	0.011	3	19.3	44.8	0.0	0.018	NA	NA	150m.pg151.cx7_128gram_64kiops
2141992	0	0	0.0	2470.8	596.8	0.000	0.000	0.001	0.285	23910	17.6	0.011	3	19.3	44.8	0.0	0.024	NA	NA	150m.pg151.cx7_128gram_64kiops_noprep
l.i1
l.i1: continue load after secondary indexes created
Performance metrics for all DBMS, not just the ones listed above. Some are normalized by throughput, others are not. Legend for results is here.
ips	qps	rps	rmbps	wps	wmbps	rpq	rkbpq	wpi	wkbpi	csps	cpups	cspq	cpupq	dbgb1	dbgb2	rss	maxop	p50	p99	tag
563750	0	5241	81.9	3439.5	439.5	0.009	0.149	0.006	0.798	183896	62.5	0.326	35	27.8	156.4	32.8	0.283	32673	300	150m.my8031.cy8_128gram_64kiops
267494	0	166	20.5	1551.9	358.3	0.001	0.078	0.006	1.372	147784	40.5	0.552	48	14.3	15.6	10.2	0.082	6343	1399	150m.fbmy8028.cy9c_128gram_64kiops
639376	0	0	0.0	3225.7	754.1	0.000	0.000	0.005	1.208	335425	59.6	0.525	30	33.6	82.3	25.3	0.033	50696	28470	150m.pg151.cx7_128gram_64kiops
647269	0	0	0.0	3227.0	754.4	0.000	0.000	0.005	1.193	334913	57.8	0.517	29	33.6	82.3	24.9	0.035	50859	20584	150m.pg151.cx7_128gram_64kiops_noprep
q100.1
q100.1: range queries with 100 insert/s per client
Performance metrics for all DBMS, not just the ones listed above. Some are normalized by throughput, others are not. Legend for results is here.
ips	qps	rps	rmbps	wps	wmbps	rpq	rkbpq	wpi	wkbpi	csps	cpups	cspq	cpupq	dbgb1	dbgb2	rss	maxop	p50	p99	tag
4342	223653	0	0.0	416.9	12.9	0.000	0.000	0.096	3.047	433149	94.8	1.937	136	28.9	157.5	33.8	0.029	5370	3181	150m.my8031.cy8_128gram_64kiops
4343	177033	0	0.0	47.4	10.6	0.000	0.000	0.011	2.492	342514	94.6	1.935	171	12.2	13.6	40.1	0.049	3420	2477	150m.fbmy8028.cy9c_128gram_64kiops
4342	519215	0	0.0	1903.1	84.9	0.000	0.000	0.438	20.017	1000170	94.7	1.926	58	35.1	85.5	19.8	0.050	11571	7032	150m.pg151.cx7_128gram_64kiops
4342	334881	0	0.0	1906.5	85.0	0.000	0.000	0.439	20.056	645539	94.7	1.928	90	35.1	85.5	19.2	0.032	5514	4507	150m.pg151.cx7_128gram_64kiops_noprep
q500.1
q500.1: range queries with 500 insert/s per client
Performance metrics for all DBMS, not just the ones listed above. Some are normalized by throughput, others are not. Legend for results is here.
ips	qps	rps	rmbps	wps	wmbps	rpq	rkbpq	wpi	wkbpi	csps	cpups	cspq	cpupq	dbgb1	dbgb2	rss	maxop	p50	p99	tag
21716	217569	0	0.0	991.0	41.6	0.000	0.000	0.046	1.964	425693	94.7	1.957	139	51.4	180.0	53.9	0.074	5150	3149	150m.my8031.cy8_128gram_64kiops
21710	164464	0	0.0	200.5	46.6	0.000	0.000	0.009	2.200	322421	94.0	1.960	183	17.8	19.8	82.6	0.056	3022	2365	150m.fbmy8028.cy9c_128gram_64kiops
21710	496050	0	0.0	1411.5	146.8	0.000	0.000	0.065	6.923	957508	94.6	1.930	61	58.1	102.8	0.0	0.111	8318	6617	150m.pg151.cx7_128gram_64kiops
21710	322304	0	0.0	1417.3	147.2	0.000	0.000	0.065	6.943	623736	94.5	1.935	94	58.1	103.0	0.0	0.089	6233	4333	150m.pg151.cx7_128gram_64kiops_noprep
q1000.1
q1000.1: range queries with 1000 insert/s per client
Performance metrics for all DBMS, not just the ones listed above. Some are normalized by throughput, others are not. Legend for results is here.
ips	qps	rps	rmbps	wps	wmbps	rpq	rkbpq	wpi	wkbpi	csps	cpups	cspq	cpupq	dbgb1	dbgb2	rss	maxop	p50	p99	tag
43433	208874	0	0.0	1814.4	71.6	0.000	0.000	0.042	1.689	415516	94.7	1.989	145	76.5	205.1	77.0	0.044	4365	3117	150m.my8031.cy8_128gram_64kiops
43433	142574	1	0.1	403.1	91.0	0.000	0.000	0.009	2.145	286115	93.3	2.007	209	29.3	30.4	83.1	0.104	2717	2142	150m.fbmy8028.cy9c_128gram_64kiops
43314	474375	2	0.0	2155.9	258.3	0.000	0.000	0.050	6.106	924488	93.7	1.949	63	80.4	157.3	0.0	0.482	7736	5896	150m.pg151.cx7_128gram_64kiops
43314	309354	2	0.0	2160.4	258.7	0.000	0.000	0.050	6.116	608240	93.4	1.966	97	80.4	157.4	0.0	0.494	5558	3692	150m.pg151.cx7_128gram_64kiops_noprep
l.i0
- l.i0: load without secondary indexes
- Legend for results is here.
- Each entry lists the percentage of responses that fit in that bucket (slower than max time for previous bucket, faster than min time for next bucket).
Insert response time histogram
256us	1ms	4ms	16ms	64ms	256ms	1s	4s	16s	gt	max	tag
0.000	54.310	45.354	0.252	0.045	0.038	0.000	0.000	0.000	0.000	0.108	my8031.cy8_128gram_64kiops
0.000	8.753	68.159	22.951	0.133	0.004	0.000	0.000	0.000	0.000	0.078	fbmy8028.cy9c_128gram_64kiops
0.000	96.077	3.855	0.039	0.030	0.000	0.000	0.000	0.000	0.000	0.043	pg151.cx7_128gram_64kiops
0.000	96.177	3.757	0.045	0.020	0.000	0.000	0.000	0.000	0.000	0.033	pg151.cx7_128gram_64kiops_noprep
l.x
- l.x: create secondary indexes
- Legend for results is here.
- Each entry lists the percentage of responses that fit in that bucket (slower than max time for previous bucket, faster than min time for next bucket).
TODO - determine whether there is data for create index response time
l.i1
- l.i1: continue load after secondary indexes created
- Legend for results is here.
- Each entry lists the percentage of responses that fit in that bucket (slower than max time for previous bucket, faster than min time for next bucket).
Insert response time histogram
256us	1ms	4ms	16ms	64ms	256ms	1s	4s	16s	gt	max	tag
0.000	0.261	96.906	2.446	0.222	0.165	nonzero	0.000	0.000	0.000	0.283	my8031.cy8_128gram_64kiops
0.000	1.691	14.539	83.608	0.147	0.014	0.000	0.000	0.000	0.000	0.082	fbmy8028.cy9c_128gram_64kiops
0.000	19.330	78.661	1.699	0.310	0.000	0.000	0.000	0.000	0.000	0.033	pg151.cx7_128gram_64kiops
0.000	20.665	77.487	1.559	0.289	0.000	0.000	0.000	0.000	0.000	0.035	pg151.cx7_128gram_64kiops_noprep
q100.1
- q100.1: range queries with 100 insert/s per client
- Legend for results is here.
- Each entry lists the percentage of responses that fit in that bucket (slower than max time for previous bucket, faster than min time for next bucket).
Query response time histogram
256us	1ms	4ms	16ms	64ms	256ms	1s	4s	16s	gt	max	tag
66.053	33.915	0.029	0.002	nonzero	0.000	0.000	0.000	0.000	0.000	0.029	my8031.cy8_128gram_64kiops
65.258	34.683	0.050	0.008	nonzero	0.000	0.000	0.000	0.000	0.000	0.049	fbmy8028.cy9c_128gram_64kiops
99.962	0.025	0.012	0.001	nonzero	0.000	0.000	0.000	0.000	0.000	0.050	pg151.cx7_128gram_64kiops
99.288	0.692	0.019	0.001	nonzero	0.000	0.000	0.000	0.000	0.000	0.032	pg151.cx7_128gram_64kiops_noprep
Insert response time histogram
256us	1ms	4ms	16ms	64ms	256ms	1s	4s	16s	gt	max	tag
0.000	0.000	98.666	1.330	0.003	0.000	0.000	0.000	0.000	0.000	0.022	my8031.cy8_128gram_64kiops
0.000	35.036	63.689	1.250	0.025	0.000	0.000	0.000	0.000	0.000	0.029	fbmy8028.cy9c_128gram_64kiops
0.000	0.013	98.837	0.841	0.309	0.000	0.000	0.000	0.000	0.000	0.062	pg151.cx7_128gram_64kiops
0.000	0.026	98.985	0.709	0.279	nonzero	0.000	0.000	0.000	0.000	0.075	pg151.cx7_128gram_64kiops_noprep
q500.1
- q500.1: range queries with 500 insert/s per client
- Legend for results is here.
- Each entry lists the percentage of responses that fit in that bucket (slower than max time for previous bucket, faster than min time for next bucket).
Query response time histogram
256us	1ms	4ms	16ms	64ms	256ms	1s	4s	16s	gt	max	tag
65.050	34.836	0.088	0.025	0.001	nonzero	0.000	0.000	0.000	0.000	0.074	my8031.cy8_128gram_64kiops
62.137	37.684	0.142	0.035	0.002	0.000	0.000	0.000	0.000	0.000	0.056	fbmy8028.cy9c_128gram_64kiops
99.948	0.026	0.013	0.011	0.002	nonzero	0.000	0.000	0.000	0.000	0.111	pg151.cx7_128gram_64kiops
99.135	0.824	0.020	0.018	0.003	nonzero	0.000	0.000	0.000	0.000	0.089	pg151.cx7_128gram_64kiops_noprep
Insert response time histogram
256us	1ms	4ms	16ms	64ms	256ms	1s	4s	16s	gt	max	tag
0.000	0.000	67.083	32.175	0.742	nonzero	0.000	0.000	0.000	0.000	0.077	my8031.cy8_128gram_64kiops
0.000	20.182	58.894	20.085	0.839	nonzero	0.000	0.000	0.000	0.000	0.067	fbmy8028.cy9c_128gram_64kiops
0.000	5.785	81.379	8.150	4.099	0.586	0.001	0.000	0.000	0.000	0.362	pg151.cx7_128gram_64kiops
0.000	6.664	80.935	8.015	3.841	0.544	0.001	0.000	0.000	0.000	0.325	pg151.cx7_128gram_64kiops_noprep
q1000.1
- q1000.1: range queries with 1000 insert/s per client
- Legend for results is here.
- Each entry lists the percentage of responses that fit in that bucket (slower than max time for previous bucket, faster than min time for next bucket).
Query response time histogram
256us	1ms	4ms	16ms	64ms	256ms	1s	4s	16s	gt	max	tag
62.994	36.770	0.197	0.039	0.001	0.000	0.000	0.000	0.000	0.000	0.044	my8031.cy8_128gram_64kiops
57.775	41.714	0.444	0.065	0.002	nonzero	0.000	0.000	0.000	0.000	0.104	fbmy8028.cy9c_128gram_64kiops
99.831	0.063	0.083	0.013	0.010	nonzero	nonzero	0.000	0.000	0.000	0.482	pg151.cx7_128gram_64kiops
98.811	1.025	0.125	0.023	0.016	nonzero	nonzero	0.000	0.000	0.000	0.494	pg151.cx7_128gram_64kiops_noprep
Insert response time histogram
256us	1ms	4ms	16ms	64ms	256ms	1s	4s	16s	gt	max	tag
0.000	0.000	55.372	43.884	0.744	nonzero	0.000	0.000	0.000	0.000	0.086	my8031.cy8_128gram_64kiops
0.000	5.680	53.773	39.135	1.412	0.000	0.000	0.000	0.000	0.000	0.062	fbmy8028.cy9c_128gram_64kiops
0.000	0.200	81.639	13.401	3.599	1.140	0.020	0.000	0.000	0.000	0.731	pg151.cx7_128gram_64kiops
0.000	0.347	81.891	12.562	4.043	1.143	0.015	0.000	0.000	0.000	0.713	pg151.cx7_128gram_64kiops_noprep