Introduction
This is a report for the insert benchmark with 150M docs and 22 client(s). It is generated by scripts (bash, awk, sed) and Tufte might not be impressed. An overview of the insert benchmark is here and a short update is here. Below, by DBMS, I mean DBMS+version.config. An example is my8020.c10b40 where my means MySQL, 8020 is version 8.0.20 and c10b40 is the name for the configuration file.
The test server is an c6i.16xl with 32 cores, 64 HW threads (hyperthread disabled), 128G RAM and io2 storage (5T, 64K IOPs). The benchmark was run with 22 clients and there was 1 or 2 connections per client (1 for queries, 1 for inserts). The benchmark loads 100M rows without secondary indexes, creates secondary indexes, loads another 50M rows then does 3 read+write tests for one hour each that do queries as fast as possible with 100, 500 and then 1000 writes/second/client concurrent with the queries. The database is cached by the storage engine and the only IO is for writes. Clients and the DBMS share one server. The per-database configs are in the per-database subdirectories here.
The tested DBMS are:
- my8031.cy8_128gram_64kiops - MySQL 8.0.31 with InnoDB and the cy8_128gram_64kiops config
- fbmy8028.cy9c_128gram_64kiops - FB MySQL 8.0.28 with MyRocks and the cy9c_128gram_64kiops config
- pg151.cx7_128gram_64kiops - Postgres 15.1 and the cx7_128gram_64kiops config, uses prepared statements for queries
- pg151.cx7_128gram_64kiops_noprep - Postgres 15.1 and the cx7_128gram_64kiops config, does not use prepared statements
Contents
- Summary
- l.i0: load without secondary indexes
- l.x: create secondary indexes
- l.i1: continue load after secondary indexes created
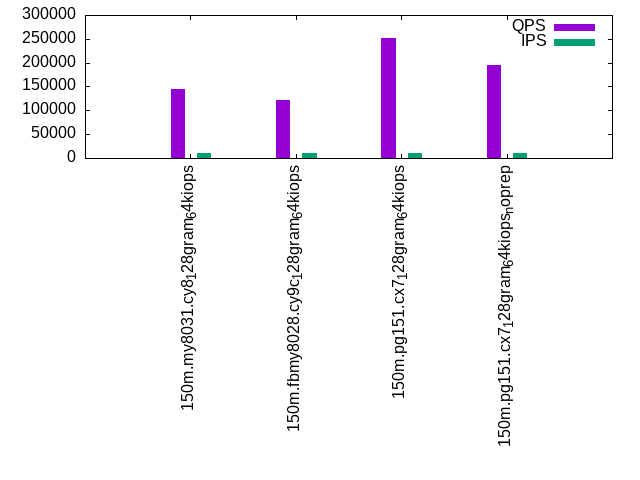
- q100.1: range queries with 100 insert/s per client
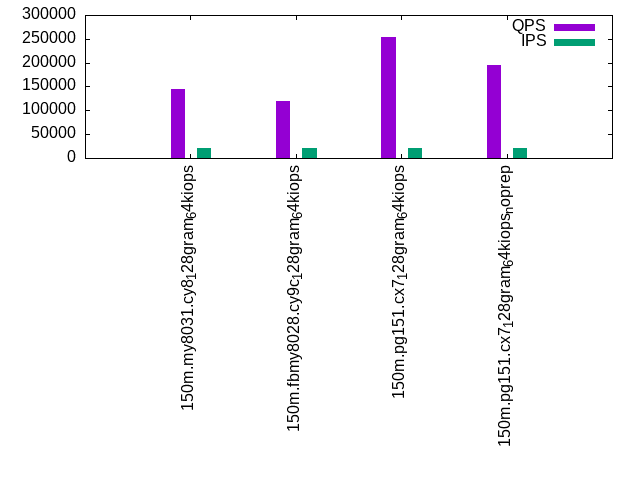
- q500.1: range queries with 500 insert/s per client
- q1000.1: range queries with 1000 insert/s per client
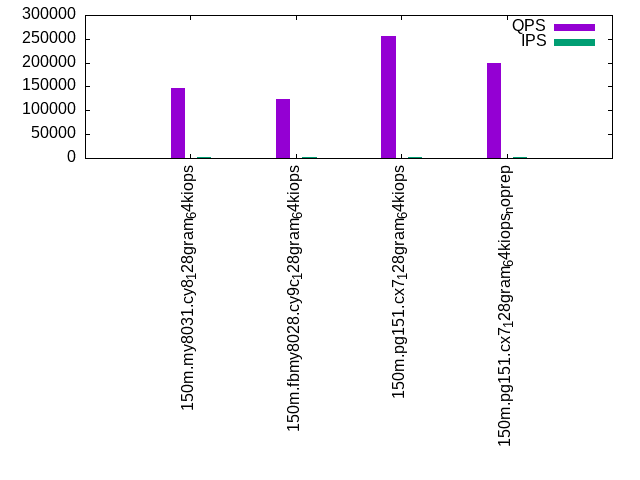
Summary
The numbers are inserts/s for l.i0 and l.i1, indexed docs (or rows) /s for l.x and queries/s for q*.2. The values are the average rate over the entire test for inserts (IPS) and queries (QPS). The range of values for IPS and QPS is split into 3 parts: bottom 25%, middle 50%, top 25%. Values in the bottom 25% have a red background, values in the top 25% have a green background and values in the middle have no color. A gray background is used for values that can be ignored because the DBMS did not sustain the target insert rate. Red backgrounds are not used when the minimum value is within 80% of the max value.
| dbms | l.i0 | l.x | l.i1 | q100.1 | q500.1 | q1000.1 |
|---|---|---|---|---|---|---|
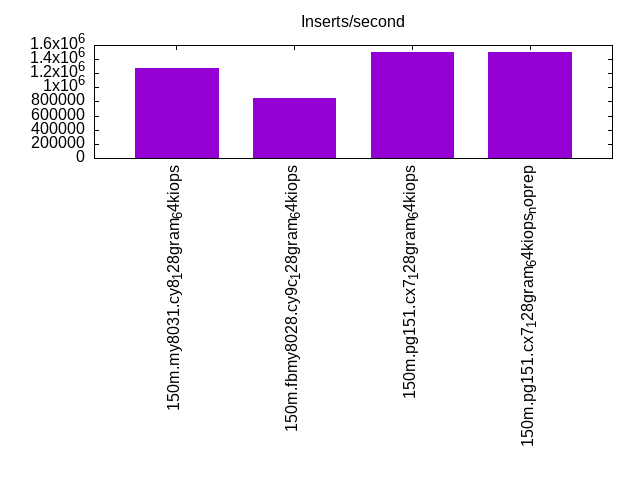
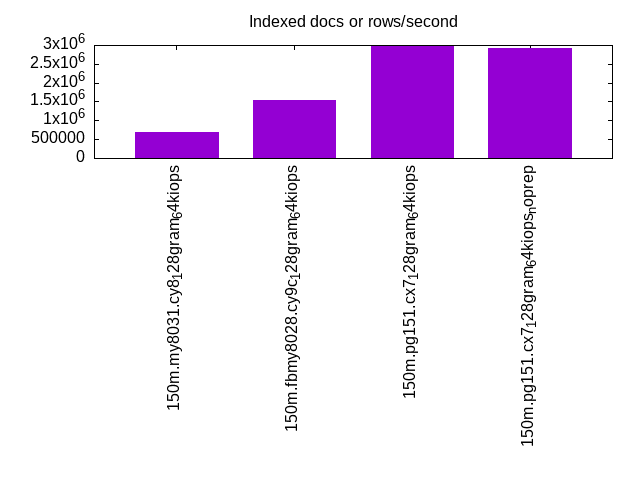
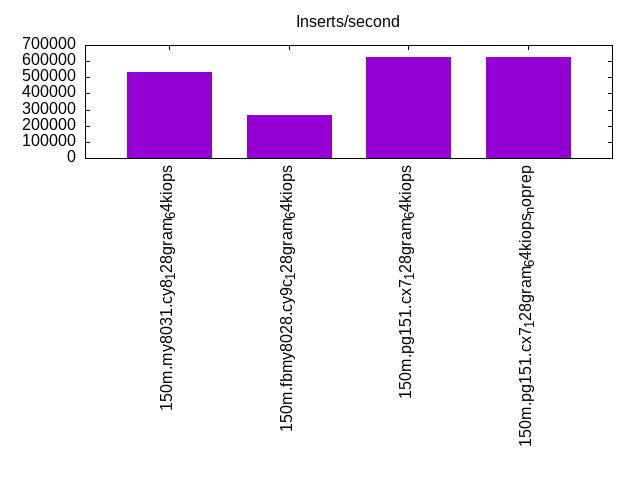
| 150m.my8031.cy8_128gram_64kiops | 1278751 | 690510 | 534988 | 147313 | 145792 | 144898 |
| 150m.fbmy8028.cy9c_128gram_64kiops | 845626 | 1543494 | 263461 | 123811 | 121898 | 118668 |
| 150m.pg151.cx7_128gram_64kiops | 1497966 | 2998788 | 624152 | 256117 | 251034 | 253315 |
| 150m.pg151.cx7_128gram_64kiops_noprep | 1497966 | 2915489 | 624152 | 199270 | 195671 | 194225 |
This lists the average rate of inserts/s for the tests that do inserts concurrent with queries. For such tests the query rate is listed in the table above. The read+write tests are setup so that the insert rate should match the target rate every second. Cells that are not at least 95% of the target have a red background to indicate a failure to satisfy the target.
| dbms | q100.1 | q500.1 | q1000.1 |
|---|---|---|---|
| my8031.cy8_128gram_64kiops | 2185 | 10924 | 21854 |
| fbmy8028.cy9c_128gram_64kiops | 2184 | 10921 | 21848 |
| pg151.cx7_128gram_64kiops | 2184 | 10924 | 21848 |
| pg151.cx7_128gram_64kiops_noprep | 2184 | 10927 | 21854 |
| target | 2200 | 11000 | 22000 |
l.i0
l.i0: load without secondary indexes. Graphs for performance per 1-second interval are here.
Average throughput:
Insert response time histogram: each cell has the percentage of responses that take <= the time in the header and max is the max response time in seconds. For the max column values in the top 25% of the range have a red background and in the bottom 25% of the range have a green background. The red background is not used when the min value is within 80% of the max value.
| dbms | 256us | 1ms | 4ms | 16ms | 64ms | 256ms | 1s | 4s | 16s | gt | max |
|---|---|---|---|---|---|---|---|---|---|---|---|
| my8031.cy8_128gram_64kiops | 70.403 | 29.338 | 0.191 | 0.028 | 0.041 | 0.125 | |||||
| fbmy8028.cy9c_128gram_64kiops | 10.118 | 88.361 | 1.451 | 0.062 | 0.008 | 0.097 | |||||
| pg151.cx7_128gram_64kiops | 86.968 | 12.731 | 0.074 | 0.228 | 0.034 | ||||||
| pg151.cx7_128gram_64kiops_noprep | 87.229 | 12.495 | 0.077 | 0.198 | 0.033 |
Performance metrics for the DBMS listed above. Some are normalized by throughput, others are not. Legend for results is here.
ips	qps	rps	rmbps	wps	wmbps	rpq	rkbpq	wpi	wkbpi	csps	cpups	cspq	cpupq	dbgb1	dbgb2	rss	maxop	p50	p99	tag
1278751	0	0	0.0	1917.1	334.9	0.000	0.000	0.001	0.268	184626	58.2	0.144	15	7.0	135.6	14.6	0.125	113779	12187	150m.my8031.cy8_128gram_64kiops
845626	0	0	0.0	1333.0	302.9	0.000	0.000	0.002	0.367	300532	59.7	0.355	23	4.0	4.6	1.9	0.097	46662	3097	150m.fbmy8028.cy9c_128gram_64kiops
1497966	0	0	0.0	2636.5	615.8	0.000	0.000	0.002	0.421	167862	54.5	0.112	12	10.0	27.1	9.5	0.034	161665	31966	150m.pg151.cx7_128gram_64kiops
1497966	0	0	0.0	2638.1	616.3	0.000	0.000	0.002	0.421	166840	52.7	0.111	11	10.0	27.1	9.6	0.033	161129	999	150m.pg151.cx7_128gram_64kiops_noprep
l.x
l.x: create secondary indexes.
Average throughput:
Performance metrics for the DBMS listed above. Some are normalized by throughput, others are not. Legend for results is here.
ips	qps	rps	rmbps	wps	wmbps	rpq	rkbpq	wpi	wkbpi	csps	cpups	cspq	cpupq	dbgb1	dbgb2	rss	maxop	p50	p99	tag
690510	0	3862	247.6	13429.0	634.2	0.006	0.367	0.019	0.940	152756	30.8	0.221	14	15.6	144.1	19.3	0.003	NA	NA	150m.my8031.cy8_128gram_64kiops
1543494	0	4	0.3	1310.0	298.2	0.000	0.000	0.001	0.198	9243	53.0	0.006	11	7.2	7.8	11.5	0.004	NA	NA	150m.fbmy8028.cy9c_128gram_64kiops
2998788	0	0	0.0	3392.1	822.8	0.000	0.000	0.001	0.281	53053	26.5	0.018	3	19.3	44.8	0.0	0.048	NA	NA	150m.pg151.cx7_128gram_64kiops
2915489	0	0	0.0	3354.8	813.0	0.000	0.000	0.001	0.286	49801	24.0	0.017	3	19.3	44.8	0.0	0.085	NA	NA	150m.pg151.cx7_128gram_64kiops_noprep
l.i1
l.i1: continue load after secondary indexes created. Graphs for performance per 1-second interval are here.
Average throughput:
Insert response time histogram: each cell has the percentage of responses that take <= the time in the header and max is the max response time in seconds. For the max column values in the top 25% of the range have a red background and in the bottom 25% of the range have a green background. The red background is not used when the min value is within 80% of the max value.
| dbms | 256us | 1ms | 4ms | 16ms | 64ms | 256ms | 1s | 4s | 16s | gt | max |
|---|---|---|---|---|---|---|---|---|---|---|---|
| my8031.cy8_128gram_64kiops | 0.175 | 99.114 | 0.379 | 0.221 | 0.110 | 0.002 | 0.453 | ||||
| fbmy8028.cy9c_128gram_64kiops | 1.594 | 50.776 | 47.589 | 0.031 | 0.010 | 0.076 | |||||
| pg151.cx7_128gram_64kiops | 17.975 | 81.476 | 0.052 | 0.498 | 0.038 | ||||||
| pg151.cx7_128gram_64kiops_noprep | 18.383 | 81.079 | 0.036 | 0.501 | 0.040 |
Performance metrics for the DBMS listed above. Some are normalized by throughput, others are not. Legend for results is here.
ips	qps	rps	rmbps	wps	wmbps	rpq	rkbpq	wpi	wkbpi	csps	cpups	cspq	cpupq	dbgb1	dbgb2	rss	maxop	p50	p99	tag
534988	0	5018	78.4	3482.1	422.6	0.009	0.150	0.007	0.809	182068	58.5	0.340	35	27.7	156.2	32.8	0.453	33224	300	150m.my8031.cy8_128gram_64kiops
263461	0	162	20.0	1408.7	325.5	0.001	0.078	0.005	1.265	100436	37.0	0.381	45	18.7	20.0	13.2	0.076	12387	11238	150m.fbmy8028.cy9c_128gram_64kiops
624152	0	0	0.0	3255.5	767.8	0.000	0.000	0.005	1.260	288082	58.4	0.462	30	33.6	82.3	21.8	0.038	39219	22782	150m.pg151.cx7_128gram_64kiops
624152	0	0	0.0	3255.2	767.9	0.000	0.000	0.005	1.260	285818	57.1	0.458	29	33.6	82.3	21.8	0.040	39608	4945	150m.pg151.cx7_128gram_64kiops_noprep
q100.1
q100.1: range queries with 100 insert/s per client. Graphs for performance per 1-second interval are here.
Average throughput:
Query response time histogram: each cell has the percentage of responses that take <= the time in the header and max is the max response time in seconds. For max values in the top 25% of the range have a red background and in the bottom 25% of the range have a green background. The red background is not used when the min value is within 80% of the max value.
| dbms | 256us | 1ms | 4ms | 16ms | 64ms | 256ms | 1s | 4s | 16s | gt | max |
|---|---|---|---|---|---|---|---|---|---|---|---|
| my8031.cy8_128gram_64kiops | 99.360 | 0.636 | 0.003 | nonzero | nonzero | 0.023 | |||||
| fbmy8028.cy9c_128gram_64kiops | 97.987 | 2.011 | 0.001 | nonzero | 0.015 | ||||||
| pg151.cx7_128gram_64kiops | 99.989 | 0.007 | 0.003 | nonzero | nonzero | 0.019 | |||||
| pg151.cx7_128gram_64kiops_noprep | 99.970 | 0.026 | 0.003 | nonzero | nonzero | 0.017 |
Insert response time histogram: each cell has the percentage of responses that take <= the time in the header and max is the max response time in seconds. For max values in the top 25% of the range have a red background and in the bottom 25% of the range have a green background. The red background is not used when the min value is within 80% of the max value.
| dbms | 256us | 1ms | 4ms | 16ms | 64ms | 256ms | 1s | 4s | 16s | gt | max |
|---|---|---|---|---|---|---|---|---|---|---|---|
| my8031.cy8_128gram_64kiops | 98.980 | 1.020 | 0.010 | ||||||||
| fbmy8028.cy9c_128gram_64kiops | 7.374 | 89.744 | 2.882 | 0.001 | 0.019 | ||||||
| pg151.cx7_128gram_64kiops | 98.136 | 1.294 | 0.564 | 0.006 | 0.075 | ||||||
| pg151.cx7_128gram_64kiops_noprep | 98.469 | 1.061 | 0.470 | 0.037 |
Performance metrics for the DBMS listed above. Some are normalized by throughput, others are not. Legend for results is here.
ips	qps	rps	rmbps	wps	wmbps	rpq	rkbpq	wpi	wkbpi	csps	cpups	cspq	cpupq	dbgb1	dbgb2	rss	maxop	p50	p99	tag
2185	147313	0	0.0	408.8	11.9	0.000	0.000	0.187	5.584	552886	66.4	3.753	144	28.2	156.8	33.3	0.023	6713	6649	150m.my8031.cy8_128gram_64kiops
2184	123811	0	0.0	33.7	7.3	0.000	0.000	0.015	3.426	464779	67.6	3.754	175	11.6	11.8	34.7	0.015	5642	5356	150m.fbmy8028.cy9c_128gram_64kiops
2184	256117	0	0.0	1882.0	61.1	0.000	0.000	0.862	28.645	951657	64.4	3.716	80	34.3	79.9	0.0	0.019	11683	11587	150m.pg151.cx7_128gram_64kiops
2184	199270	0	0.0	1884.4	61.1	0.000	0.000	0.863	28.667	748178	64.6	3.755	104	34.3	79.9	0.0	0.017	9078	8998	150m.pg151.cx7_128gram_64kiops_noprep
q500.1
q500.1: range queries with 500 insert/s per client. Graphs for performance per 1-second interval are here.
Average throughput:
Query response time histogram: each cell has the percentage of responses that take <= the time in the header and max is the max response time in seconds. For max values in the top 25% of the range have a red background and in the bottom 25% of the range have a green background. The red background is not used when the min value is within 80% of the max value.
| dbms | 256us | 1ms | 4ms | 16ms | 64ms | 256ms | 1s | 4s | 16s | gt | max |
|---|---|---|---|---|---|---|---|---|---|---|---|
| my8031.cy8_128gram_64kiops | 99.285 | 0.688 | 0.025 | 0.001 | 0.015 | ||||||
| fbmy8028.cy9c_128gram_64kiops | 97.898 | 2.090 | 0.012 | nonzero | nonzero | 0.022 | |||||
| pg151.cx7_128gram_64kiops | 99.940 | 0.041 | 0.019 | 0.001 | nonzero | 0.057 | |||||
| pg151.cx7_128gram_64kiops_noprep | 99.901 | 0.075 | 0.023 | 0.001 | nonzero | 0.021 |
Insert response time histogram: each cell has the percentage of responses that take <= the time in the header and max is the max response time in seconds. For max values in the top 25% of the range have a red background and in the bottom 25% of the range have a green background. The red background is not used when the min value is within 80% of the max value.
| dbms | 256us | 1ms | 4ms | 16ms | 64ms | 256ms | 1s | 4s | 16s | gt | max |
|---|---|---|---|---|---|---|---|---|---|---|---|
| my8031.cy8_128gram_64kiops | 80.873 | 19.116 | 0.011 | 0.027 | |||||||
| fbmy8028.cy9c_128gram_64kiops | 6.826 | 75.275 | 17.884 | 0.015 | 0.026 | ||||||
| pg151.cx7_128gram_64kiops | 0.163 | 76.900 | 19.946 | 2.989 | 0.003 | 0.098 | |||||
| pg151.cx7_128gram_64kiops_noprep | 0.145 | 77.023 | 19.797 | 3.033 | 0.002 | 0.079 |
Performance metrics for the DBMS listed above. Some are normalized by throughput, others are not. Legend for results is here.
ips	qps	rps	rmbps	wps	wmbps	rpq	rkbpq	wpi	wkbpi	csps	cpups	cspq	cpupq	dbgb1	dbgb2	rss	maxop	p50	p99	tag
10924	145792	0	0.0	409.7	17.6	0.000	0.000	0.038	1.654	542871	66.8	3.724	147	37.5	166.0	41.6	0.015	6635	6569	150m.my8031.cy8_128gram_64kiops
10921	121898	0	0.0	95.3	22.2	0.000	0.000	0.009	2.085	453778	68.5	3.723	180	14.4	15.6	82.4	0.022	5577	5258	150m.fbmy8028.cy9c_128gram_64kiops
10924	251034	0	0.0	1538.3	109.5	0.000	0.000	0.141	10.262	930511	64.6	3.707	82	39.4	75.0	0.0	0.057	11479	11188	150m.pg151.cx7_128gram_64kiops
10927	195671	0	0.0	1541.1	109.5	0.000	0.000	0.141	10.265	733257	65.4	3.747	107	39.4	75.1	0.0	0.021	8918	8727	150m.pg151.cx7_128gram_64kiops_noprep
q1000.1
q1000.1: range queries with 1000 insert/s per client. Graphs for performance per 1-second interval are here.
Average throughput:
Query response time histogram: each cell has the percentage of responses that take <= the time in the header and max is the max response time in seconds. For max values in the top 25% of the range have a red background and in the bottom 25% of the range have a green background. The red background is not used when the min value is within 80% of the max value.
| dbms | 256us | 1ms | 4ms | 16ms | 64ms | 256ms | 1s | 4s | 16s | gt | max |
|---|---|---|---|---|---|---|---|---|---|---|---|
| my8031.cy8_128gram_64kiops | 99.229 | 0.744 | 0.026 | 0.001 | nonzero | 0.020 | |||||
| fbmy8028.cy9c_128gram_64kiops | 97.831 | 2.147 | 0.022 | 0.001 | nonzero | 0.027 | |||||
| pg151.cx7_128gram_64kiops | 99.888 | 0.079 | 0.031 | 0.002 | nonzero | 0.027 | |||||
| pg151.cx7_128gram_64kiops_noprep | 99.836 | 0.123 | 0.038 | 0.003 | nonzero | nonzero | 0.234 |
Insert response time histogram: each cell has the percentage of responses that take <= the time in the header and max is the max response time in seconds. For max values in the top 25% of the range have a red background and in the bottom 25% of the range have a green background. The red background is not used when the min value is within 80% of the max value.
| dbms | 256us | 1ms | 4ms | 16ms | 64ms | 256ms | 1s | 4s | 16s | gt | max |
|---|---|---|---|---|---|---|---|---|---|---|---|
| my8031.cy8_128gram_64kiops | 90.890 | 9.061 | 0.049 | 0.034 | |||||||
| fbmy8028.cy9c_128gram_64kiops | 12.393 | 63.174 | 24.389 | 0.044 | 0.031 | ||||||
| pg151.cx7_128gram_64kiops | 0.225 | 81.497 | 15.881 | 2.394 | 0.002 | 0.104 | |||||
| pg151.cx7_128gram_64kiops_noprep | 0.483 | 85.458 | 12.147 | 1.908 | 0.004 | 0.243 |
Performance metrics for the DBMS listed above. Some are normalized by throughput, others are not. Legend for results is here.
ips	qps	rps	rmbps	wps	wmbps	rpq	rkbpq	wpi	wkbpi	csps	cpups	cspq	cpupq	dbgb1	dbgb2	rss	maxop	p50	p99	tag
21854	144898	0	0.0	1057.7	41.3	0.000	0.000	0.048	1.934	531154	68.1	3.666	150	53.5	182.1	56.2	0.020	6571	6473	150m.my8031.cy8_128gram_64kiops
21848	118668	0	0.0	204.7	46.9	0.000	0.000	0.009	2.200	431553	70.1	3.637	189	19.9	21.3	82.7	0.027	5403	5115	150m.fbmy8028.cy9c_128gram_64kiops
21848	253315	0	0.0	2002.5	176.0	0.000	0.000	0.092	8.248	921338	65.5	3.637	83	63.8	112.6	0.0	0.027	11556	10916	150m.pg151.cx7_128gram_64kiops
21854	194225	0	0.0	2006.6	176.1	0.000	0.000	0.092	8.251	721295	66.2	3.714	109	63.8	112.6	0.0	0.234	8889	8471	150m.pg151.cx7_128gram_64kiops_noprep
l.i0
l.i0: load without secondary indexes
Performance metrics for all DBMS, not just the ones listed above. Some are normalized by throughput, others are not. Legend for results is here.
ips	qps	rps	rmbps	wps	wmbps	rpq	rkbpq	wpi	wkbpi	csps	cpups	cspq	cpupq	dbgb1	dbgb2	rss	maxop	p50	p99	tag
1278751	0	0	0.0	1917.1	334.9	0.000	0.000	0.001	0.268	184626	58.2	0.144	15	7.0	135.6	14.6	0.125	113779	12187	150m.my8031.cy8_128gram_64kiops
845626	0	0	0.0	1333.0	302.9	0.000	0.000	0.002	0.367	300532	59.7	0.355	23	4.0	4.6	1.9	0.097	46662	3097	150m.fbmy8028.cy9c_128gram_64kiops
1497966	0	0	0.0	2636.5	615.8	0.000	0.000	0.002	0.421	167862	54.5	0.112	12	10.0	27.1	9.5	0.034	161665	31966	150m.pg151.cx7_128gram_64kiops
1497966	0	0	0.0	2638.1	616.3	0.000	0.000	0.002	0.421	166840	52.7	0.111	11	10.0	27.1	9.6	0.033	161129	999	150m.pg151.cx7_128gram_64kiops_noprep
l.x
l.x: create secondary indexes
Performance metrics for all DBMS, not just the ones listed above. Some are normalized by throughput, others are not. Legend for results is here.
ips	qps	rps	rmbps	wps	wmbps	rpq	rkbpq	wpi	wkbpi	csps	cpups	cspq	cpupq	dbgb1	dbgb2	rss	maxop	p50	p99	tag
690510	0	3862	247.6	13429.0	634.2	0.006	0.367	0.019	0.940	152756	30.8	0.221	14	15.6	144.1	19.3	0.003	NA	NA	150m.my8031.cy8_128gram_64kiops
1543494	0	4	0.3	1310.0	298.2	0.000	0.000	0.001	0.198	9243	53.0	0.006	11	7.2	7.8	11.5	0.004	NA	NA	150m.fbmy8028.cy9c_128gram_64kiops
2998788	0	0	0.0	3392.1	822.8	0.000	0.000	0.001	0.281	53053	26.5	0.018	3	19.3	44.8	0.0	0.048	NA	NA	150m.pg151.cx7_128gram_64kiops
2915489	0	0	0.0	3354.8	813.0	0.000	0.000	0.001	0.286	49801	24.0	0.017	3	19.3	44.8	0.0	0.085	NA	NA	150m.pg151.cx7_128gram_64kiops_noprep
l.i1
l.i1: continue load after secondary indexes created
Performance metrics for all DBMS, not just the ones listed above. Some are normalized by throughput, others are not. Legend for results is here.
ips	qps	rps	rmbps	wps	wmbps	rpq	rkbpq	wpi	wkbpi	csps	cpups	cspq	cpupq	dbgb1	dbgb2	rss	maxop	p50	p99	tag
534988	0	5018	78.4	3482.1	422.6	0.009	0.150	0.007	0.809	182068	58.5	0.340	35	27.7	156.2	32.8	0.453	33224	300	150m.my8031.cy8_128gram_64kiops
263461	0	162	20.0	1408.7	325.5	0.001	0.078	0.005	1.265	100436	37.0	0.381	45	18.7	20.0	13.2	0.076	12387	11238	150m.fbmy8028.cy9c_128gram_64kiops
624152	0	0	0.0	3255.5	767.8	0.000	0.000	0.005	1.260	288082	58.4	0.462	30	33.6	82.3	21.8	0.038	39219	22782	150m.pg151.cx7_128gram_64kiops
624152	0	0	0.0	3255.2	767.9	0.000	0.000	0.005	1.260	285818	57.1	0.458	29	33.6	82.3	21.8	0.040	39608	4945	150m.pg151.cx7_128gram_64kiops_noprep
q100.1
q100.1: range queries with 100 insert/s per client
Performance metrics for all DBMS, not just the ones listed above. Some are normalized by throughput, others are not. Legend for results is here.
ips	qps	rps	rmbps	wps	wmbps	rpq	rkbpq	wpi	wkbpi	csps	cpups	cspq	cpupq	dbgb1	dbgb2	rss	maxop	p50	p99	tag
2185	147313	0	0.0	408.8	11.9	0.000	0.000	0.187	5.584	552886	66.4	3.753	144	28.2	156.8	33.3	0.023	6713	6649	150m.my8031.cy8_128gram_64kiops
2184	123811	0	0.0	33.7	7.3	0.000	0.000	0.015	3.426	464779	67.6	3.754	175	11.6	11.8	34.7	0.015	5642	5356	150m.fbmy8028.cy9c_128gram_64kiops
2184	256117	0	0.0	1882.0	61.1	0.000	0.000	0.862	28.645	951657	64.4	3.716	80	34.3	79.9	0.0	0.019	11683	11587	150m.pg151.cx7_128gram_64kiops
2184	199270	0	0.0	1884.4	61.1	0.000	0.000	0.863	28.667	748178	64.6	3.755	104	34.3	79.9	0.0	0.017	9078	8998	150m.pg151.cx7_128gram_64kiops_noprep
q500.1
q500.1: range queries with 500 insert/s per client
Performance metrics for all DBMS, not just the ones listed above. Some are normalized by throughput, others are not. Legend for results is here.
ips	qps	rps	rmbps	wps	wmbps	rpq	rkbpq	wpi	wkbpi	csps	cpups	cspq	cpupq	dbgb1	dbgb2	rss	maxop	p50	p99	tag
10924	145792	0	0.0	409.7	17.6	0.000	0.000	0.038	1.654	542871	66.8	3.724	147	37.5	166.0	41.6	0.015	6635	6569	150m.my8031.cy8_128gram_64kiops
10921	121898	0	0.0	95.3	22.2	0.000	0.000	0.009	2.085	453778	68.5	3.723	180	14.4	15.6	82.4	0.022	5577	5258	150m.fbmy8028.cy9c_128gram_64kiops
10924	251034	0	0.0	1538.3	109.5	0.000	0.000	0.141	10.262	930511	64.6	3.707	82	39.4	75.0	0.0	0.057	11479	11188	150m.pg151.cx7_128gram_64kiops
10927	195671	0	0.0	1541.1	109.5	0.000	0.000	0.141	10.265	733257	65.4	3.747	107	39.4	75.1	0.0	0.021	8918	8727	150m.pg151.cx7_128gram_64kiops_noprep
q1000.1
q1000.1: range queries with 1000 insert/s per client
Performance metrics for all DBMS, not just the ones listed above. Some are normalized by throughput, others are not. Legend for results is here.
ips	qps	rps	rmbps	wps	wmbps	rpq	rkbpq	wpi	wkbpi	csps	cpups	cspq	cpupq	dbgb1	dbgb2	rss	maxop	p50	p99	tag
21854	144898	0	0.0	1057.7	41.3	0.000	0.000	0.048	1.934	531154	68.1	3.666	150	53.5	182.1	56.2	0.020	6571	6473	150m.my8031.cy8_128gram_64kiops
21848	118668	0	0.0	204.7	46.9	0.000	0.000	0.009	2.200	431553	70.1	3.637	189	19.9	21.3	82.7	0.027	5403	5115	150m.fbmy8028.cy9c_128gram_64kiops
21848	253315	0	0.0	2002.5	176.0	0.000	0.000	0.092	8.248	921338	65.5	3.637	83	63.8	112.6	0.0	0.027	11556	10916	150m.pg151.cx7_128gram_64kiops
21854	194225	0	0.0	2006.6	176.1	0.000	0.000	0.092	8.251	721295	66.2	3.714	109	63.8	112.6	0.0	0.234	8889	8471	150m.pg151.cx7_128gram_64kiops_noprep
l.i0
- l.i0: load without secondary indexes
- Legend for results is here.
- Each entry lists the percentage of responses that fit in that bucket (slower than max time for previous bucket, faster than min time for next bucket).
Insert response time histogram
256us	1ms	4ms	16ms	64ms	256ms	1s	4s	16s	gt	max	tag
0.000	70.403	29.338	0.191	0.028	0.041	0.000	0.000	0.000	0.000	0.125	my8031.cy8_128gram_64kiops
0.000	10.118	88.361	1.451	0.062	0.008	0.000	0.000	0.000	0.000	0.097	fbmy8028.cy9c_128gram_64kiops
0.000	86.968	12.731	0.074	0.228	0.000	0.000	0.000	0.000	0.000	0.034	pg151.cx7_128gram_64kiops
0.000	87.229	12.495	0.077	0.198	0.000	0.000	0.000	0.000	0.000	0.033	pg151.cx7_128gram_64kiops_noprep
l.x
- l.x: create secondary indexes
- Legend for results is here.
- Each entry lists the percentage of responses that fit in that bucket (slower than max time for previous bucket, faster than min time for next bucket).
TODO - determine whether there is data for create index response time
l.i1
- l.i1: continue load after secondary indexes created
- Legend for results is here.
- Each entry lists the percentage of responses that fit in that bucket (slower than max time for previous bucket, faster than min time for next bucket).
Insert response time histogram
256us	1ms	4ms	16ms	64ms	256ms	1s	4s	16s	gt	max	tag
0.000	0.175	99.114	0.379	0.221	0.110	0.002	0.000	0.000	0.000	0.453	my8031.cy8_128gram_64kiops
0.000	1.594	50.776	47.589	0.031	0.010	0.000	0.000	0.000	0.000	0.076	fbmy8028.cy9c_128gram_64kiops
0.000	17.975	81.476	0.052	0.498	0.000	0.000	0.000	0.000	0.000	0.038	pg151.cx7_128gram_64kiops
0.000	18.383	81.079	0.036	0.501	0.000	0.000	0.000	0.000	0.000	0.040	pg151.cx7_128gram_64kiops_noprep
q100.1
- q100.1: range queries with 100 insert/s per client
- Legend for results is here.
- Each entry lists the percentage of responses that fit in that bucket (slower than max time for previous bucket, faster than min time for next bucket).
Query response time histogram
256us	1ms	4ms	16ms	64ms	256ms	1s	4s	16s	gt	max	tag
99.360	0.636	0.003	nonzero	nonzero	0.000	0.000	0.000	0.000	0.000	0.023	my8031.cy8_128gram_64kiops
97.987	2.011	0.001	nonzero	0.000	0.000	0.000	0.000	0.000	0.000	0.015	fbmy8028.cy9c_128gram_64kiops
99.989	0.007	0.003	nonzero	nonzero	0.000	0.000	0.000	0.000	0.000	0.019	pg151.cx7_128gram_64kiops
99.970	0.026	0.003	nonzero	nonzero	0.000	0.000	0.000	0.000	0.000	0.017	pg151.cx7_128gram_64kiops_noprep
Insert response time histogram
256us	1ms	4ms	16ms	64ms	256ms	1s	4s	16s	gt	max	tag
0.000	0.000	98.980	1.020	0.000	0.000	0.000	0.000	0.000	0.000	0.010	my8031.cy8_128gram_64kiops
0.000	7.374	89.744	2.882	0.001	0.000	0.000	0.000	0.000	0.000	0.019	fbmy8028.cy9c_128gram_64kiops
0.000	0.000	98.136	1.294	0.564	0.006	0.000	0.000	0.000	0.000	0.075	pg151.cx7_128gram_64kiops
0.000	0.000	98.469	1.061	0.470	0.000	0.000	0.000	0.000	0.000	0.037	pg151.cx7_128gram_64kiops_noprep
q500.1
- q500.1: range queries with 500 insert/s per client
- Legend for results is here.
- Each entry lists the percentage of responses that fit in that bucket (slower than max time for previous bucket, faster than min time for next bucket).
Query response time histogram
256us	1ms	4ms	16ms	64ms	256ms	1s	4s	16s	gt	max	tag
99.285	0.688	0.025	0.001	0.000	0.000	0.000	0.000	0.000	0.000	0.015	my8031.cy8_128gram_64kiops
97.898	2.090	0.012	nonzero	nonzero	0.000	0.000	0.000	0.000	0.000	0.022	fbmy8028.cy9c_128gram_64kiops
99.940	0.041	0.019	0.001	nonzero	0.000	0.000	0.000	0.000	0.000	0.057	pg151.cx7_128gram_64kiops
99.901	0.075	0.023	0.001	nonzero	0.000	0.000	0.000	0.000	0.000	0.021	pg151.cx7_128gram_64kiops_noprep
Insert response time histogram
256us	1ms	4ms	16ms	64ms	256ms	1s	4s	16s	gt	max	tag
0.000	0.000	80.873	19.116	0.011	0.000	0.000	0.000	0.000	0.000	0.027	my8031.cy8_128gram_64kiops
0.000	6.826	75.275	17.884	0.015	0.000	0.000	0.000	0.000	0.000	0.026	fbmy8028.cy9c_128gram_64kiops
0.000	0.163	76.900	19.946	2.989	0.003	0.000	0.000	0.000	0.000	0.098	pg151.cx7_128gram_64kiops
0.000	0.145	77.023	19.797	3.033	0.002	0.000	0.000	0.000	0.000	0.079	pg151.cx7_128gram_64kiops_noprep
q1000.1
- q1000.1: range queries with 1000 insert/s per client
- Legend for results is here.
- Each entry lists the percentage of responses that fit in that bucket (slower than max time for previous bucket, faster than min time for next bucket).
Query response time histogram
256us	1ms	4ms	16ms	64ms	256ms	1s	4s	16s	gt	max	tag
99.229	0.744	0.026	0.001	nonzero	0.000	0.000	0.000	0.000	0.000	0.020	my8031.cy8_128gram_64kiops
97.831	2.147	0.022	0.001	nonzero	0.000	0.000	0.000	0.000	0.000	0.027	fbmy8028.cy9c_128gram_64kiops
99.888	0.079	0.031	0.002	nonzero	0.000	0.000	0.000	0.000	0.000	0.027	pg151.cx7_128gram_64kiops
99.836	0.123	0.038	0.003	nonzero	nonzero	0.000	0.000	0.000	0.000	0.234	pg151.cx7_128gram_64kiops_noprep
Insert response time histogram
256us	1ms	4ms	16ms	64ms	256ms	1s	4s	16s	gt	max	tag
0.000	0.000	90.890	9.061	0.049	0.000	0.000	0.000	0.000	0.000	0.034	my8031.cy8_128gram_64kiops
0.000	12.393	63.174	24.389	0.044	0.000	0.000	0.000	0.000	0.000	0.031	fbmy8028.cy9c_128gram_64kiops
0.000	0.225	81.497	15.881	2.394	0.002	0.000	0.000	0.000	0.000	0.104	pg151.cx7_128gram_64kiops
0.000	0.483	85.458	12.147	1.908	0.004	0.000	0.000	0.000	0.000	0.243	pg151.cx7_128gram_64kiops_noprep