Introduction
This is a report for the insert benchmark with 20M docs and 3 client(s). It is generated by scripts (bash, awk, sed) and Tufte might not be impressed. An overview of the insert benchmark is here and a short update is here. Below, by DBMS, I mean DBMS+version.config. An example is my8020.c10b40 where my means MySQL, 8020 is version 8.0.20 and c10b40 is the name for the configuration file.
The test server has 8 AMD cores, 16G RAM and an NVMe SSD. It is described here. The benchmark was run with 3 clients and there were 1 or 2 connections per client (1 for queries, 1 for inserts). The benchmark loads 20M rows without secondary indexes, creates secondary indexes, loads another 20M rows then does 3 read+write tests for one hour each that do queries as fast as possible with 100, 500 and then 1000 writes/second/client concurrent with the queries. The database is cached by the storage engine and the only IO is for writes. Clients and the DBMS share one server. The per-database configs are in the per-database subdirectories here.
The tested DBMS are:
- pg1211.cx7 - Postgres 12.11 and the cx7 config
- pg137.cx7 - Postgres 13.7 and the cx7 config
- pg146.cx7 - Postgres 14.6 and the cx7 config
- pg151.cx7 - Postgres 15.1 and the cx7 config
Contents
- Summary
- l.i0: load without secondary indexes
- l.x: create secondary indexes
- l.i1: continue load after secondary indexes created
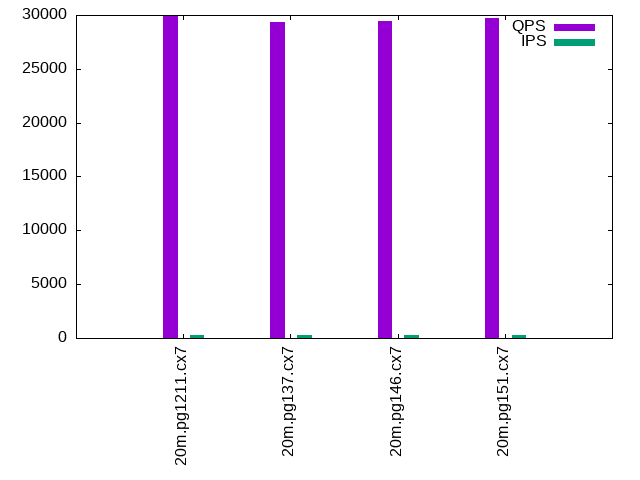
- q100.1: range queries with 100 insert/s per client
- q500.1: range queries with 500 insert/s per client
- q1000.1: range queries with 1000 insert/s per client
Summary
The numbers are inserts/s for l.i0 and l.i1, indexed docs (or rows) /s for l.x and queries/s for q*.2. The values are the average rate over the entire test for inserts (IPS) and queries (QPS). The range of values for IPS and QPS is split into 3 parts: bottom 25%, middle 50%, top 25%. Values in the bottom 25% have a red background, values in the top 25% have a green background and values in the middle have no color. A gray background is used for values that can be ignored because the DBMS did not sustain the target insert rate. Red backgrounds are not used when the minimum value is within 80% of the max value.
| dbms | l.i0 | l.x | l.i1 | q100.1 | q500.1 | q1000.1 |
|---|---|---|---|---|---|---|
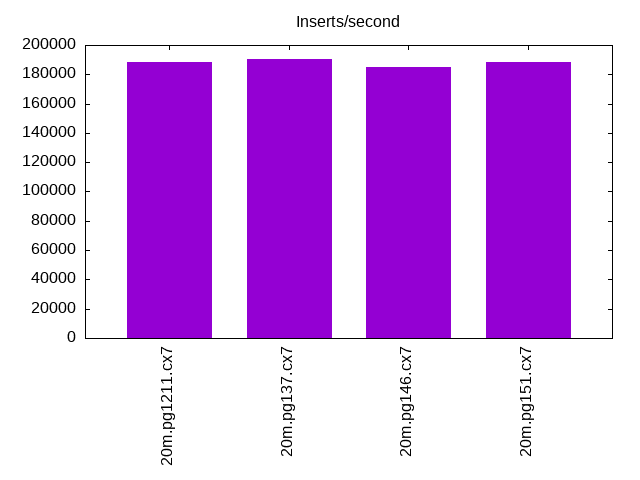
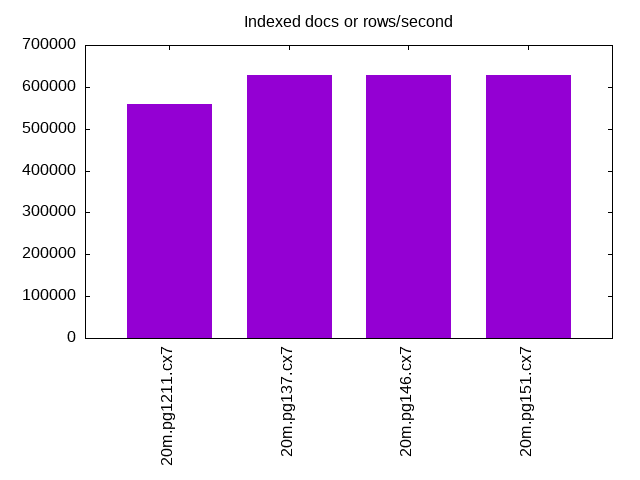
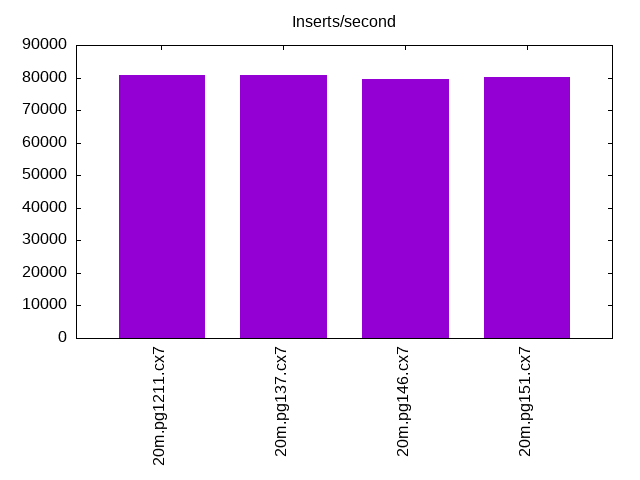
| 20m.pg1211.cx7 | 188679 | 558333 | 80645 | 29987 | 30302 | 30186 |
| 20m.pg137.cx7 | 190476 | 628125 | 80645 | 29386 | 29659 | 29800 |
| 20m.pg146.cx7 | 185185 | 628125 | 79681 | 29449 | 29674 | 29709 |
| 20m.pg151.cx7 | 188679 | 628125 | 80321 | 29678 | 30317 | 30226 |
This lists the average rate of inserts/s for the tests that do inserts concurrent with queries. For such tests the query rate is listed in the table above. The read+write tests are setup so that the insert rate should match the target rate every second. Cells that are not at least 95% of the target have a red background to indicate a failure to satisfy the target.
| dbms | q100.1 | q500.1 | q1000.1 |
|---|---|---|---|
| pg1211.cx7 | 300 | 1497 | 2995 |
| pg137.cx7 | 300 | 1498 | 2995 |
| pg146.cx7 | 300 | 1498 | 2995 |
| pg151.cx7 | 300 | 1498 | 2995 |
| target | 300 | 1500 | 3000 |
l.i0
l.i0: load without secondary indexes. Graphs for performance per 1-second interval are here.
Average throughput:
Insert response time histogram: each cell has the percentage of responses that take <= the time in the header and max is the max response time in seconds. For the max column values in the top 25% of the range have a red background and in the bottom 25% of the range have a green background. The red background is not used when the min value is within 80% of the max value.
| dbms | 256us | 1ms | 4ms | 16ms | 64ms | 256ms | 1s | 4s | 16s | gt | max |
|---|---|---|---|---|---|---|---|---|---|---|---|
| pg1211.cx7 | 99.999 | 0.001 | 0.010 | ||||||||
| pg137.cx7 | 99.999 | 0.001 | 0.006 | ||||||||
| pg146.cx7 | 99.997 | 0.003 | 0.009 | ||||||||
| pg151.cx7 | 99.998 | 0.002 | 0.006 |
Performance metrics for the DBMS listed above. Some are normalized by throughput, others are not. Legend for results is here.
ips	qps	rps	rmbps	wps	wmbps	rpq	rkbpq	wpi	wkbpi	csps	cpups	cspq	cpupq	dbgb1	dbgb2	rss	maxop	p50	p99	tag
188679	0	0	0.0	371.8	78.1	0.000	0.000	0.002	0.424	19952	54.8	0.106	23	1.9	5.2	0.0	0.010	70724	22675	20m.pg1211.cx7
190476	0	0	0.0	383.9	80.8	0.000	0.000	0.002	0.434	21369	57.7	0.112	24	1.9	5.2	0.0	0.006	72321	24972	20m.pg137.cx7
185185	0	0	0.0	368.7	77.3	0.000	0.000	0.002	0.427	19764	55.5	0.107	24	1.9	5.2	0.0	0.009	69525	63231	20m.pg146.cx7
188679	0	0	0.0	381.2	80.1	0.000	0.000	0.002	0.435	19773	55.0	0.105	23	1.9	5.2	0.0	0.006	71322	32863	20m.pg151.cx7
l.x
l.x: create secondary indexes.
Average throughput:
Performance metrics for the DBMS listed above. Some are normalized by throughput, others are not. Legend for results is here.
ips	qps	rps	rmbps	wps	wmbps	rpq	rkbpq	wpi	wkbpi	csps	cpups	cspq	cpupq	dbgb1	dbgb2	rss	maxop	p50	p99	tag
558333	0	0	0.0	599.5	145.0	0.000	0.000	0.001	0.266	2134	29.6	0.004	4	3.7	8.6	0.0	0.004	NA	NA	20m.pg1211.cx7
628125	0	0	0.0	571.9	138.5	0.000	0.000	0.001	0.226	1999	31.9	0.003	4	3.7	8.6	0.0	0.004	NA	NA	20m.pg137.cx7
628125	0	0	0.0	547.9	132.6	0.000	0.000	0.001	0.216	1963	31.7	0.003	4	3.7	8.6	0.0	0.004	NA	NA	20m.pg146.cx7
628125	0	0	0.0	631.6	152.8	0.000	0.000	0.001	0.249	1923	31.0	0.003	4	3.7	8.6	0.0	0.004	NA	NA	20m.pg151.cx7
l.i1
l.i1: continue load after secondary indexes created. Graphs for performance per 1-second interval are here.
Average throughput:
Insert response time histogram: each cell has the percentage of responses that take <= the time in the header and max is the max response time in seconds. For the max column values in the top 25% of the range have a red background and in the bottom 25% of the range have a green background. The red background is not used when the min value is within 80% of the max value.
| dbms | 256us | 1ms | 4ms | 16ms | 64ms | 256ms | 1s | 4s | 16s | gt | max |
|---|---|---|---|---|---|---|---|---|---|---|---|
| pg1211.cx7 | 99.813 | 0.053 | 0.113 | 0.021 | 0.113 | ||||||
| pg137.cx7 | 99.821 | 0.049 | 0.096 | 0.033 | 0.001 | 0.285 | |||||
| pg146.cx7 | 99.838 | 0.064 | 0.069 | 0.028 | 0.002 | 0.344 | |||||
| pg151.cx7 | 99.850 | 0.043 | 0.090 | 0.017 | 0.103 |
Performance metrics for the DBMS listed above. Some are normalized by throughput, others are not. Legend for results is here.
ips	qps	rps	rmbps	wps	wmbps	rpq	rkbpq	wpi	wkbpi	csps	cpups	cspq	cpupq	dbgb1	dbgb2	rss	maxop	p50	p99	tag
80645	0	0	0.0	581.9	124.8	0.000	0.000	0.007	1.584	18504	48.3	0.229	48	8.0	24.0	0.0	0.113	28968	4894	20m.pg1211.cx7
80645	0	0	0.0	601.0	128.3	0.000	0.000	0.007	1.630	18648	48.3	0.231	48	8.0	24.4	0.0	0.285	29128	3396	20m.pg137.cx7
79681	0	0	0.0	560.9	119.3	0.000	0.000	0.007	1.533	18215	48.9	0.229	49	8.0	24.4	0.0	0.344	28529	1548	20m.pg146.cx7
80321	0	0	0.0	565.0	119.6	0.000	0.000	0.007	1.524	18477	49.4	0.230	49	8.0	24.3	0.0	0.103	28668	4548	20m.pg151.cx7
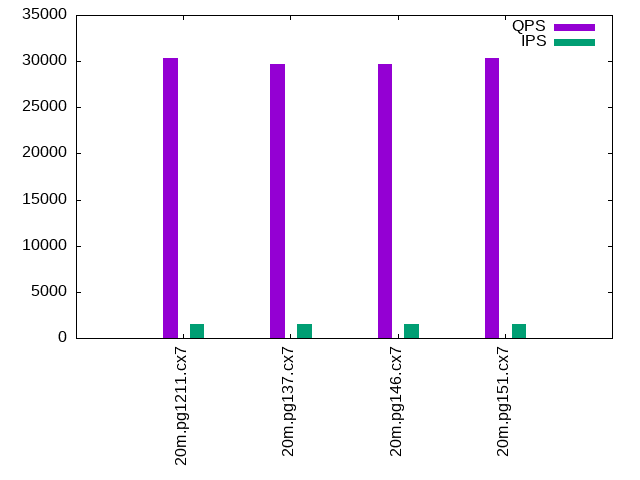
q100.1
q100.1: range queries with 100 insert/s per client. Graphs for performance per 1-second interval are here.
Average throughput:
Query response time histogram: each cell has the percentage of responses that take <= the time in the header and max is the max response time in seconds. For max values in the top 25% of the range have a red background and in the bottom 25% of the range have a green background. The red background is not used when the min value is within 80% of the max value.
| dbms | 256us | 1ms | 4ms | 16ms | 64ms | 256ms | 1s | 4s | 16s | gt | max |
|---|---|---|---|---|---|---|---|---|---|---|---|
| pg1211.cx7 | 99.963 | 0.034 | 0.003 | nonzero | 0.007 | ||||||
| pg137.cx7 | 99.961 | 0.035 | 0.004 | nonzero | 0.006 | ||||||
| pg146.cx7 | 99.954 | 0.042 | 0.004 | nonzero | 0.006 | ||||||
| pg151.cx7 | 99.964 | 0.033 | 0.003 | nonzero | 0.006 |
Insert response time histogram: each cell has the percentage of responses that take <= the time in the header and max is the max response time in seconds. For max values in the top 25% of the range have a red background and in the bottom 25% of the range have a green background. The red background is not used when the min value is within 80% of the max value.
| dbms | 256us | 1ms | 4ms | 16ms | 64ms | 256ms | 1s | 4s | 16s | gt | max |
|---|---|---|---|---|---|---|---|---|---|---|---|
| pg1211.cx7 | 99.685 | 0.315 | 0.007 | ||||||||
| pg137.cx7 | 99.194 | 0.806 | 0.008 | ||||||||
| pg146.cx7 | 99.468 | 0.532 | 0.009 | ||||||||
| pg151.cx7 | 99.648 | 0.352 | 0.008 |
Performance metrics for the DBMS listed above. Some are normalized by throughput, others are not. Legend for results is here.
ips	qps	rps	rmbps	wps	wmbps	rpq	rkbpq	wpi	wkbpi	csps	cpups	cspq	cpupq	dbgb1	dbgb2	rss	maxop	p50	p99	tag
300	29987	0	0.0	414.2	11.1	0.000	0.000	1.383	37.808	114826	38.8	3.829	104	8.3	15.7	0.0	0.007	10872	7688	20m.pg1211.cx7
300	29386	0	0.0	412.3	10.7	0.000	0.000	1.377	36.556	112524	38.7	3.829	105	8.3	15.7	0.0	0.006	10533	7671	20m.pg137.cx7
300	29449	0	0.0	390.0	10.5	0.000	0.000	1.302	35.982	112739	38.3	3.828	104	8.3	17.5	0.0	0.006	10564	7512	20m.pg146.cx7
300	29678	0	0.0	390.0	10.5	0.000	0.000	1.302	36.009	113582	38.3	3.827	103	8.3	17.5	0.0	0.006	10633	7691	20m.pg151.cx7
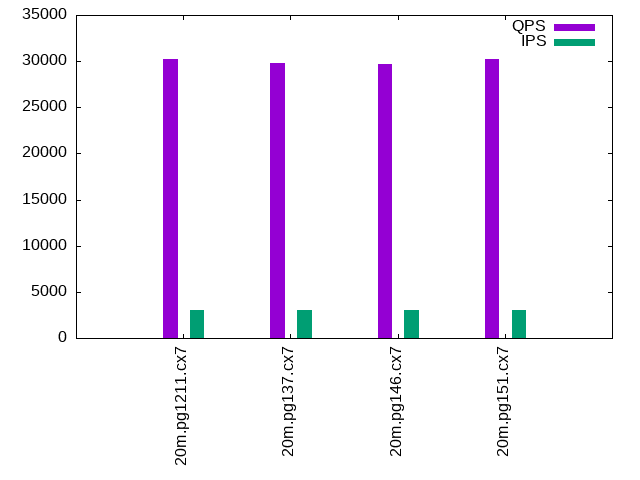
q500.1
q500.1: range queries with 500 insert/s per client. Graphs for performance per 1-second interval are here.
Average throughput:
Query response time histogram: each cell has the percentage of responses that take <= the time in the header and max is the max response time in seconds. For max values in the top 25% of the range have a red background and in the bottom 25% of the range have a green background. The red background is not used when the min value is within 80% of the max value.
| dbms | 256us | 1ms | 4ms | 16ms | 64ms | 256ms | 1s | 4s | 16s | gt | max |
|---|---|---|---|---|---|---|---|---|---|---|---|
| pg1211.cx7 | 99.930 | 0.057 | 0.012 | 0.001 | nonzero | 0.053 | |||||
| pg137.cx7 | 99.931 | 0.058 | 0.010 | nonzero | nonzero | 0.042 | |||||
| pg146.cx7 | 99.916 | 0.069 | 0.014 | 0.001 | nonzero | 0.047 | |||||
| pg151.cx7 | 99.932 | 0.054 | 0.013 | nonzero | nonzero | 0.041 |
Insert response time histogram: each cell has the percentage of responses that take <= the time in the header and max is the max response time in seconds. For max values in the top 25% of the range have a red background and in the bottom 25% of the range have a green background. The red background is not used when the min value is within 80% of the max value.
| dbms | 256us | 1ms | 4ms | 16ms | 64ms | 256ms | 1s | 4s | 16s | gt | max |
|---|---|---|---|---|---|---|---|---|---|---|---|
| pg1211.cx7 | 96.970 | 2.926 | 0.093 | 0.011 | 0.131 | ||||||
| pg137.cx7 | 98.330 | 1.612 | 0.050 | 0.008 | 0.114 | ||||||
| pg146.cx7 | 97.314 | 2.610 | 0.066 | 0.010 | 0.109 | ||||||
| pg151.cx7 | 96.562 | 3.305 | 0.120 | 0.013 | 0.132 |
Performance metrics for the DBMS listed above. Some are normalized by throughput, others are not. Legend for results is here.
ips	qps	rps	rmbps	wps	wmbps	rpq	rkbpq	wpi	wkbpi	csps	cpups	cspq	cpupq	dbgb1	dbgb2	rss	maxop	p50	p99	tag
1497	30302	5	0.0	486.9	25.1	0.000	0.002	0.325	17.180	116096	39.6	3.831	105	10.3	16.1	0.0	0.053	10628	7799	20m.pg1211.cx7
1498	29659	5	0.0	480.0	25.0	0.000	0.002	0.321	17.108	113702	39.7	3.834	107	10.3	16.0	0.0	0.042	10296	7723	20m.pg137.cx7
1498	29674	5	0.0	520.7	23.5	0.000	0.002	0.348	16.050	113589	39.2	3.828	106	10.3	17.5	0.0	0.047	10341	7623	20m.pg146.cx7
1498	30317	5	0.0	517.5	23.4	0.000	0.002	0.345	16.027	115933	39.2	3.824	103	10.3	17.5	0.0	0.041	10549	7768	20m.pg151.cx7
q1000.1
q1000.1: range queries with 1000 insert/s per client. Graphs for performance per 1-second interval are here.
Average throughput:
Query response time histogram: each cell has the percentage of responses that take <= the time in the header and max is the max response time in seconds. For max values in the top 25% of the range have a red background and in the bottom 25% of the range have a green background. The red background is not used when the min value is within 80% of the max value.
| dbms | 256us | 1ms | 4ms | 16ms | 64ms | 256ms | 1s | 4s | 16s | gt | max |
|---|---|---|---|---|---|---|---|---|---|---|---|
| pg1211.cx7 | 99.889 | 0.087 | 0.023 | 0.001 | nonzero | nonzero | 0.073 | ||||
| pg137.cx7 | 99.888 | 0.088 | 0.022 | 0.001 | nonzero | 0.064 | |||||
| pg146.cx7 | 99.875 | 0.099 | 0.025 | 0.001 | nonzero | nonzero | 0.130 | ||||
| pg151.cx7 | 99.890 | 0.085 | 0.024 | 0.001 | nonzero | 0.051 |
Insert response time histogram: each cell has the percentage of responses that take <= the time in the header and max is the max response time in seconds. For max values in the top 25% of the range have a red background and in the bottom 25% of the range have a green background. The red background is not used when the min value is within 80% of the max value.
| dbms | 256us | 1ms | 4ms | 16ms | 64ms | 256ms | 1s | 4s | 16s | gt | max |
|---|---|---|---|---|---|---|---|---|---|---|---|
| pg1211.cx7 | 96.049 | 3.553 | 0.389 | 0.009 | 0.095 | ||||||
| pg137.cx7 | 95.310 | 4.191 | 0.481 | 0.018 | 0.128 | ||||||
| pg146.cx7 | 94.719 | 4.752 | 0.521 | 0.008 | 0.137 | ||||||
| pg151.cx7 | 95.124 | 4.606 | 0.269 | 0.002 | 0.106 |
Performance metrics for the DBMS listed above. Some are normalized by throughput, others are not. Legend for results is here.
ips	qps	rps	rmbps	wps	wmbps	rpq	rkbpq	wpi	wkbpi	csps	cpups	cspq	cpupq	dbgb1	dbgb2	rss	maxop	p50	p99	tag
2995	30186	18	0.3	450.0	37.9	0.001	0.011	0.150	12.973	115414	40.4	3.823	107	12.3	20.5	0.0	0.073	10596	7898	20m.pg1211.cx7
2995	29800	10	0.2	448.0	38.3	0.000	0.006	0.150	13.092	113944	40.5	3.824	109	12.3	21.0	0.0	0.064	10361	7767	20m.pg137.cx7
2995	29709	16	0.1	565.7	33.3	0.001	0.004	0.189	11.386	113519	40.2	3.821	108	12.3	21.3	0.0	0.130	10436	7751	20m.pg146.cx7
2995	30226	10	0.1	563.7	33.4	0.000	0.003	0.188	11.427	115444	40.2	3.819	106	12.3	21.2	0.0	0.051	10484	7802	20m.pg151.cx7
l.i0
l.i0: load without secondary indexes
Performance metrics for all DBMS, not just the ones listed above. Some are normalized by throughput, others are not. Legend for results is here.
ips	qps	rps	rmbps	wps	wmbps	rpq	rkbpq	wpi	wkbpi	csps	cpups	cspq	cpupq	dbgb1	dbgb2	rss	maxop	p50	p99	tag
188679	0	0	0.0	371.8	78.1	0.000	0.000	0.002	0.424	19952	54.8	0.106	23	1.9	5.2	0.0	0.010	70724	22675	20m.pg1211.cx7
190476	0	0	0.0	383.9	80.8	0.000	0.000	0.002	0.434	21369	57.7	0.112	24	1.9	5.2	0.0	0.006	72321	24972	20m.pg137.cx7
185185	0	0	0.0	368.7	77.3	0.000	0.000	0.002	0.427	19764	55.5	0.107	24	1.9	5.2	0.0	0.009	69525	63231	20m.pg146.cx7
188679	0	0	0.0	381.2	80.1	0.000	0.000	0.002	0.435	19773	55.0	0.105	23	1.9	5.2	0.0	0.006	71322	32863	20m.pg151.cx7
l.x
l.x: create secondary indexes
Performance metrics for all DBMS, not just the ones listed above. Some are normalized by throughput, others are not. Legend for results is here.
ips	qps	rps	rmbps	wps	wmbps	rpq	rkbpq	wpi	wkbpi	csps	cpups	cspq	cpupq	dbgb1	dbgb2	rss	maxop	p50	p99	tag
558333	0	0	0.0	599.5	145.0	0.000	0.000	0.001	0.266	2134	29.6	0.004	4	3.7	8.6	0.0	0.004	NA	NA	20m.pg1211.cx7
628125	0	0	0.0	571.9	138.5	0.000	0.000	0.001	0.226	1999	31.9	0.003	4	3.7	8.6	0.0	0.004	NA	NA	20m.pg137.cx7
628125	0	0	0.0	547.9	132.6	0.000	0.000	0.001	0.216	1963	31.7	0.003	4	3.7	8.6	0.0	0.004	NA	NA	20m.pg146.cx7
628125	0	0	0.0	631.6	152.8	0.000	0.000	0.001	0.249	1923	31.0	0.003	4	3.7	8.6	0.0	0.004	NA	NA	20m.pg151.cx7
l.i1
l.i1: continue load after secondary indexes created
Performance metrics for all DBMS, not just the ones listed above. Some are normalized by throughput, others are not. Legend for results is here.
ips	qps	rps	rmbps	wps	wmbps	rpq	rkbpq	wpi	wkbpi	csps	cpups	cspq	cpupq	dbgb1	dbgb2	rss	maxop	p50	p99	tag
80645	0	0	0.0	581.9	124.8	0.000	0.000	0.007	1.584	18504	48.3	0.229	48	8.0	24.0	0.0	0.113	28968	4894	20m.pg1211.cx7
80645	0	0	0.0	601.0	128.3	0.000	0.000	0.007	1.630	18648	48.3	0.231	48	8.0	24.4	0.0	0.285	29128	3396	20m.pg137.cx7
79681	0	0	0.0	560.9	119.3	0.000	0.000	0.007	1.533	18215	48.9	0.229	49	8.0	24.4	0.0	0.344	28529	1548	20m.pg146.cx7
80321	0	0	0.0	565.0	119.6	0.000	0.000	0.007	1.524	18477	49.4	0.230	49	8.0	24.3	0.0	0.103	28668	4548	20m.pg151.cx7
q100.1
q100.1: range queries with 100 insert/s per client
Performance metrics for all DBMS, not just the ones listed above. Some are normalized by throughput, others are not. Legend for results is here.
ips	qps	rps	rmbps	wps	wmbps	rpq	rkbpq	wpi	wkbpi	csps	cpups	cspq	cpupq	dbgb1	dbgb2	rss	maxop	p50	p99	tag
300	29987	0	0.0	414.2	11.1	0.000	0.000	1.383	37.808	114826	38.8	3.829	104	8.3	15.7	0.0	0.007	10872	7688	20m.pg1211.cx7
300	29386	0	0.0	412.3	10.7	0.000	0.000	1.377	36.556	112524	38.7	3.829	105	8.3	15.7	0.0	0.006	10533	7671	20m.pg137.cx7
300	29449	0	0.0	390.0	10.5	0.000	0.000	1.302	35.982	112739	38.3	3.828	104	8.3	17.5	0.0	0.006	10564	7512	20m.pg146.cx7
300	29678	0	0.0	390.0	10.5	0.000	0.000	1.302	36.009	113582	38.3	3.827	103	8.3	17.5	0.0	0.006	10633	7691	20m.pg151.cx7
q500.1
q500.1: range queries with 500 insert/s per client
Performance metrics for all DBMS, not just the ones listed above. Some are normalized by throughput, others are not. Legend for results is here.
ips	qps	rps	rmbps	wps	wmbps	rpq	rkbpq	wpi	wkbpi	csps	cpups	cspq	cpupq	dbgb1	dbgb2	rss	maxop	p50	p99	tag
1497	30302	5	0.0	486.9	25.1	0.000	0.002	0.325	17.180	116096	39.6	3.831	105	10.3	16.1	0.0	0.053	10628	7799	20m.pg1211.cx7
1498	29659	5	0.0	480.0	25.0	0.000	0.002	0.321	17.108	113702	39.7	3.834	107	10.3	16.0	0.0	0.042	10296	7723	20m.pg137.cx7
1498	29674	5	0.0	520.7	23.5	0.000	0.002	0.348	16.050	113589	39.2	3.828	106	10.3	17.5	0.0	0.047	10341	7623	20m.pg146.cx7
1498	30317	5	0.0	517.5	23.4	0.000	0.002	0.345	16.027	115933	39.2	3.824	103	10.3	17.5	0.0	0.041	10549	7768	20m.pg151.cx7
q1000.1
q1000.1: range queries with 1000 insert/s per client
Performance metrics for all DBMS, not just the ones listed above. Some are normalized by throughput, others are not. Legend for results is here.
ips	qps	rps	rmbps	wps	wmbps	rpq	rkbpq	wpi	wkbpi	csps	cpups	cspq	cpupq	dbgb1	dbgb2	rss	maxop	p50	p99	tag
2995	30186	18	0.3	450.0	37.9	0.001	0.011	0.150	12.973	115414	40.4	3.823	107	12.3	20.5	0.0	0.073	10596	7898	20m.pg1211.cx7
2995	29800	10	0.2	448.0	38.3	0.000	0.006	0.150	13.092	113944	40.5	3.824	109	12.3	21.0	0.0	0.064	10361	7767	20m.pg137.cx7
2995	29709	16	0.1	565.7	33.3	0.001	0.004	0.189	11.386	113519	40.2	3.821	108	12.3	21.3	0.0	0.130	10436	7751	20m.pg146.cx7
2995	30226	10	0.1	563.7	33.4	0.000	0.003	0.188	11.427	115444	40.2	3.819	106	12.3	21.2	0.0	0.051	10484	7802	20m.pg151.cx7
l.i0
- l.i0: load without secondary indexes
- Legend for results is here.
- Each entry lists the percentage of responses that fit in that bucket (slower than max time for previous bucket, faster than min time for next bucket).
Insert response time histogram
256us	1ms	4ms	16ms	64ms	256ms	1s	4s	16s	gt	max	tag
0.000	0.000	99.999	0.001	0.000	0.000	0.000	0.000	0.000	0.000	0.010	pg1211.cx7
0.000	0.000	99.999	0.001	0.000	0.000	0.000	0.000	0.000	0.000	0.006	pg137.cx7
0.000	0.000	99.997	0.003	0.000	0.000	0.000	0.000	0.000	0.000	0.009	pg146.cx7
0.000	0.000	99.998	0.002	0.000	0.000	0.000	0.000	0.000	0.000	0.006	pg151.cx7
l.x
- l.x: create secondary indexes
- Legend for results is here.
- Each entry lists the percentage of responses that fit in that bucket (slower than max time for previous bucket, faster than min time for next bucket).
TODO - determine whether there is data for create index response time
l.i1
- l.i1: continue load after secondary indexes created
- Legend for results is here.
- Each entry lists the percentage of responses that fit in that bucket (slower than max time for previous bucket, faster than min time for next bucket).
Insert response time histogram
256us	1ms	4ms	16ms	64ms	256ms	1s	4s	16s	gt	max	tag
0.000	0.000	99.813	0.053	0.113	0.021	0.000	0.000	0.000	0.000	0.113	pg1211.cx7
0.000	0.000	99.821	0.049	0.096	0.033	0.001	0.000	0.000	0.000	0.285	pg137.cx7
0.000	0.000	99.838	0.064	0.069	0.028	0.002	0.000	0.000	0.000	0.344	pg146.cx7
0.000	0.000	99.850	0.043	0.090	0.017	0.000	0.000	0.000	0.000	0.103	pg151.cx7
q100.1
- q100.1: range queries with 100 insert/s per client
- Legend for results is here.
- Each entry lists the percentage of responses that fit in that bucket (slower than max time for previous bucket, faster than min time for next bucket).
Query response time histogram
256us	1ms	4ms	16ms	64ms	256ms	1s	4s	16s	gt	max	tag
99.963	0.034	0.003	nonzero	0.000	0.000	0.000	0.000	0.000	0.000	0.007	pg1211.cx7
99.961	0.035	0.004	nonzero	0.000	0.000	0.000	0.000	0.000	0.000	0.006	pg137.cx7
99.954	0.042	0.004	nonzero	0.000	0.000	0.000	0.000	0.000	0.000	0.006	pg146.cx7
99.964	0.033	0.003	nonzero	0.000	0.000	0.000	0.000	0.000	0.000	0.006	pg151.cx7
Insert response time histogram
256us	1ms	4ms	16ms	64ms	256ms	1s	4s	16s	gt	max	tag
0.000	0.000	99.685	0.315	0.000	0.000	0.000	0.000	0.000	0.000	0.007	pg1211.cx7
0.000	0.000	99.194	0.806	0.000	0.000	0.000	0.000	0.000	0.000	0.008	pg137.cx7
0.000	0.000	99.468	0.532	0.000	0.000	0.000	0.000	0.000	0.000	0.009	pg146.cx7
0.000	0.000	99.648	0.352	0.000	0.000	0.000	0.000	0.000	0.000	0.008	pg151.cx7
q500.1
- q500.1: range queries with 500 insert/s per client
- Legend for results is here.
- Each entry lists the percentage of responses that fit in that bucket (slower than max time for previous bucket, faster than min time for next bucket).
Query response time histogram
256us	1ms	4ms	16ms	64ms	256ms	1s	4s	16s	gt	max	tag
99.930	0.057	0.012	0.001	nonzero	0.000	0.000	0.000	0.000	0.000	0.053	pg1211.cx7
99.931	0.058	0.010	nonzero	nonzero	0.000	0.000	0.000	0.000	0.000	0.042	pg137.cx7
99.916	0.069	0.014	0.001	nonzero	0.000	0.000	0.000	0.000	0.000	0.047	pg146.cx7
99.932	0.054	0.013	nonzero	nonzero	0.000	0.000	0.000	0.000	0.000	0.041	pg151.cx7
Insert response time histogram
256us	1ms	4ms	16ms	64ms	256ms	1s	4s	16s	gt	max	tag
0.000	0.000	96.970	2.926	0.093	0.011	0.000	0.000	0.000	0.000	0.131	pg1211.cx7
0.000	0.000	98.330	1.612	0.050	0.008	0.000	0.000	0.000	0.000	0.114	pg137.cx7
0.000	0.000	97.314	2.610	0.066	0.010	0.000	0.000	0.000	0.000	0.109	pg146.cx7
0.000	0.000	96.562	3.305	0.120	0.013	0.000	0.000	0.000	0.000	0.132	pg151.cx7
q1000.1
- q1000.1: range queries with 1000 insert/s per client
- Legend for results is here.
- Each entry lists the percentage of responses that fit in that bucket (slower than max time for previous bucket, faster than min time for next bucket).
Query response time histogram
256us	1ms	4ms	16ms	64ms	256ms	1s	4s	16s	gt	max	tag
99.889	0.087	0.023	0.001	nonzero	nonzero	0.000	0.000	0.000	0.000	0.073	pg1211.cx7
99.888	0.088	0.022	0.001	nonzero	0.000	0.000	0.000	0.000	0.000	0.064	pg137.cx7
99.875	0.099	0.025	0.001	nonzero	nonzero	0.000	0.000	0.000	0.000	0.130	pg146.cx7
99.890	0.085	0.024	0.001	nonzero	0.000	0.000	0.000	0.000	0.000	0.051	pg151.cx7
Insert response time histogram
256us	1ms	4ms	16ms	64ms	256ms	1s	4s	16s	gt	max	tag
0.000	0.000	96.049	3.553	0.389	0.009	0.000	0.000	0.000	0.000	0.095	pg1211.cx7
0.000	0.000	95.310	4.191	0.481	0.018	0.000	0.000	0.000	0.000	0.128	pg137.cx7
0.000	0.000	94.719	4.752	0.521	0.008	0.000	0.000	0.000	0.000	0.137	pg146.cx7
0.000	0.000	95.124	4.606	0.269	0.002	0.000	0.000	0.000	0.000	0.106	pg151.cx7