Introduction
This is a report for the insert benchmark with 20M docs and 2 client(s). It is generated by scripts (bash, awk, sed) and Tufte might not be impressed. An overview of the insert benchmark is here and a short update is here. Below, by DBMS, I mean DBMS+version.config. An example is my8020.c10b40 where my means MySQL, 8020 is version 8.0.20 and c10b40 is the name for the configuration file.
The test server has 8 AMD cores, 16G RAM and an NVMe SSD. It is described here. The benchmark was run with 2 clients and there were 1 or 2 connections per client (1 for queries, 1 for inserts). The benchmark loads 20M rows without secondary indexes, creates secondary indexes, loads another 20M rows then does 3 read+write tests for one hour each that do queries as fast as possible with 100, 500 and then 1000 writes/second/client concurrent with the queries. The database is cached by the storage engine and the only IO is for writes. Clients and the DBMS share one server. The per-database configs are in the per-database subdirectories here.
The tested DBMS are:
- pg1211.cx7 - Postgres 12.11 and the cx7 config
- pg137.cx7 - Postgres 13.7 and the cx7 config
- pg146.cx7 - Postgres 14.6 and the cx7 config
- pg151.cx7 - Postgres 15.1 and the cx7 config
Contents
- Summary
- l.i0: load without secondary indexes
- l.x: create secondary indexes
- l.i1: continue load after secondary indexes created
- q100.1: range queries with 100 insert/s per client
- q500.1: range queries with 500 insert/s per client
- q1000.1: range queries with 1000 insert/s per client
Summary
The numbers are inserts/s for l.i0 and l.i1, indexed docs (or rows) /s for l.x and queries/s for q*.2. The values are the average rate over the entire test for inserts (IPS) and queries (QPS). The range of values for IPS and QPS is split into 3 parts: bottom 25%, middle 50%, top 25%. Values in the bottom 25% have a red background, values in the top 25% have a green background and values in the middle have no color. A gray background is used for values that can be ignored because the DBMS did not sustain the target insert rate. Red backgrounds are not used when the minimum value is within 80% of the max value.
| dbms | l.i0 | l.x | l.i1 | q100.1 | q500.1 | q1000.1 |
|---|---|---|---|---|---|---|
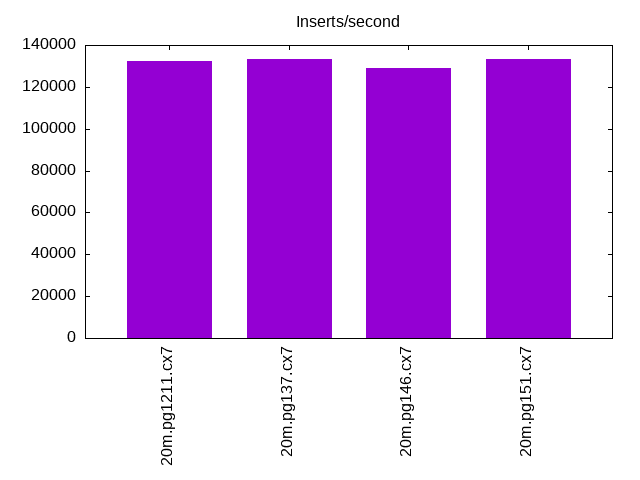
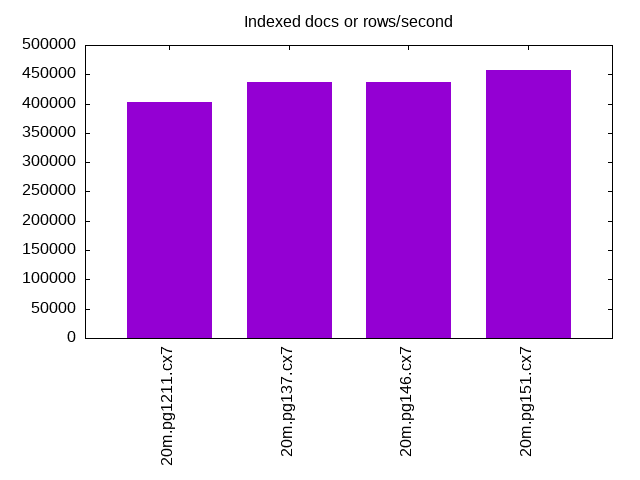
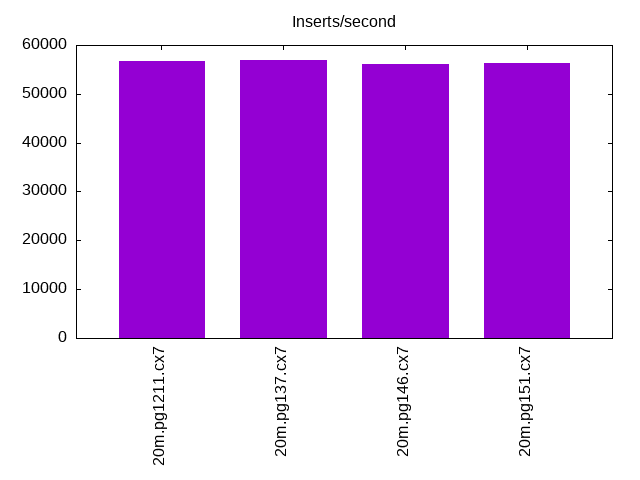
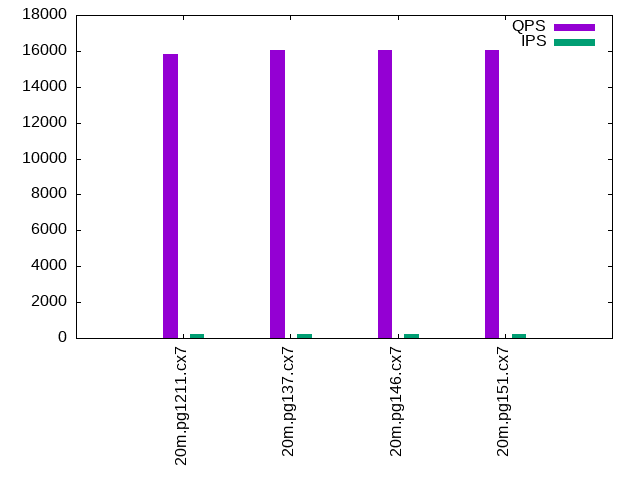
| 20m.pg1211.cx7 | 132450 | 402000 | 56657 | 15847 | 16959 | 17953 |
| 20m.pg137.cx7 | 133333 | 436956 | 56980 | 16050 | 17187 | 17967 |
| 20m.pg146.cx7 | 129032 | 436956 | 56022 | 16065 | 17169 | 17637 |
| 20m.pg151.cx7 | 133333 | 456818 | 56338 | 16047 | 16974 | 17838 |
This lists the average rate of inserts/s for the tests that do inserts concurrent with queries. For such tests the query rate is listed in the table above. The read+write tests are setup so that the insert rate should match the target rate every second. Cells that are not at least 95% of the target have a red background to indicate a failure to satisfy the target.
| dbms | q100.1 | q500.1 | q1000.1 |
|---|---|---|---|
| pg1211.cx7 | 200 | 999 | 1997 |
| pg137.cx7 | 200 | 999 | 1997 |
| pg146.cx7 | 200 | 999 | 1997 |
| pg151.cx7 | 200 | 999 | 1997 |
| target | 200 | 1000 | 2000 |
l.i0
l.i0: load without secondary indexes. Graphs for performance per 1-second interval are here.
Average throughput:
Insert response time histogram: each cell has the percentage of responses that take <= the time in the header and max is the max response time in seconds. For the max column values in the top 25% of the range have a red background and in the bottom 25% of the range have a green background. The red background is not used when the min value is within 80% of the max value.
| dbms | 256us | 1ms | 4ms | 16ms | 64ms | 256ms | 1s | 4s | 16s | gt | max |
|---|---|---|---|---|---|---|---|---|---|---|---|
| pg1211.cx7 | 100.000 | 0.004 | |||||||||
| pg137.cx7 | 100.000 | 0.003 | |||||||||
| pg146.cx7 | 100.000 | 0.003 | |||||||||
| pg151.cx7 | 100.000 | 0.004 |
Performance metrics for the DBMS listed above. Some are normalized by throughput, others are not. Legend for results is here.
ips	qps	rps	rmbps	wps	wmbps	rpq	rkbpq	wpi	wkbpi	csps	cpups	cspq	cpupq	dbgb1	dbgb2	rss	maxop	p50	p99	tag
132450	0	0	0.0	266.7	56.1	0.000	0.000	0.002	0.434	15557	40.8	0.117	25	1.9	5.2	0.0	0.004	71122	38057	20m.pg1211.cx7
133333	0	0	0.0	266.6	56.4	0.000	0.000	0.002	0.433	15664	40.9	0.117	25	1.9	5.2	0.0	0.003	71422	61231	20m.pg137.cx7
129032	0	0	0.0	261.3	55.3	0.000	0.000	0.002	0.439	15343	41.5	0.119	26	1.9	5.2	0.0	0.003	69522	60034	20m.pg146.cx7
133333	0	0	0.0	266.3	56.1	0.000	0.000	0.002	0.431	15633	40.9	0.117	25	1.9	5.2	0.0	0.004	71623	29080	20m.pg151.cx7
l.x
l.x: create secondary indexes.
Average throughput:
Performance metrics for the DBMS listed above. Some are normalized by throughput, others are not. Legend for results is here.
ips	qps	rps	rmbps	wps	wmbps	rpq	rkbpq	wpi	wkbpi	csps	cpups	cspq	cpupq	dbgb1	dbgb2	rss	maxop	p50	p99	tag
402000	0	0	0.0	459.3	111.3	0.000	0.000	0.001	0.283	1780	21.0	0.004	4	3.7	8.6	0.0	0.004	NA	NA	20m.pg1211.cx7
436956	0	0	0.0	444.5	107.8	0.000	0.000	0.001	0.253	1715	22.5	0.004	4	3.7	8.6	0.0	0.004	NA	NA	20m.pg137.cx7
436956	0	0	0.0	464.5	112.6	0.000	0.000	0.001	0.264	1760	21.9	0.004	4	3.7	8.6	0.0	0.004	NA	NA	20m.pg146.cx7
456818	0	0	0.0	352.1	85.1	0.000	0.000	0.001	0.191	1511	22.4	0.003	4	3.7	8.6	0.0	0.004	NA	NA	20m.pg151.cx7
l.i1
l.i1: continue load after secondary indexes created. Graphs for performance per 1-second interval are here.
Average throughput:
Insert response time histogram: each cell has the percentage of responses that take <= the time in the header and max is the max response time in seconds. For the max column values in the top 25% of the range have a red background and in the bottom 25% of the range have a green background. The red background is not used when the min value is within 80% of the max value.
| dbms | 256us | 1ms | 4ms | 16ms | 64ms | 256ms | 1s | 4s | 16s | gt | max |
|---|---|---|---|---|---|---|---|---|---|---|---|
| pg1211.cx7 | 99.928 | 0.045 | 0.026 | 0.002 | 0.073 | ||||||
| pg137.cx7 | 99.955 | 0.040 | 0.005 | 0.021 | |||||||
| pg146.cx7 | 99.959 | 0.036 | 0.005 | 0.022 | |||||||
| pg151.cx7 | 99.932 | 0.040 | 0.027 | 0.001 | 0.076 |
Performance metrics for the DBMS listed above. Some are normalized by throughput, others are not. Legend for results is here.
ips	qps	rps	rmbps	wps	wmbps	rpq	rkbpq	wpi	wkbpi	csps	cpups	cspq	cpupq	dbgb1	dbgb2	rss	maxop	p50	p99	tag
56657	0	0	0.0	387.6	81.6	0.000	0.000	0.007	1.475	13754	35.6	0.243	50	7.5	20.0	0.0	0.073	29518	14734	20m.pg1211.cx7
56980	0	0	0.0	396.8	83.5	0.000	0.000	0.007	1.501	13806	35.6	0.242	50	7.5	20.3	0.0	0.021	29529	16182	20m.pg137.cx7
56022	0	0	0.0	409.7	87.0	0.000	0.000	0.007	1.591	13737	36.0	0.245	51	7.5	22.9	0.0	0.022	28868	19031	20m.pg146.cx7
56338	0	0	0.0	411.6	87.6	0.000	0.000	0.007	1.592	13740	35.9	0.244	51	7.5	22.9	0.0	0.076	29268	14789	20m.pg151.cx7
q100.1
q100.1: range queries with 100 insert/s per client. Graphs for performance per 1-second interval are here.
Average throughput:
Query response time histogram: each cell has the percentage of responses that take <= the time in the header and max is the max response time in seconds. For max values in the top 25% of the range have a red background and in the bottom 25% of the range have a green background. The red background is not used when the min value is within 80% of the max value.
| dbms | 256us | 1ms | 4ms | 16ms | 64ms | 256ms | 1s | 4s | 16s | gt | max |
|---|---|---|---|---|---|---|---|---|---|---|---|
| pg1211.cx7 | 99.909 | 0.090 | 0.001 | nonzero | 0.005 | ||||||
| pg137.cx7 | 99.916 | 0.083 | 0.001 | nonzero | 0.005 | ||||||
| pg146.cx7 | 99.905 | 0.093 | 0.001 | nonzero | 0.005 | ||||||
| pg151.cx7 | 99.924 | 0.074 | 0.001 | nonzero | 0.005 |
Insert response time histogram: each cell has the percentage of responses that take <= the time in the header and max is the max response time in seconds. For max values in the top 25% of the range have a red background and in the bottom 25% of the range have a green background. The red background is not used when the min value is within 80% of the max value.
| dbms | 256us | 1ms | 4ms | 16ms | 64ms | 256ms | 1s | 4s | 16s | gt | max |
|---|---|---|---|---|---|---|---|---|---|---|---|
| pg1211.cx7 | 99.854 | 0.146 | 0.007 | ||||||||
| pg137.cx7 | 99.882 | 0.118 | 0.006 | ||||||||
| pg146.cx7 | 99.819 | 0.181 | 0.006 | ||||||||
| pg151.cx7 | 99.882 | 0.118 | 0.008 |
Performance metrics for the DBMS listed above. Some are normalized by throughput, others are not. Legend for results is here.
ips	qps	rps	rmbps	wps	wmbps	rpq	rkbpq	wpi	wkbpi	csps	cpups	cspq	cpupq	dbgb1	dbgb2	rss	maxop	p50	p99	tag
200	15847	0	0.0	327.6	8.8	0.000	0.000	1.640	45.349	60877	26.6	3.842	134	7.6	13.7	0.0	0.005	7655	7527	20m.pg1211.cx7
200	16050	0	0.0	327.8	8.4	0.000	0.000	1.641	42.975	61656	26.4	3.842	132	7.7	12.9	0.0	0.005	7756	7624	20m.pg137.cx7
200	16065	0	0.0	313.4	8.1	0.000	0.000	1.570	41.649	61649	26.0	3.837	129	7.7	14.8	0.0	0.005	7767	7639	20m.pg146.cx7
200	16047	0	0.0	314.1	8.1	0.000	0.000	1.574	41.585	61558	26.2	3.836	131	7.7	14.8	0.0	0.005	7659	7543	20m.pg151.cx7
q500.1
q500.1: range queries with 500 insert/s per client. Graphs for performance per 1-second interval are here.
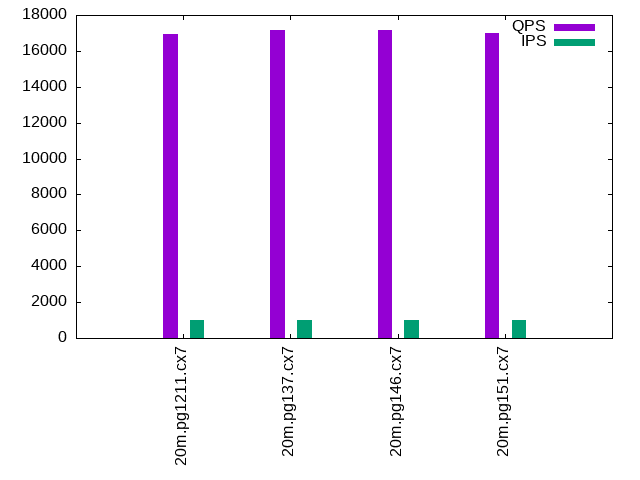
Average throughput:
Query response time histogram: each cell has the percentage of responses that take <= the time in the header and max is the max response time in seconds. For max values in the top 25% of the range have a red background and in the bottom 25% of the range have a green background. The red background is not used when the min value is within 80% of the max value.
| dbms | 256us | 1ms | 4ms | 16ms | 64ms | 256ms | 1s | 4s | 16s | gt | max |
|---|---|---|---|---|---|---|---|---|---|---|---|
| pg1211.cx7 | 99.872 | 0.121 | 0.007 | nonzero | nonzero | 0.058 | |||||
| pg137.cx7 | 99.876 | 0.117 | 0.007 | nonzero | nonzero | 0.039 | |||||
| pg146.cx7 | 99.852 | 0.141 | 0.007 | nonzero | nonzero | 0.050 | |||||
| pg151.cx7 | 99.870 | 0.123 | 0.007 | nonzero | 0.006 |
Insert response time histogram: each cell has the percentage of responses that take <= the time in the header and max is the max response time in seconds. For max values in the top 25% of the range have a red background and in the bottom 25% of the range have a green background. The red background is not used when the min value is within 80% of the max value.
| dbms | 256us | 1ms | 4ms | 16ms | 64ms | 256ms | 1s | 4s | 16s | gt | max |
|---|---|---|---|---|---|---|---|---|---|---|---|
| pg1211.cx7 | 99.615 | 0.363 | 0.021 | 0.001 | 0.075 | ||||||
| pg137.cx7 | 99.608 | 0.364 | 0.028 | 0.055 | |||||||
| pg146.cx7 | 99.539 | 0.417 | 0.044 | 0.060 | |||||||
| pg151.cx7 | 99.760 | 0.232 | 0.008 | 0.022 |
Performance metrics for the DBMS listed above. Some are normalized by throughput, others are not. Legend for results is here.
ips	qps	rps	rmbps	wps	wmbps	rpq	rkbpq	wpi	wkbpi	csps	cpups	cspq	cpupq	dbgb1	dbgb2	rss	maxop	p50	p99	tag
999	16959	0	0.0	436.4	20.0	0.000	0.000	0.437	20.541	65323	27.2	3.852	128	9.3	14.4	0.0	0.058	8135	7531	20m.pg1211.cx7
999	17187	0	0.0	443.0	20.2	0.000	0.000	0.444	20.672	66181	27.2	3.851	127	9.3	14.1	0.0	0.039	8311	7640	20m.pg137.cx7
999	17169	0	0.0	458.4	19.1	0.000	0.000	0.459	19.577	66056	26.8	3.847	125	9.3	15.4	0.0	0.050	8263	7639	20m.pg146.cx7
999	16974	0	0.0	459.5	19.1	0.000	0.000	0.460	19.553	65297	26.7	3.847	126	9.3	15.4	0.0	0.006	8138	7486	20m.pg151.cx7
q1000.1
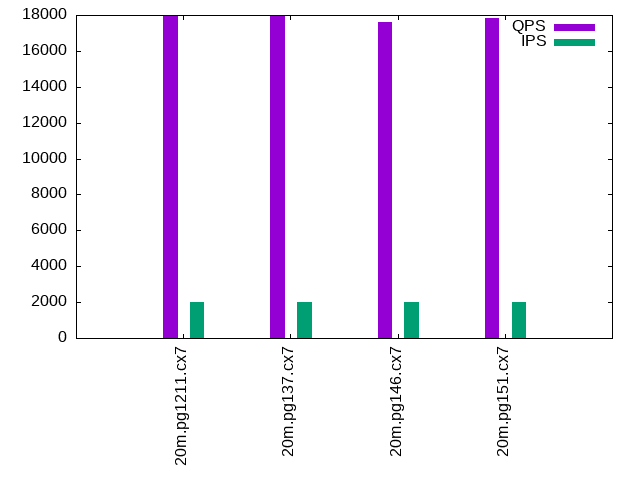
q1000.1: range queries with 1000 insert/s per client. Graphs for performance per 1-second interval are here.
Average throughput:
Query response time histogram: each cell has the percentage of responses that take <= the time in the header and max is the max response time in seconds. For max values in the top 25% of the range have a red background and in the bottom 25% of the range have a green background. The red background is not used when the min value is within 80% of the max value.
| dbms | 256us | 1ms | 4ms | 16ms | 64ms | 256ms | 1s | 4s | 16s | gt | max |
|---|---|---|---|---|---|---|---|---|---|---|---|
| pg1211.cx7 | 99.855 | 0.134 | 0.011 | nonzero | nonzero | 0.040 | |||||
| pg137.cx7 | 99.852 | 0.137 | 0.011 | nonzero | nonzero | nonzero | 0.073 | ||||
| pg146.cx7 | 99.814 | 0.174 | 0.011 | nonzero | nonzero | 0.020 | |||||
| pg151.cx7 | 99.834 | 0.155 | 0.011 | nonzero | nonzero | 0.050 |
Insert response time histogram: each cell has the percentage of responses that take <= the time in the header and max is the max response time in seconds. For max values in the top 25% of the range have a red background and in the bottom 25% of the range have a green background. The red background is not used when the min value is within 80% of the max value.
| dbms | 256us | 1ms | 4ms | 16ms | 64ms | 256ms | 1s | 4s | 16s | gt | max |
|---|---|---|---|---|---|---|---|---|---|---|---|
| pg1211.cx7 | 97.998 | 1.923 | 0.074 | 0.006 | 0.133 | ||||||
| pg137.cx7 | 96.847 | 3.026 | 0.119 | 0.007 | 0.150 | ||||||
| pg146.cx7 | 96.449 | 3.447 | 0.099 | 0.005 | 0.149 | ||||||
| pg151.cx7 | 96.435 | 3.454 | 0.104 | 0.007 | 0.135 |
Performance metrics for the DBMS listed above. Some are normalized by throughput, others are not. Legend for results is here.
ips	qps	rps	rmbps	wps	wmbps	rpq	rkbpq	wpi	wkbpi	csps	cpups	cspq	cpupq	dbgb1	dbgb2	rss	maxop	p50	p99	tag
1997	17953	11	0.1	517.5	28.6	0.001	0.008	0.259	14.639	69369	28.0	3.864	125	12.0	17.5	0.0	0.040	8806	7687	20m.pg1211.cx7
1997	17967	11	0.1	516.1	28.7	0.001	0.007	0.258	14.694	69429	28.1	3.864	125	12.0	17.5	0.0	0.073	8742	7723	20m.pg137.cx7
1997	17637	11	0.1	575.4	26.0	0.001	0.005	0.288	13.332	68094	27.5	3.861	125	12.0	18.7	0.0	0.020	8379	7591	20m.pg146.cx7
1997	17838	11	0.1	573.6	26.0	0.001	0.005	0.287	13.350	68821	27.5	3.858	123	12.0	18.7	0.0	0.050	8790	7623	20m.pg151.cx7
l.i0
l.i0: load without secondary indexes
Performance metrics for all DBMS, not just the ones listed above. Some are normalized by throughput, others are not. Legend for results is here.
ips	qps	rps	rmbps	wps	wmbps	rpq	rkbpq	wpi	wkbpi	csps	cpups	cspq	cpupq	dbgb1	dbgb2	rss	maxop	p50	p99	tag
132450	0	0	0.0	266.7	56.1	0.000	0.000	0.002	0.434	15557	40.8	0.117	25	1.9	5.2	0.0	0.004	71122	38057	20m.pg1211.cx7
133333	0	0	0.0	266.6	56.4	0.000	0.000	0.002	0.433	15664	40.9	0.117	25	1.9	5.2	0.0	0.003	71422	61231	20m.pg137.cx7
129032	0	0	0.0	261.3	55.3	0.000	0.000	0.002	0.439	15343	41.5	0.119	26	1.9	5.2	0.0	0.003	69522	60034	20m.pg146.cx7
133333	0	0	0.0	266.3	56.1	0.000	0.000	0.002	0.431	15633	40.9	0.117	25	1.9	5.2	0.0	0.004	71623	29080	20m.pg151.cx7
l.x
l.x: create secondary indexes
Performance metrics for all DBMS, not just the ones listed above. Some are normalized by throughput, others are not. Legend for results is here.
ips	qps	rps	rmbps	wps	wmbps	rpq	rkbpq	wpi	wkbpi	csps	cpups	cspq	cpupq	dbgb1	dbgb2	rss	maxop	p50	p99	tag
402000	0	0	0.0	459.3	111.3	0.000	0.000	0.001	0.283	1780	21.0	0.004	4	3.7	8.6	0.0	0.004	NA	NA	20m.pg1211.cx7
436956	0	0	0.0	444.5	107.8	0.000	0.000	0.001	0.253	1715	22.5	0.004	4	3.7	8.6	0.0	0.004	NA	NA	20m.pg137.cx7
436956	0	0	0.0	464.5	112.6	0.000	0.000	0.001	0.264	1760	21.9	0.004	4	3.7	8.6	0.0	0.004	NA	NA	20m.pg146.cx7
456818	0	0	0.0	352.1	85.1	0.000	0.000	0.001	0.191	1511	22.4	0.003	4	3.7	8.6	0.0	0.004	NA	NA	20m.pg151.cx7
l.i1
l.i1: continue load after secondary indexes created
Performance metrics for all DBMS, not just the ones listed above. Some are normalized by throughput, others are not. Legend for results is here.
ips	qps	rps	rmbps	wps	wmbps	rpq	rkbpq	wpi	wkbpi	csps	cpups	cspq	cpupq	dbgb1	dbgb2	rss	maxop	p50	p99	tag
56657	0	0	0.0	387.6	81.6	0.000	0.000	0.007	1.475	13754	35.6	0.243	50	7.5	20.0	0.0	0.073	29518	14734	20m.pg1211.cx7
56980	0	0	0.0	396.8	83.5	0.000	0.000	0.007	1.501	13806	35.6	0.242	50	7.5	20.3	0.0	0.021	29529	16182	20m.pg137.cx7
56022	0	0	0.0	409.7	87.0	0.000	0.000	0.007	1.591	13737	36.0	0.245	51	7.5	22.9	0.0	0.022	28868	19031	20m.pg146.cx7
56338	0	0	0.0	411.6	87.6	0.000	0.000	0.007	1.592	13740	35.9	0.244	51	7.5	22.9	0.0	0.076	29268	14789	20m.pg151.cx7
q100.1
q100.1: range queries with 100 insert/s per client
Performance metrics for all DBMS, not just the ones listed above. Some are normalized by throughput, others are not. Legend for results is here.
ips	qps	rps	rmbps	wps	wmbps	rpq	rkbpq	wpi	wkbpi	csps	cpups	cspq	cpupq	dbgb1	dbgb2	rss	maxop	p50	p99	tag
200	15847	0	0.0	327.6	8.8	0.000	0.000	1.640	45.349	60877	26.6	3.842	134	7.6	13.7	0.0	0.005	7655	7527	20m.pg1211.cx7
200	16050	0	0.0	327.8	8.4	0.000	0.000	1.641	42.975	61656	26.4	3.842	132	7.7	12.9	0.0	0.005	7756	7624	20m.pg137.cx7
200	16065	0	0.0	313.4	8.1	0.000	0.000	1.570	41.649	61649	26.0	3.837	129	7.7	14.8	0.0	0.005	7767	7639	20m.pg146.cx7
200	16047	0	0.0	314.1	8.1	0.000	0.000	1.574	41.585	61558	26.2	3.836	131	7.7	14.8	0.0	0.005	7659	7543	20m.pg151.cx7
q500.1
q500.1: range queries with 500 insert/s per client
Performance metrics for all DBMS, not just the ones listed above. Some are normalized by throughput, others are not. Legend for results is here.
ips	qps	rps	rmbps	wps	wmbps	rpq	rkbpq	wpi	wkbpi	csps	cpups	cspq	cpupq	dbgb1	dbgb2	rss	maxop	p50	p99	tag
999	16959	0	0.0	436.4	20.0	0.000	0.000	0.437	20.541	65323	27.2	3.852	128	9.3	14.4	0.0	0.058	8135	7531	20m.pg1211.cx7
999	17187	0	0.0	443.0	20.2	0.000	0.000	0.444	20.672	66181	27.2	3.851	127	9.3	14.1	0.0	0.039	8311	7640	20m.pg137.cx7
999	17169	0	0.0	458.4	19.1	0.000	0.000	0.459	19.577	66056	26.8	3.847	125	9.3	15.4	0.0	0.050	8263	7639	20m.pg146.cx7
999	16974	0	0.0	459.5	19.1	0.000	0.000	0.460	19.553	65297	26.7	3.847	126	9.3	15.4	0.0	0.006	8138	7486	20m.pg151.cx7
q1000.1
q1000.1: range queries with 1000 insert/s per client
Performance metrics for all DBMS, not just the ones listed above. Some are normalized by throughput, others are not. Legend for results is here.
ips	qps	rps	rmbps	wps	wmbps	rpq	rkbpq	wpi	wkbpi	csps	cpups	cspq	cpupq	dbgb1	dbgb2	rss	maxop	p50	p99	tag
1997	17953	11	0.1	517.5	28.6	0.001	0.008	0.259	14.639	69369	28.0	3.864	125	12.0	17.5	0.0	0.040	8806	7687	20m.pg1211.cx7
1997	17967	11	0.1	516.1	28.7	0.001	0.007	0.258	14.694	69429	28.1	3.864	125	12.0	17.5	0.0	0.073	8742	7723	20m.pg137.cx7
1997	17637	11	0.1	575.4	26.0	0.001	0.005	0.288	13.332	68094	27.5	3.861	125	12.0	18.7	0.0	0.020	8379	7591	20m.pg146.cx7
1997	17838	11	0.1	573.6	26.0	0.001	0.005	0.287	13.350	68821	27.5	3.858	123	12.0	18.7	0.0	0.050	8790	7623	20m.pg151.cx7
l.i0
- l.i0: load without secondary indexes
- Legend for results is here.
- Each entry lists the percentage of responses that fit in that bucket (slower than max time for previous bucket, faster than min time for next bucket).
Insert response time histogram
256us	1ms	4ms	16ms	64ms	256ms	1s	4s	16s	gt	max	tag
0.000	0.000	100.000	0.000	0.000	0.000	0.000	0.000	0.000	0.000	0.004	pg1211.cx7
0.000	0.000	100.000	0.000	0.000	0.000	0.000	0.000	0.000	0.000	0.003	pg137.cx7
0.000	0.000	100.000	0.000	0.000	0.000	0.000	0.000	0.000	0.000	0.003	pg146.cx7
0.000	0.000	100.000	0.000	0.000	0.000	0.000	0.000	0.000	0.000	0.004	pg151.cx7
l.x
- l.x: create secondary indexes
- Legend for results is here.
- Each entry lists the percentage of responses that fit in that bucket (slower than max time for previous bucket, faster than min time for next bucket).
TODO - determine whether there is data for create index response time
l.i1
- l.i1: continue load after secondary indexes created
- Legend for results is here.
- Each entry lists the percentage of responses that fit in that bucket (slower than max time for previous bucket, faster than min time for next bucket).
Insert response time histogram
256us	1ms	4ms	16ms	64ms	256ms	1s	4s	16s	gt	max	tag
0.000	0.000	99.928	0.045	0.026	0.002	0.000	0.000	0.000	0.000	0.073	pg1211.cx7
0.000	0.000	99.955	0.040	0.005	0.000	0.000	0.000	0.000	0.000	0.021	pg137.cx7
0.000	0.000	99.959	0.036	0.005	0.000	0.000	0.000	0.000	0.000	0.022	pg146.cx7
0.000	0.000	99.932	0.040	0.027	0.001	0.000	0.000	0.000	0.000	0.076	pg151.cx7
q100.1
- q100.1: range queries with 100 insert/s per client
- Legend for results is here.
- Each entry lists the percentage of responses that fit in that bucket (slower than max time for previous bucket, faster than min time for next bucket).
Query response time histogram
256us	1ms	4ms	16ms	64ms	256ms	1s	4s	16s	gt	max	tag
99.909	0.090	0.001	nonzero	0.000	0.000	0.000	0.000	0.000	0.000	0.005	pg1211.cx7
99.916	0.083	0.001	nonzero	0.000	0.000	0.000	0.000	0.000	0.000	0.005	pg137.cx7
99.905	0.093	0.001	nonzero	0.000	0.000	0.000	0.000	0.000	0.000	0.005	pg146.cx7
99.924	0.074	0.001	nonzero	0.000	0.000	0.000	0.000	0.000	0.000	0.005	pg151.cx7
Insert response time histogram
256us	1ms	4ms	16ms	64ms	256ms	1s	4s	16s	gt	max	tag
0.000	0.000	99.854	0.146	0.000	0.000	0.000	0.000	0.000	0.000	0.007	pg1211.cx7
0.000	0.000	99.882	0.118	0.000	0.000	0.000	0.000	0.000	0.000	0.006	pg137.cx7
0.000	0.000	99.819	0.181	0.000	0.000	0.000	0.000	0.000	0.000	0.006	pg146.cx7
0.000	0.000	99.882	0.118	0.000	0.000	0.000	0.000	0.000	0.000	0.008	pg151.cx7
q500.1
- q500.1: range queries with 500 insert/s per client
- Legend for results is here.
- Each entry lists the percentage of responses that fit in that bucket (slower than max time for previous bucket, faster than min time for next bucket).
Query response time histogram
256us	1ms	4ms	16ms	64ms	256ms	1s	4s	16s	gt	max	tag
99.872	0.121	0.007	nonzero	nonzero	0.000	0.000	0.000	0.000	0.000	0.058	pg1211.cx7
99.876	0.117	0.007	nonzero	nonzero	0.000	0.000	0.000	0.000	0.000	0.039	pg137.cx7
99.852	0.141	0.007	nonzero	nonzero	0.000	0.000	0.000	0.000	0.000	0.050	pg146.cx7
99.870	0.123	0.007	nonzero	0.000	0.000	0.000	0.000	0.000	0.000	0.006	pg151.cx7
Insert response time histogram
256us	1ms	4ms	16ms	64ms	256ms	1s	4s	16s	gt	max	tag
0.000	0.000	99.615	0.363	0.021	0.001	0.000	0.000	0.000	0.000	0.075	pg1211.cx7
0.000	0.000	99.608	0.364	0.028	0.000	0.000	0.000	0.000	0.000	0.055	pg137.cx7
0.000	0.000	99.539	0.417	0.044	0.000	0.000	0.000	0.000	0.000	0.060	pg146.cx7
0.000	0.000	99.760	0.232	0.008	0.000	0.000	0.000	0.000	0.000	0.022	pg151.cx7
q1000.1
- q1000.1: range queries with 1000 insert/s per client
- Legend for results is here.
- Each entry lists the percentage of responses that fit in that bucket (slower than max time for previous bucket, faster than min time for next bucket).
Query response time histogram
256us	1ms	4ms	16ms	64ms	256ms	1s	4s	16s	gt	max	tag
99.855	0.134	0.011	nonzero	nonzero	0.000	0.000	0.000	0.000	0.000	0.040	pg1211.cx7
99.852	0.137	0.011	nonzero	nonzero	nonzero	0.000	0.000	0.000	0.000	0.073	pg137.cx7
99.814	0.174	0.011	nonzero	nonzero	0.000	0.000	0.000	0.000	0.000	0.020	pg146.cx7
99.834	0.155	0.011	nonzero	nonzero	0.000	0.000	0.000	0.000	0.000	0.050	pg151.cx7
Insert response time histogram
256us	1ms	4ms	16ms	64ms	256ms	1s	4s	16s	gt	max	tag
0.000	0.000	97.998	1.923	0.074	0.006	0.000	0.000	0.000	0.000	0.133	pg1211.cx7
0.000	0.000	96.847	3.026	0.119	0.007	0.000	0.000	0.000	0.000	0.150	pg137.cx7
0.000	0.000	96.449	3.447	0.099	0.005	0.000	0.000	0.000	0.000	0.149	pg146.cx7
0.000	0.000	96.435	3.454	0.104	0.007	0.000	0.000	0.000	0.000	0.135	pg151.cx7