Introduction
This is a report for the insert benchmark with 20M docs and 1 client(s). It is generated by scripts (bash, awk, sed) and Tufte might not be impressed. An overview of the insert benchmark is here and a short update is here. Below, by DBMS, I mean DBMS+version.config. An example is my8020.c10b40 where my means MySQL, 8020 is version 8.0.20 and c10b40 is the name for the configuration file.
The test server has 8 AMD cores, 16G RAM and an NVMe SSD. It is described here. The benchmark was run with 1 clients and there were 1 or 2 connections per client (1 for queries, 1 for inserts). The benchmark loads 20M rows without secondary indexes, creates secondary indexes, loads another 20M rows then does 3 read+write tests for one hour each that do queries as fast as possible with 100, 500 and then 1000 writes/second/client concurrent with the queries. The database is cached by the storage engine and the only IO is for writes. Clients and the DBMS share one server. The per-database configs are in the per-database subdirectories here.
The tested DBMS are:
- pg1211.cx7 - Postgres 12.11 and the cx7 config
- pg137.cx7 - Postgres 13.7 and the cx7 config
- pg146.cx7 - Postgres 14.6 and the cx7 config
- pg151.cx7 - Postgres 15.1 and the cx7 config
Contents
- Summary
- l.i0: load without secondary indexes
- l.x: create secondary indexes
- l.i1: continue load after secondary indexes created
- q100.1: range queries with 100 insert/s per client
- q500.1: range queries with 500 insert/s per client
- q1000.1: range queries with 1000 insert/s per client
Summary
The numbers are inserts/s for l.i0 and l.i1, indexed docs (or rows) /s for l.x and queries/s for q*.2. The values are the average rate over the entire test for inserts (IPS) and queries (QPS). The range of values for IPS and QPS is split into 3 parts: bottom 25%, middle 50%, top 25%. Values in the bottom 25% have a red background, values in the top 25% have a green background and values in the middle have no color. A gray background is used for values that can be ignored because the DBMS did not sustain the target insert rate. Red backgrounds are not used when the minimum value is within 80% of the max value.
| dbms | l.i0 | l.x | l.i1 | q100.1 | q500.1 | q1000.1 |
|---|---|---|---|---|---|---|
| 20m.pg1211.cx7 | 71428 | 216129 | 27894 | 8250 | 8238 | 8102 |
| 20m.pg137.cx7 | 72464 | 228409 | 28248 | 8153 | 8129 | 8288 |
| 20m.pg146.cx7 | 69686 | 233721 | 27816 | 8010 | 7985 | 8061 |
| 20m.pg151.cx7 | 72202 | 239286 | 27855 | 8152 | 7984 | 8101 |
This lists the average rate of inserts/s for the tests that do inserts concurrent with queries. For such tests the query rate is listed in the table above. The read+write tests are setup so that the insert rate should match the target rate every second. Cells that are not at least 95% of the target have a red background to indicate a failure to satisfy the target.
| dbms | q100.1 | q500.1 | q1000.1 |
|---|---|---|---|
| pg1211.cx7 | 100 | 499 | 999 |
| pg137.cx7 | 100 | 499 | 998 |
| pg146.cx7 | 100 | 499 | 998 |
| pg151.cx7 | 100 | 499 | 998 |
| target | 100 | 500 | 1000 |
l.i0
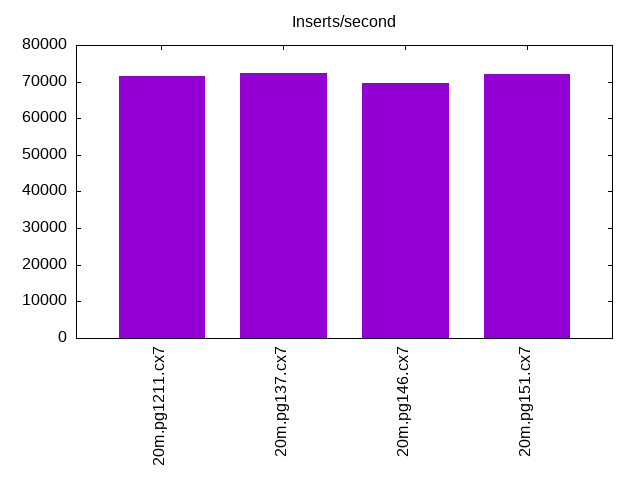
l.i0: load without secondary indexes. Graphs for performance per 1-second interval are here.
Average throughput:
Insert response time histogram: each cell has the percentage of responses that take <= the time in the header and max is the max response time in seconds. For the max column values in the top 25% of the range have a red background and in the bottom 25% of the range have a green background. The red background is not used when the min value is within 80% of the max value.
| dbms | 256us | 1ms | 4ms | 16ms | 64ms | 256ms | 1s | 4s | 16s | gt | max |
|---|---|---|---|---|---|---|---|---|---|---|---|
| pg1211.cx7 | 100.000 | 0.004 | |||||||||
| pg137.cx7 | 100.000 | 0.004 | |||||||||
| pg146.cx7 | 100.000 | 0.004 | |||||||||
| pg151.cx7 | 100.000 | 0.004 |
Performance metrics for the DBMS listed above. Some are normalized by throughput, others are not. Legend for results is here.
ips	qps	rps	rmbps	wps	wmbps	rpq	rkbpq	wpi	wkbpi	csps	cpups	cspq	cpupq	dbgb1	dbgb2	rss	maxop	p50	p99	tag
71428	0	0	0.0	142.2	30.0	0.000	0.000	0.002	0.430	8833	24.2	0.124	27	1.9	5.2	0.0	0.004	71551	69519	20m.pg1211.cx7
72464	0	0	0.0	145.0	30.6	0.000	0.000	0.002	0.433	8982	23.6	0.124	26	1.9	5.2	0.0	0.004	72918	70319	20m.pg137.cx7
69686	0	0	0.0	139.0	29.4	0.000	0.000	0.002	0.432	8654	23.3	0.124	27	1.9	5.2	0.0	0.004	69650	67483	20m.pg146.cx7
72202	0	0	0.0	144.4	30.5	0.000	0.000	0.002	0.433	8969	22.8	0.124	25	1.9	5.2	0.0	0.004	72717	69718	20m.pg151.cx7
l.x
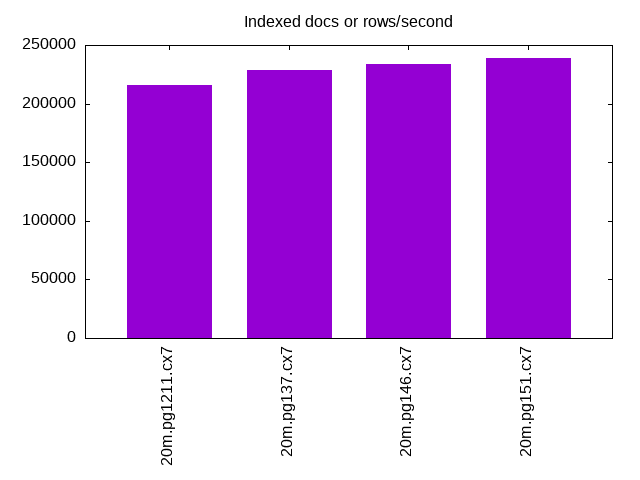
l.x: create secondary indexes.
Average throughput:
Performance metrics for the DBMS listed above. Some are normalized by throughput, others are not. Legend for results is here.
ips	qps	rps	rmbps	wps	wmbps	rpq	rkbpq	wpi	wkbpi	csps	cpups	cspq	cpupq	dbgb1	dbgb2	rss	maxop	p50	p99	tag
216129	0	0	0.0	249.4	60.5	0.000	0.000	0.001	0.287	943	11.7	0.004	4	3.7	8.6	0.0	0.004	NA	NA	20m.pg1211.cx7
228409	0	0	0.0	236.7	57.5	0.000	0.000	0.001	0.258	966	12.2	0.004	4	3.7	8.6	0.0	0.004	NA	NA	20m.pg137.cx7
233721	0	0	0.0	241.7	58.6	0.000	0.000	0.001	0.257	937	12.1	0.004	4	3.7	8.6	0.0	0.003	NA	NA	20m.pg146.cx7
239286	0	0	0.0	215.6	51.2	0.000	0.000	0.001	0.219	960	12.2	0.004	4	3.7	8.6	0.0	0.004	NA	NA	20m.pg151.cx7
l.i1
l.i1: continue load after secondary indexes created. Graphs for performance per 1-second interval are here.
Average throughput:

Insert response time histogram: each cell has the percentage of responses that take <= the time in the header and max is the max response time in seconds. For the max column values in the top 25% of the range have a red background and in the bottom 25% of the range have a green background. The red background is not used when the min value is within 80% of the max value.
| dbms | 256us | 1ms | 4ms | 16ms | 64ms | 256ms | 1s | 4s | 16s | gt | max |
|---|---|---|---|---|---|---|---|---|---|---|---|
| pg1211.cx7 | 99.988 | 0.008 | 0.004 | 0.041 | |||||||
| pg137.cx7 | 99.984 | 0.011 | 0.004 | nonzero | 0.073 | ||||||
| pg146.cx7 | 99.986 | 0.010 | 0.003 | 0.041 | |||||||
| pg151.cx7 | 99.977 | 0.012 | 0.011 | 0.057 |
Performance metrics for the DBMS listed above. Some are normalized by throughput, others are not. Legend for results is here.
ips	qps	rps	rmbps	wps	wmbps	rpq	rkbpq	wpi	wkbpi	csps	cpups	cspq	cpupq	dbgb1	dbgb2	rss	maxop	p50	p99	tag
27894	0	0	0.0	263.0	46.3	0.000	0.000	0.009	1.701	7124	19.2	0.255	55	8.2	17.3	0.0	0.041	28543	19878	20m.pg1211.cx7
28248	0	0	0.0	257.8	50.2	0.000	0.000	0.009	1.821	7242	18.8	0.256	53	8.2	17.9	0.0	0.073	28968	20228	20m.pg137.cx7
27816	0	0	0.0	233.7	47.2	0.000	0.000	0.008	1.738	7164	18.1	0.258	52	8.2	18.5	0.0	0.041	28469	20122	20m.pg146.cx7
27855	0	0	0.0	231.2	47.8	0.000	0.000	0.008	1.757	7141	18.1	0.256	52	8.2	18.6	0.0	0.057	28568	18678	20m.pg151.cx7
q100.1
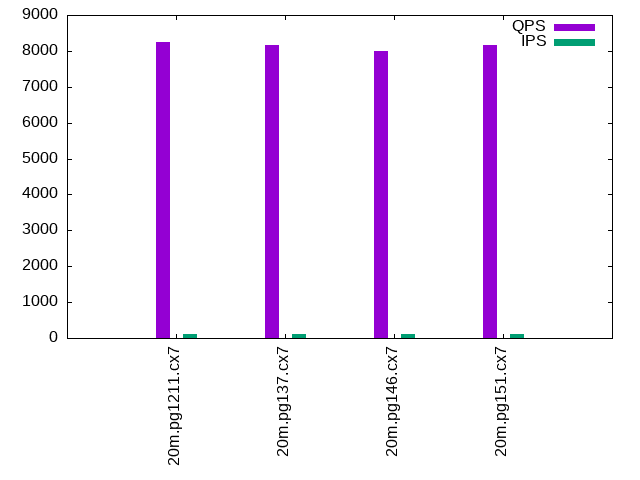
q100.1: range queries with 100 insert/s per client. Graphs for performance per 1-second interval are here.
Average throughput:
Query response time histogram: each cell has the percentage of responses that take <= the time in the header and max is the max response time in seconds. For max values in the top 25% of the range have a red background and in the bottom 25% of the range have a green background. The red background is not used when the min value is within 80% of the max value.
| dbms | 256us | 1ms | 4ms | 16ms | 64ms | 256ms | 1s | 4s | 16s | gt | max |
|---|---|---|---|---|---|---|---|---|---|---|---|
| pg1211.cx7 | 99.928 | 0.071 | nonzero | nonzero | 0.005 | ||||||
| pg137.cx7 | 99.934 | 0.066 | nonzero | nonzero | 0.005 | ||||||
| pg146.cx7 | 99.935 | 0.065 | nonzero | 0.004 | |||||||
| pg151.cx7 | 99.947 | 0.053 | nonzero | nonzero | 0.005 |
Insert response time histogram: each cell has the percentage of responses that take <= the time in the header and max is the max response time in seconds. For max values in the top 25% of the range have a red background and in the bottom 25% of the range have a green background. The red background is not used when the min value is within 80% of the max value.
| dbms | 256us | 1ms | 4ms | 16ms | 64ms | 256ms | 1s | 4s | 16s | gt | max |
|---|---|---|---|---|---|---|---|---|---|---|---|
| pg1211.cx7 | 99.833 | 0.167 | 0.006 | ||||||||
| pg137.cx7 | 99.861 | 0.139 | 0.006 | ||||||||
| pg146.cx7 | 99.917 | 0.083 | 0.006 | ||||||||
| pg151.cx7 | 99.875 | 0.125 | 0.006 |
Performance metrics for the DBMS listed above. Some are normalized by throughput, others are not. Legend for results is here.
ips	qps	rps	rmbps	wps	wmbps	rpq	rkbpq	wpi	wkbpi	csps	cpups	cspq	cpupq	dbgb1	dbgb2	rss	maxop	p50	p99	tag
100	8250	0	0.0	205.1	5.3	0.000	0.000	2.055	54.664	31812	13.3	3.856	129	8.2	12.6	0.0	0.005	7767	7669	20m.pg1211.cx7
100	8153	0	0.0	202.2	4.6	0.000	0.000	2.026	46.902	31442	13.3	3.856	131	8.2	11.9	0.0	0.005	7735	7623	20m.pg137.cx7
100	8010	0	0.0	203.5	4.7	0.000	0.000	2.039	48.271	30854	13.1	3.852	131	8.2	13.8	0.0	0.004	7687	7590	20m.pg146.cx7
100	8152	0	0.0	204.5	4.7	0.000	0.000	2.049	48.243	31367	13.1	3.848	129	8.2	13.9	0.0	0.005	7639	7542	20m.pg151.cx7
q500.1
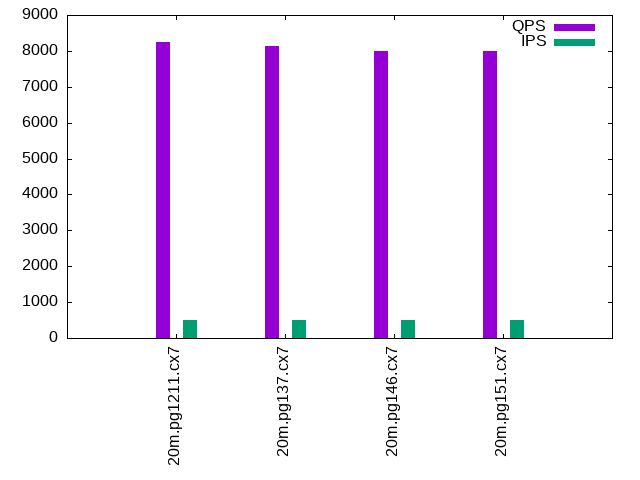
q500.1: range queries with 500 insert/s per client. Graphs for performance per 1-second interval are here.
Average throughput:
Query response time histogram: each cell has the percentage of responses that take <= the time in the header and max is the max response time in seconds. For max values in the top 25% of the range have a red background and in the bottom 25% of the range have a green background. The red background is not used when the min value is within 80% of the max value.
| dbms | 256us | 1ms | 4ms | 16ms | 64ms | 256ms | 1s | 4s | 16s | gt | max |
|---|---|---|---|---|---|---|---|---|---|---|---|
| pg1211.cx7 | 99.949 | 0.051 | nonzero | 0.003 | |||||||
| pg137.cx7 | 99.939 | 0.060 | nonzero | nonzero | 0.005 | ||||||
| pg146.cx7 | 99.946 | 0.053 | nonzero | nonzero | 0.005 | ||||||
| pg151.cx7 | 99.953 | 0.047 | nonzero | nonzero | 0.006 |
Insert response time histogram: each cell has the percentage of responses that take <= the time in the header and max is the max response time in seconds. For max values in the top 25% of the range have a red background and in the bottom 25% of the range have a green background. The red background is not used when the min value is within 80% of the max value.
| dbms | 256us | 1ms | 4ms | 16ms | 64ms | 256ms | 1s | 4s | 16s | gt | max |
|---|---|---|---|---|---|---|---|---|---|---|---|
| pg1211.cx7 | 99.881 | 0.119 | 0.008 | ||||||||
| pg137.cx7 | 99.919 | 0.081 | 0.008 | ||||||||
| pg146.cx7 | 99.856 | 0.144 | 0.008 | ||||||||
| pg151.cx7 | 99.817 | 0.183 | 0.008 |
Performance metrics for the DBMS listed above. Some are normalized by throughput, others are not. Legend for results is here.
ips	qps	rps	rmbps	wps	wmbps	rpq	rkbpq	wpi	wkbpi	csps	cpups	cspq	cpupq	dbgb1	dbgb2	rss	maxop	p50	p99	tag
499	8238	0	0.0	351.7	12.4	0.000	0.000	0.704	25.444	31883	13.7	3.870	133	8.7	12.0	0.0	0.003	7719	7608	20m.pg1211.cx7
499	8129	0	0.0	355.5	12.5	0.000	0.000	0.712	25.565	31473	13.9	3.872	137	8.7	11.9	0.0	0.005	7687	7575	20m.pg137.cx7
499	7985	0	0.0	357.3	11.8	0.000	0.000	0.716	24.129	30879	13.5	3.867	135	8.7	12.7	0.0	0.005	7639	7543	20m.pg146.cx7
499	7984	0	0.0	357.0	11.8	0.000	0.000	0.715	24.146	30841	13.4	3.863	134	8.7	12.7	0.0	0.006	7575	7480	20m.pg151.cx7
q1000.1
q1000.1: range queries with 1000 insert/s per client. Graphs for performance per 1-second interval are here.
Average throughput:
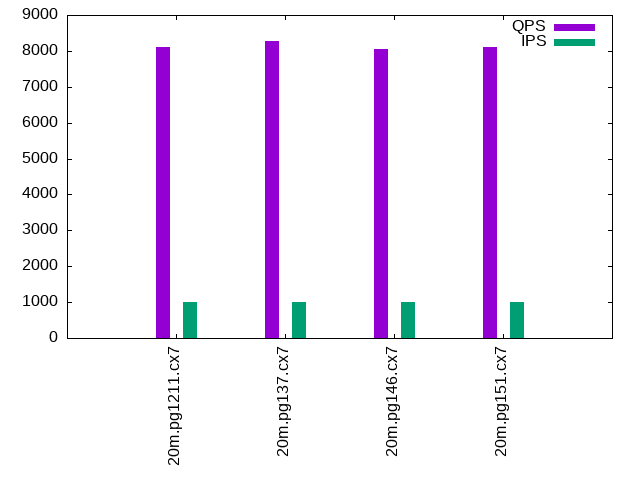
Query response time histogram: each cell has the percentage of responses that take <= the time in the header and max is the max response time in seconds. For max values in the top 25% of the range have a red background and in the bottom 25% of the range have a green background. The red background is not used when the min value is within 80% of the max value.
| dbms | 256us | 1ms | 4ms | 16ms | 64ms | 256ms | 1s | 4s | 16s | gt | max |
|---|---|---|---|---|---|---|---|---|---|---|---|
| pg1211.cx7 | 99.934 | 0.066 | nonzero | nonzero | 0.005 | ||||||
| pg137.cx7 | 99.934 | 0.065 | nonzero | nonzero | 0.005 | ||||||
| pg146.cx7 | 99.946 | 0.054 | nonzero | nonzero | 0.005 | ||||||
| pg151.cx7 | 99.952 | 0.047 | nonzero | nonzero | 0.005 |
Insert response time histogram: each cell has the percentage of responses that take <= the time in the header and max is the max response time in seconds. For max values in the top 25% of the range have a red background and in the bottom 25% of the range have a green background. The red background is not used when the min value is within 80% of the max value.
| dbms | 256us | 1ms | 4ms | 16ms | 64ms | 256ms | 1s | 4s | 16s | gt | max |
|---|---|---|---|---|---|---|---|---|---|---|---|
| pg1211.cx7 | 97.451 | 2.518 | 0.031 | 0.043 | |||||||
| pg137.cx7 | 97.731 | 2.249 | 0.021 | 0.047 | |||||||
| pg146.cx7 | 97.996 | 1.992 | 0.013 | 0.047 | |||||||
| pg151.cx7 | 98.074 | 1.908 | 0.018 | 0.044 |
Performance metrics for the DBMS listed above. Some are normalized by throughput, others are not. Legend for results is here.
ips	qps	rps	rmbps	wps	wmbps	rpq	rkbpq	wpi	wkbpi	csps	cpups	cspq	cpupq	dbgb1	dbgb2	rss	maxop	p50	p99	tag
999	8102	7	0.1	406.1	19.0	0.001	0.008	0.407	19.483	31537	15.1	3.893	149	10.6	14.6	0.0	0.005	7751	7622	20m.pg1211.cx7
998	8288	7	0.1	408.1	19.1	0.001	0.008	0.409	19.568	32245	14.8	3.891	143	10.6	14.6	0.0	0.005	7767	7623	20m.pg137.cx7
998	8061	7	0.1	438.3	17.5	0.001	0.008	0.439	17.941	31324	14.6	3.886	145	10.6	15.4	0.0	0.005	7687	7559	20m.pg146.cx7
998	8101	7	0.1	437.7	17.5	0.001	0.008	0.438	17.935	31448	14.4	3.882	142	10.6	15.4	0.0	0.005	7655	7513	20m.pg151.cx7
l.i0
l.i0: load without secondary indexes
Performance metrics for all DBMS, not just the ones listed above. Some are normalized by throughput, others are not. Legend for results is here.
ips	qps	rps	rmbps	wps	wmbps	rpq	rkbpq	wpi	wkbpi	csps	cpups	cspq	cpupq	dbgb1	dbgb2	rss	maxop	p50	p99	tag
71428	0	0	0.0	142.2	30.0	0.000	0.000	0.002	0.430	8833	24.2	0.124	27	1.9	5.2	0.0	0.004	71551	69519	20m.pg1211.cx7
72464	0	0	0.0	145.0	30.6	0.000	0.000	0.002	0.433	8982	23.6	0.124	26	1.9	5.2	0.0	0.004	72918	70319	20m.pg137.cx7
69686	0	0	0.0	139.0	29.4	0.000	0.000	0.002	0.432	8654	23.3	0.124	27	1.9	5.2	0.0	0.004	69650	67483	20m.pg146.cx7
72202	0	0	0.0	144.4	30.5	0.000	0.000	0.002	0.433	8969	22.8	0.124	25	1.9	5.2	0.0	0.004	72717	69718	20m.pg151.cx7
l.x
l.x: create secondary indexes
Performance metrics for all DBMS, not just the ones listed above. Some are normalized by throughput, others are not. Legend for results is here.
ips	qps	rps	rmbps	wps	wmbps	rpq	rkbpq	wpi	wkbpi	csps	cpups	cspq	cpupq	dbgb1	dbgb2	rss	maxop	p50	p99	tag
216129	0	0	0.0	249.4	60.5	0.000	0.000	0.001	0.287	943	11.7	0.004	4	3.7	8.6	0.0	0.004	NA	NA	20m.pg1211.cx7
228409	0	0	0.0	236.7	57.5	0.000	0.000	0.001	0.258	966	12.2	0.004	4	3.7	8.6	0.0	0.004	NA	NA	20m.pg137.cx7
233721	0	0	0.0	241.7	58.6	0.000	0.000	0.001	0.257	937	12.1	0.004	4	3.7	8.6	0.0	0.003	NA	NA	20m.pg146.cx7
239286	0	0	0.0	215.6	51.2	0.000	0.000	0.001	0.219	960	12.2	0.004	4	3.7	8.6	0.0	0.004	NA	NA	20m.pg151.cx7
l.i1
l.i1: continue load after secondary indexes created
Performance metrics for all DBMS, not just the ones listed above. Some are normalized by throughput, others are not. Legend for results is here.
ips	qps	rps	rmbps	wps	wmbps	rpq	rkbpq	wpi	wkbpi	csps	cpups	cspq	cpupq	dbgb1	dbgb2	rss	maxop	p50	p99	tag
27894	0	0	0.0	263.0	46.3	0.000	0.000	0.009	1.701	7124	19.2	0.255	55	8.2	17.3	0.0	0.041	28543	19878	20m.pg1211.cx7
28248	0	0	0.0	257.8	50.2	0.000	0.000	0.009	1.821	7242	18.8	0.256	53	8.2	17.9	0.0	0.073	28968	20228	20m.pg137.cx7
27816	0	0	0.0	233.7	47.2	0.000	0.000	0.008	1.738	7164	18.1	0.258	52	8.2	18.5	0.0	0.041	28469	20122	20m.pg146.cx7
27855	0	0	0.0	231.2	47.8	0.000	0.000	0.008	1.757	7141	18.1	0.256	52	8.2	18.6	0.0	0.057	28568	18678	20m.pg151.cx7
q100.1
q100.1: range queries with 100 insert/s per client
Performance metrics for all DBMS, not just the ones listed above. Some are normalized by throughput, others are not. Legend for results is here.
ips	qps	rps	rmbps	wps	wmbps	rpq	rkbpq	wpi	wkbpi	csps	cpups	cspq	cpupq	dbgb1	dbgb2	rss	maxop	p50	p99	tag
100	8250	0	0.0	205.1	5.3	0.000	0.000	2.055	54.664	31812	13.3	3.856	129	8.2	12.6	0.0	0.005	7767	7669	20m.pg1211.cx7
100	8153	0	0.0	202.2	4.6	0.000	0.000	2.026	46.902	31442	13.3	3.856	131	8.2	11.9	0.0	0.005	7735	7623	20m.pg137.cx7
100	8010	0	0.0	203.5	4.7	0.000	0.000	2.039	48.271	30854	13.1	3.852	131	8.2	13.8	0.0	0.004	7687	7590	20m.pg146.cx7
100	8152	0	0.0	204.5	4.7	0.000	0.000	2.049	48.243	31367	13.1	3.848	129	8.2	13.9	0.0	0.005	7639	7542	20m.pg151.cx7
q500.1
q500.1: range queries with 500 insert/s per client
Performance metrics for all DBMS, not just the ones listed above. Some are normalized by throughput, others are not. Legend for results is here.
ips	qps	rps	rmbps	wps	wmbps	rpq	rkbpq	wpi	wkbpi	csps	cpups	cspq	cpupq	dbgb1	dbgb2	rss	maxop	p50	p99	tag
499	8238	0	0.0	351.7	12.4	0.000	0.000	0.704	25.444	31883	13.7	3.870	133	8.7	12.0	0.0	0.003	7719	7608	20m.pg1211.cx7
499	8129	0	0.0	355.5	12.5	0.000	0.000	0.712	25.565	31473	13.9	3.872	137	8.7	11.9	0.0	0.005	7687	7575	20m.pg137.cx7
499	7985	0	0.0	357.3	11.8	0.000	0.000	0.716	24.129	30879	13.5	3.867	135	8.7	12.7	0.0	0.005	7639	7543	20m.pg146.cx7
499	7984	0	0.0	357.0	11.8	0.000	0.000	0.715	24.146	30841	13.4	3.863	134	8.7	12.7	0.0	0.006	7575	7480	20m.pg151.cx7
q1000.1
q1000.1: range queries with 1000 insert/s per client
Performance metrics for all DBMS, not just the ones listed above. Some are normalized by throughput, others are not. Legend for results is here.
ips	qps	rps	rmbps	wps	wmbps	rpq	rkbpq	wpi	wkbpi	csps	cpups	cspq	cpupq	dbgb1	dbgb2	rss	maxop	p50	p99	tag
999	8102	7	0.1	406.1	19.0	0.001	0.008	0.407	19.483	31537	15.1	3.893	149	10.6	14.6	0.0	0.005	7751	7622	20m.pg1211.cx7
998	8288	7	0.1	408.1	19.1	0.001	0.008	0.409	19.568	32245	14.8	3.891	143	10.6	14.6	0.0	0.005	7767	7623	20m.pg137.cx7
998	8061	7	0.1	438.3	17.5	0.001	0.008	0.439	17.941	31324	14.6	3.886	145	10.6	15.4	0.0	0.005	7687	7559	20m.pg146.cx7
998	8101	7	0.1	437.7	17.5	0.001	0.008	0.438	17.935	31448	14.4	3.882	142	10.6	15.4	0.0	0.005	7655	7513	20m.pg151.cx7
l.i0
- l.i0: load without secondary indexes
- Legend for results is here.
- Each entry lists the percentage of responses that fit in that bucket (slower than max time for previous bucket, faster than min time for next bucket).
Insert response time histogram
256us	1ms	4ms	16ms	64ms	256ms	1s	4s	16s	gt	max	tag
0.000	0.000	100.000	0.000	0.000	0.000	0.000	0.000	0.000	0.000	0.004	pg1211.cx7
0.000	0.000	100.000	0.000	0.000	0.000	0.000	0.000	0.000	0.000	0.004	pg137.cx7
0.000	0.000	100.000	0.000	0.000	0.000	0.000	0.000	0.000	0.000	0.004	pg146.cx7
0.000	0.000	100.000	0.000	0.000	0.000	0.000	0.000	0.000	0.000	0.004	pg151.cx7
l.x
- l.x: create secondary indexes
- Legend for results is here.
- Each entry lists the percentage of responses that fit in that bucket (slower than max time for previous bucket, faster than min time for next bucket).
TODO - determine whether there is data for create index response time
l.i1
- l.i1: continue load after secondary indexes created
- Legend for results is here.
- Each entry lists the percentage of responses that fit in that bucket (slower than max time for previous bucket, faster than min time for next bucket).
Insert response time histogram
256us	1ms	4ms	16ms	64ms	256ms	1s	4s	16s	gt	max	tag
0.000	0.000	99.988	0.008	0.004	0.000	0.000	0.000	0.000	0.000	0.041	pg1211.cx7
0.000	0.000	99.984	0.011	0.004	nonzero	0.000	0.000	0.000	0.000	0.073	pg137.cx7
0.000	0.000	99.986	0.010	0.003	0.000	0.000	0.000	0.000	0.000	0.041	pg146.cx7
0.000	0.000	99.977	0.012	0.011	0.000	0.000	0.000	0.000	0.000	0.057	pg151.cx7
q100.1
- q100.1: range queries with 100 insert/s per client
- Legend for results is here.
- Each entry lists the percentage of responses that fit in that bucket (slower than max time for previous bucket, faster than min time for next bucket).
Query response time histogram
256us	1ms	4ms	16ms	64ms	256ms	1s	4s	16s	gt	max	tag
99.928	0.071	nonzero	nonzero	0.000	0.000	0.000	0.000	0.000	0.000	0.005	pg1211.cx7
99.934	0.066	nonzero	nonzero	0.000	0.000	0.000	0.000	0.000	0.000	0.005	pg137.cx7
99.935	0.065	nonzero	0.000	0.000	0.000	0.000	0.000	0.000	0.000	0.004	pg146.cx7
99.947	0.053	nonzero	nonzero	0.000	0.000	0.000	0.000	0.000	0.000	0.005	pg151.cx7
Insert response time histogram
256us	1ms	4ms	16ms	64ms	256ms	1s	4s	16s	gt	max	tag
0.000	0.000	99.833	0.167	0.000	0.000	0.000	0.000	0.000	0.000	0.006	pg1211.cx7
0.000	0.000	99.861	0.139	0.000	0.000	0.000	0.000	0.000	0.000	0.006	pg137.cx7
0.000	0.000	99.917	0.083	0.000	0.000	0.000	0.000	0.000	0.000	0.006	pg146.cx7
0.000	0.000	99.875	0.125	0.000	0.000	0.000	0.000	0.000	0.000	0.006	pg151.cx7
q500.1
- q500.1: range queries with 500 insert/s per client
- Legend for results is here.
- Each entry lists the percentage of responses that fit in that bucket (slower than max time for previous bucket, faster than min time for next bucket).
Query response time histogram
256us	1ms	4ms	16ms	64ms	256ms	1s	4s	16s	gt	max	tag
99.949	0.051	nonzero	0.000	0.000	0.000	0.000	0.000	0.000	0.000	0.003	pg1211.cx7
99.939	0.060	nonzero	nonzero	0.000	0.000	0.000	0.000	0.000	0.000	0.005	pg137.cx7
99.946	0.053	nonzero	nonzero	0.000	0.000	0.000	0.000	0.000	0.000	0.005	pg146.cx7
99.953	0.047	nonzero	nonzero	0.000	0.000	0.000	0.000	0.000	0.000	0.006	pg151.cx7
Insert response time histogram
256us	1ms	4ms	16ms	64ms	256ms	1s	4s	16s	gt	max	tag
0.000	0.000	99.881	0.119	0.000	0.000	0.000	0.000	0.000	0.000	0.008	pg1211.cx7
0.000	0.000	99.919	0.081	0.000	0.000	0.000	0.000	0.000	0.000	0.008	pg137.cx7
0.000	0.000	99.856	0.144	0.000	0.000	0.000	0.000	0.000	0.000	0.008	pg146.cx7
0.000	0.000	99.817	0.183	0.000	0.000	0.000	0.000	0.000	0.000	0.008	pg151.cx7
q1000.1
- q1000.1: range queries with 1000 insert/s per client
- Legend for results is here.
- Each entry lists the percentage of responses that fit in that bucket (slower than max time for previous bucket, faster than min time for next bucket).
Query response time histogram
256us	1ms	4ms	16ms	64ms	256ms	1s	4s	16s	gt	max	tag
99.934	0.066	nonzero	nonzero	0.000	0.000	0.000	0.000	0.000	0.000	0.005	pg1211.cx7
99.934	0.065	nonzero	nonzero	0.000	0.000	0.000	0.000	0.000	0.000	0.005	pg137.cx7
99.946	0.054	nonzero	nonzero	0.000	0.000	0.000	0.000	0.000	0.000	0.005	pg146.cx7
99.952	0.047	nonzero	nonzero	0.000	0.000	0.000	0.000	0.000	0.000	0.005	pg151.cx7
Insert response time histogram
256us	1ms	4ms	16ms	64ms	256ms	1s	4s	16s	gt	max	tag
0.000	0.000	97.451	2.518	0.031	0.000	0.000	0.000	0.000	0.000	0.043	pg1211.cx7
0.000	0.000	97.731	2.249	0.021	0.000	0.000	0.000	0.000	0.000	0.047	pg137.cx7
0.000	0.000	97.996	1.992	0.013	0.000	0.000	0.000	0.000	0.000	0.047	pg146.cx7
0.000	0.000	98.074	1.908	0.018	0.000	0.000	0.000	0.000	0.000	0.044	pg151.cx7