Introduction
This is a report for the insert benchmark with 20M docs and 4 client(s). It is generated by scripts (bash, awk, sed) and Tufte might not be impressed. An overview of the insert benchmark is here and a short update is here. Below, by DBMS, I mean DBMS+version.config. An example is my8020.c10b40 where my means MySQL, 8020 is version 8.0.20 and c10b40 is the name for the configuration file.
The test server has 8 AMD cores, 16G RAM and an NVMe SSD. It is described here. The benchmark was run with 4 clients and there were 1 or 2 connections per client (1 for queries, 1 for inserts). The benchmark loads 20M rows without secondary indexes, creates secondary indexes, loads another 20M rows then does 3 read+write tests for one hour each that do queries as fast as possible with 100, 500 and then 1000 writes/second/client concurrent with the queries. The database is cached by the storage engine and the only IO is for writes. Clients and the DBMS share one server. The per-database configs are in the per-database subdirectories here.
The tested DBMS are:
- my5651.cy8 - MySQL 5.6.51, InnoDB and the cy8 config
- my5739.cy8 - MySQL 5.7.39, InnoDB and the cy8 config
- my8031.cy8 - MySQL 8.0.31, InnoDB and the cy8 config
- fbmy5635.cay9c - FB MySQL 5.6.35, MyRocks and the cay9c config
- fbmy8028.cay9c - FB MySQL 8.0.28, MyRocks and the cay9c config
Contents
- Summary
- l.i0: load without secondary indexes
- l.x: create secondary indexes
- l.i1: continue load after secondary indexes created
- q100.1: range queries with 100 insert/s per client
- q500.1: range queries with 500 insert/s per client
- q1000.1: range queries with 1000 insert/s per client
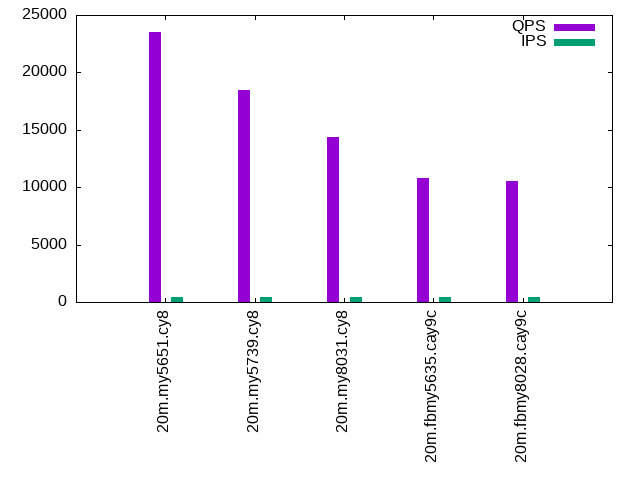
Summary
The numbers are inserts/s for l.i0 and l.i1, indexed docs (or rows) /s for l.x and queries/s for q*.2. The values are the average rate over the entire test for inserts (IPS) and queries (QPS). The range of values for IPS and QPS is split into 3 parts: bottom 25%, middle 50%, top 25%. Values in the bottom 25% have a red background, values in the top 25% have a green background and values in the middle have no color. A gray background is used for values that can be ignored because the DBMS did not sustain the target insert rate. Red backgrounds are not used when the minimum value is within 80% of the max value.
| dbms | l.i0 | l.x | l.i1 | q100.1 | q500.1 | q1000.1 |
|---|---|---|---|---|---|---|
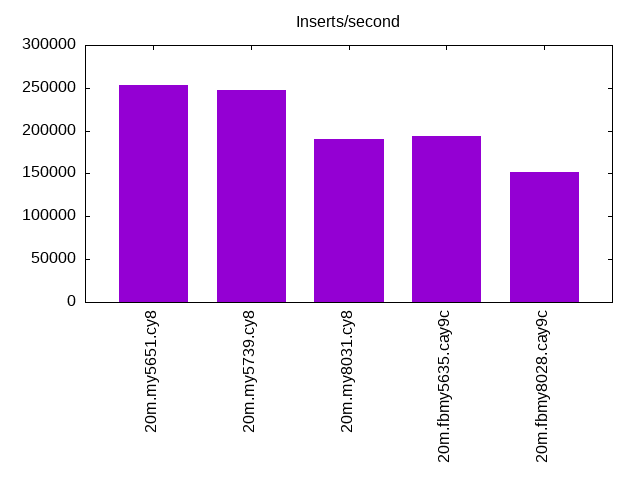
| 20m.my5651.cy8 | 253164 | 239286 | 92166 | 23556 | 23276 | 23546 |
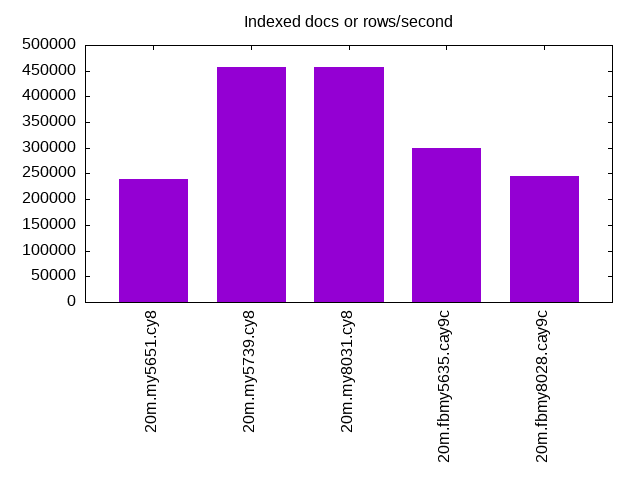
| 20m.my5739.cy8 | 246914 | 456818 | 95238 | 18446 | 18228 | 18326 |
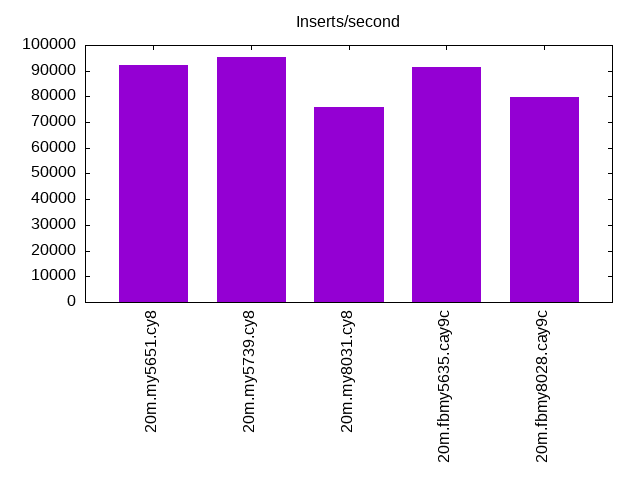
| 20m.my8031.cy8 | 190476 | 456818 | 76046 | 14411 | 14376 | 14175 |
| 20m.fbmy5635.cay9c | 194175 | 300000 | 91324 | 10776 | 10787 | 10880 |
| 20m.fbmy8028.cay9c | 151515 | 245122 | 79681 | 10562 | 10376 | 10467 |
This lists the average rate of inserts/s for the tests that do inserts concurrent with queries. For such tests the query rate is listed in the table above. The read+write tests are setup so that the insert rate should match the target rate every second. Cells that are not at least 95% of the target have a red background to indicate a failure to satisfy the target.
| dbms | q100.1 | q500.1 | q1000.1 |
|---|---|---|---|
| my5651.cy8 | 399 | 1996 | 3992 |
| my5739.cy8 | 399 | 1996 | 3992 |
| my8031.cy8 | 399 | 1996 | 3992 |
| fbmy5635.cay9c | 399 | 1996 | 3992 |
| fbmy8028.cay9c | 399 | 1996 | 3991 |
| target | 400 | 2000 | 4000 |
l.i0
l.i0: load without secondary indexes. Graphs for performance per 1-second interval are here.
Average throughput:
Insert response time histogram: each cell has the percentage of responses that take <= the time in the header and max is the max response time in seconds. For the max column values in the top 25% of the range have a red background and in the bottom 25% of the range have a green background. The red background is not used when the min value is within 80% of the max value.
| dbms | 256us | 1ms | 4ms | 16ms | 64ms | 256ms | 1s | 4s | 16s | gt | max |
|---|---|---|---|---|---|---|---|---|---|---|---|
| my5651.cy8 | 6.781 | 92.765 | 0.324 | 0.117 | 0.013 | 0.116 | |||||
| my5739.cy8 | 0.189 | 99.576 | 0.178 | 0.041 | 0.013 | 0.003 | 0.399 | ||||
| my8031.cy8 | 99.686 | 0.269 | 0.023 | 0.021 | 0.122 | ||||||
| fbmy5635.cay9c | 99.886 | 0.101 | 0.013 | 0.112 | |||||||
| fbmy8028.cay9c | 99.580 | 0.396 | 0.007 | 0.016 | 0.001 | 0.538 |
Performance metrics for the DBMS listed above. Some are normalized by throughput, others are not. Legend for results is here.
ips	qps	rps	rmbps	wps	wmbps	rpq	rkbpq	wpi	wkbpi	csps	cpups	cspq	cpupq	dbgb1	dbgb2	rss	maxop	p50	p99	tag
253164	0	2131	8.3	248.7	58.9	0.008	0.034	0.001	0.238	29212	65.9	0.115	21	1.3	41.8	2.1	0.116	73721	55840	20m.my5651.cy8
246914	0	0	0.0	360.8	60.0	0.000	0.000	0.001	0.249	26061	67.9	0.106	22	1.3	41.9	2.3	0.399	74219	45251	20m.my5739.cy8
190476	0	0	0.0	895.7	63.4	0.000	0.000	0.005	0.341	20816	65.3	0.109	27	1.3	3.8	2.5	0.122	54740	22775	20m.my8031.cy8
194175	0	0	0.0	258.8	59.5	0.000	0.000	0.001	0.314	19982	73.8	0.103	30	0.8	1.8	0.4	0.112	53542	13485	20m.fbmy5635.cay9c
151515	0	0	0.0	193.5	42.9	0.000	0.000	0.001	0.290	15625	67.2	0.103	35	0.7	1.9	0.7	0.538	41754	15689	20m.fbmy8028.cay9c
l.x
l.x: create secondary indexes.
Average throughput:
Performance metrics for the DBMS listed above. Some are normalized by throughput, others are not. Legend for results is here.
ips	qps	rps	rmbps	wps	wmbps	rpq	rkbpq	wpi	wkbpi	csps	cpups	cspq	cpupq	dbgb1	dbgb2	rss	maxop	p50	p99	tag
239286	0	509	2.0	6686.9	292.7	0.002	0.009	0.028	1.252	22479	41.4	0.094	14	2.7	43.2	3.5	0.019	NA	NA	20m.my5651.cy8
456818	0	0	0.0	5002.8	333.5	0.000	0.000	0.011	0.748	22798	38.7	0.050	7	3.0	43.5	3.8	0.015	NA	NA	20m.my5739.cy8
456818	0	2616	172.7	6185.1	404.7	0.006	0.387	0.014	0.907	20622	84.7	0.045	15	3.0	5.4	3.7	0.007	NA	NA	20m.my8031.cy8
300000	0	1	0.0	225.8	51.2	0.000	0.000	0.001	0.175	676	46.8	0.002	12	1.4	2.5	1.6	0.003	NA	NA	20m.fbmy5635.cay9c
245122	0	1	0.0	180.4	41.0	0.000	0.000	0.001	0.171	679	47.9	0.003	16	1.4	2.7	2.2	0.005	NA	NA	20m.fbmy8028.cay9c
l.i1
l.i1: continue load after secondary indexes created. Graphs for performance per 1-second interval are here.
Average throughput:
Insert response time histogram: each cell has the percentage of responses that take <= the time in the header and max is the max response time in seconds. For the max column values in the top 25% of the range have a red background and in the bottom 25% of the range have a green background. The red background is not used when the min value is within 80% of the max value.
| dbms | 256us | 1ms | 4ms | 16ms | 64ms | 256ms | 1s | 4s | 16s | gt | max |
|---|---|---|---|---|---|---|---|---|---|---|---|
| my5651.cy8 | 98.849 | 0.901 | 0.239 | 0.011 | 0.182 | ||||||
| my5739.cy8 | 99.384 | 0.480 | 0.120 | 0.015 | 0.001 | 0.280 | |||||
| my8031.cy8 | 98.698 | 0.960 | 0.296 | 0.043 | 0.003 | 0.414 | |||||
| fbmy5635.cay9c | 99.737 | 0.251 | 0.004 | 0.008 | 0.139 | ||||||
| fbmy8028.cay9c | 99.380 | 0.583 | 0.021 | 0.016 | 0.232 |
Performance metrics for the DBMS listed above. Some are normalized by throughput, others are not. Legend for results is here.
ips	qps	rps	rmbps	wps	wmbps	rpq	rkbpq	wpi	wkbpi	csps	cpups	cspq	cpupq	dbgb1	dbgb2	rss	maxop	p50	p99	tag
92166	0	1519	5.9	278.1	57.3	0.016	0.066	0.003	0.636	23392	58.6	0.254	51	8.0	48.5	7.9	0.182	24273	5543	20m.my5651.cy8
95238	0	0	0.0	725.2	70.6	0.000	0.000	0.008	0.759	20111	61.3	0.211	51	7.9	48.5	8.3	0.280	25282	2498	20m.my5739.cy8
76046	0	351	5.5	4638.7	162.4	0.005	0.074	0.061	2.187	28100	60.0	0.370	63	7.9	10.4	8.4	0.414	20377	1300	20m.my8031.cy8
91324	0	26	3.2	330.2	75.8	0.000	0.036	0.004	0.850	20035	75.3	0.219	66	4.0	5.8	1.8	0.139	23574	16132	20m.fbmy5635.cay9c
79681	0	14	1.7	292.3	66.5	0.000	0.022	0.004	0.855	17083	74.6	0.214	75	5.0	7.0	2.8	0.232	20434	15943	20m.fbmy8028.cay9c
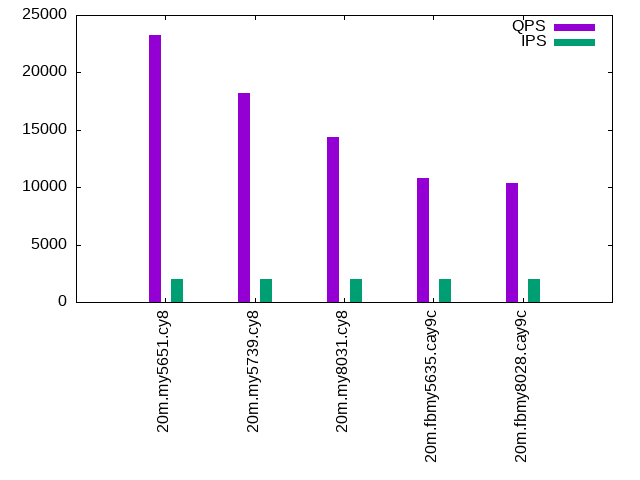
q100.1
q100.1: range queries with 100 insert/s per client. Graphs for performance per 1-second interval are here.
Average throughput:
Query response time histogram: each cell has the percentage of responses that take <= the time in the header and max is the max response time in seconds. For max values in the top 25% of the range have a red background and in the bottom 25% of the range have a green background. The red background is not used when the min value is within 80% of the max value.
| dbms | 256us | 1ms | 4ms | 16ms | 64ms | 256ms | 1s | 4s | 16s | gt | max |
|---|---|---|---|---|---|---|---|---|---|---|---|
| my5651.cy8 | 96.890 | 3.102 | 0.006 | 0.002 | nonzero | 0.049 | |||||
| my5739.cy8 | 83.506 | 16.489 | 0.005 | nonzero | nonzero | 0.048 | |||||
| my8031.cy8 | 53.847 | 46.147 | 0.006 | 0.001 | nonzero | 0.030 | |||||
| fbmy5635.cay9c | 12.369 | 87.616 | 0.013 | 0.003 | nonzero | nonzero | 0.102 | ||||
| fbmy8028.cay9c | 5.818 | 94.170 | 0.010 | 0.002 | nonzero | nonzero | 0.149 |
Insert response time histogram: each cell has the percentage of responses that take <= the time in the header and max is the max response time in seconds. For max values in the top 25% of the range have a red background and in the bottom 25% of the range have a green background. The red background is not used when the min value is within 80% of the max value.
| dbms | 256us | 1ms | 4ms | 16ms | 64ms | 256ms | 1s | 4s | 16s | gt | max |
|---|---|---|---|---|---|---|---|---|---|---|---|
| my5651.cy8 | 90.049 | 8.990 | 0.962 | 0.053 | |||||||
| my5739.cy8 | 99.149 | 0.816 | 0.035 | 0.054 | |||||||
| my8031.cy8 | 99.059 | 0.812 | 0.128 | 0.035 | |||||||
| fbmy5635.cay9c | 99.965 | 0.031 | 0.003 | 0.022 | |||||||
| fbmy8028.cay9c | 99.892 | 0.101 | 0.007 | 0.020 |
Performance metrics for the DBMS listed above. Some are normalized by throughput, others are not. Legend for results is here.
ips	qps	rps	rmbps	wps	wmbps	rpq	rkbpq	wpi	wkbpi	csps	cpups	cspq	cpupq	dbgb1	dbgb2	rss	maxop	p50	p99	tag
399	23556	7	0.0	80.0	2.6	0.000	0.001	0.200	6.729	90180	50.3	3.828	171	8.8	49.3	8.7	0.049	5930	5340	20m.my5651.cy8
399	18446	0	0.0	59.9	2.0	0.000	0.000	0.150	5.252	70652	51.2	3.830	222	8.8	49.3	9.0	0.048	4571	3916	20m.my5739.cy8
399	14411	0	0.0	283.5	7.4	0.000	0.000	0.710	18.987	55958	50.4	3.883	280	8.8	11.3	9.2	0.030	3612	2974	20m.my8031.cy8
399	10776	3	0.0	10.3	1.3	0.000	0.002	0.026	3.291	40896	50.3	3.795	373	2.9	4.9	6.9	0.102	2685	2333	20m.fbmy5635.cay9c
399	10562	9	0.1	9.3	1.5	0.001	0.009	0.023	3.918	39910	51.3	3.779	389	2.9	5.0	8.5	0.149	2670	2158	20m.fbmy8028.cay9c
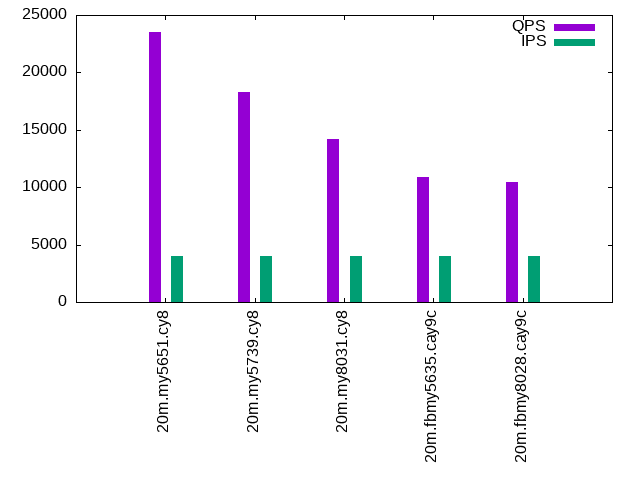
q500.1
q500.1: range queries with 500 insert/s per client. Graphs for performance per 1-second interval are here.
Average throughput:
Query response time histogram: each cell has the percentage of responses that take <= the time in the header and max is the max response time in seconds. For max values in the top 25% of the range have a red background and in the bottom 25% of the range have a green background. The red background is not used when the min value is within 80% of the max value.
| dbms | 256us | 1ms | 4ms | 16ms | 64ms | 256ms | 1s | 4s | 16s | gt | max |
|---|---|---|---|---|---|---|---|---|---|---|---|
| my5651.cy8 | 96.564 | 3.421 | 0.015 | 0.001 | 0.009 | ||||||
| my5739.cy8 | 83.131 | 16.854 | 0.014 | 0.001 | nonzero | 0.017 | |||||
| my8031.cy8 | 53.180 | 46.802 | 0.017 | 0.002 | nonzero | 0.027 | |||||
| fbmy5635.cay9c | 10.952 | 88.994 | 0.049 | 0.005 | nonzero | 0.018 | |||||
| fbmy8028.cay9c | 3.589 | 96.367 | 0.041 | 0.004 | nonzero | 0.019 |
Insert response time histogram: each cell has the percentage of responses that take <= the time in the header and max is the max response time in seconds. For max values in the top 25% of the range have a red background and in the bottom 25% of the range have a green background. The red background is not used when the min value is within 80% of the max value.
| dbms | 256us | 1ms | 4ms | 16ms | 64ms | 256ms | 1s | 4s | 16s | gt | max |
|---|---|---|---|---|---|---|---|---|---|---|---|
| my5651.cy8 | 95.919 | 4.076 | 0.005 | 0.027 | |||||||
| my5739.cy8 | 99.172 | 0.824 | 0.005 | 0.023 | |||||||
| my8031.cy8 | 97.888 | 2.013 | 0.056 | 0.042 | 0.113 | ||||||
| fbmy5635.cay9c | 98.948 | 1.038 | 0.015 | 0.023 | |||||||
| fbmy8028.cay9c | 95.422 | 4.533 | 0.046 | 0.028 |
Performance metrics for the DBMS listed above. Some are normalized by throughput, others are not. Legend for results is here.
ips	qps	rps	rmbps	wps	wmbps	rpq	rkbpq	wpi	wkbpi	csps	cpups	cspq	cpupq	dbgb1	dbgb2	rss	maxop	p50	p99	tag
1996	23276	33	0.1	5.9	0.9	0.001	0.006	0.003	0.484	88461	51.1	3.801	176	9.9	50.4	9.7	0.009	5770	5242	20m.my5651.cy8
1996	18228	0	0.0	21.8	1.3	0.000	0.000	0.011	0.681	69307	52.0	3.802	228	9.9	50.4	10.0	0.017	4541	3932	20m.my5739.cy8
1996	14376	0	0.0	637.4	16.8	0.000	0.000	0.319	8.606	56257	51.7	3.913	288	9.9	12.3	10.1	0.027	3596	3005	20m.my8031.cy8
1996	10787	2	0.3	18.7	3.2	0.000	0.026	0.009	1.649	40450	51.6	3.750	383	3.4	4.3	10.5	0.018	2685	2349	20m.fbmy5635.cay9c
1996	10376	2	0.3	15.9	3.0	0.000	0.027	0.008	1.513	38736	52.5	3.733	405	3.4	4.5	10.9	0.019	2621	2142	20m.fbmy8028.cay9c
q1000.1
q1000.1: range queries with 1000 insert/s per client. Graphs for performance per 1-second interval are here.
Average throughput:
Query response time histogram: each cell has the percentage of responses that take <= the time in the header and max is the max response time in seconds. For max values in the top 25% of the range have a red background and in the bottom 25% of the range have a green background. The red background is not used when the min value is within 80% of the max value.
| dbms | 256us | 1ms | 4ms | 16ms | 64ms | 256ms | 1s | 4s | 16s | gt | max |
|---|---|---|---|---|---|---|---|---|---|---|---|
| my5651.cy8 | 96.813 | 3.161 | 0.025 | 0.001 | nonzero | 0.033 | |||||
| my5739.cy8 | 84.257 | 15.716 | 0.025 | 0.003 | nonzero | 0.025 | |||||
| my8031.cy8 | 50.311 | 49.649 | 0.038 | 0.003 | nonzero | 0.022 | |||||
| fbmy5635.cay9c | 10.135 | 89.719 | 0.136 | 0.010 | nonzero | 0.049 | |||||
| fbmy8028.cay9c | 3.620 | 96.286 | 0.087 | 0.006 | nonzero | 0.024 |
Insert response time histogram: each cell has the percentage of responses that take <= the time in the header and max is the max response time in seconds. For max values in the top 25% of the range have a red background and in the bottom 25% of the range have a green background. The red background is not used when the min value is within 80% of the max value.
| dbms | 256us | 1ms | 4ms | 16ms | 64ms | 256ms | 1s | 4s | 16s | gt | max |
|---|---|---|---|---|---|---|---|---|---|---|---|
| my5651.cy8 | 97.776 | 2.209 | 0.015 | 0.039 | |||||||
| my5739.cy8 | 96.293 | 3.612 | 0.094 | 0.001 | 0.082 | ||||||
| my8031.cy8 | 98.853 | 1.109 | 0.026 | 0.012 | 0.110 | ||||||
| fbmy5635.cay9c | 87.679 | 12.276 | 0.045 | 0.027 | |||||||
| fbmy8028.cay9c | 94.752 | 5.213 | 0.035 | 0.032 |
Performance metrics for the DBMS listed above. Some are normalized by throughput, others are not. Legend for results is here.
ips	qps	rps	rmbps	wps	wmbps	rpq	rkbpq	wpi	wkbpi	csps	cpups	cspq	cpupq	dbgb1	dbgb2	rss	maxop	p50	p99	tag
3992	23546	68	0.3	113.0	4.5	0.003	0.012	0.028	1.144	89189	52.0	3.788	177	10.9	51.4	10.6	0.033	5866	5290	20m.my5651.cy8
3992	18326	0	0.0	132.6	4.9	0.000	0.000	0.033	1.269	69092	53.2	3.770	232	10.9	51.4	11.0	0.025	4619	3964	20m.my5739.cy8
3992	14175	0	0.0	936.7	24.8	0.000	0.000	0.235	6.367	55497	53.1	3.915	300	10.9	13.3	11.0	0.022	3532	2973	20m.my8031.cy8
3992	10880	8	1.0	33.0	6.4	0.001	0.092	0.008	1.635	40142	53.6	3.690	394	4.5	5.2	10.6	0.049	2686	2348	20m.fbmy5635.cay9c
3991	10467	8	1.0	31.7	6.5	0.001	0.096	0.008	1.676	38019	55.1	3.632	421	4.5	5.4	10.9	0.024	2622	2222	20m.fbmy8028.cay9c
l.i0
l.i0: load without secondary indexes
Performance metrics for all DBMS, not just the ones listed above. Some are normalized by throughput, others are not. Legend for results is here.
ips	qps	rps	rmbps	wps	wmbps	rpq	rkbpq	wpi	wkbpi	csps	cpups	cspq	cpupq	dbgb1	dbgb2	rss	maxop	p50	p99	tag
253164	0	2131	8.3	248.7	58.9	0.008	0.034	0.001	0.238	29212	65.9	0.115	21	1.3	41.8	2.1	0.116	73721	55840	20m.my5651.cy8
246914	0	0	0.0	360.8	60.0	0.000	0.000	0.001	0.249	26061	67.9	0.106	22	1.3	41.9	2.3	0.399	74219	45251	20m.my5739.cy8
190476	0	0	0.0	895.7	63.4	0.000	0.000	0.005	0.341	20816	65.3	0.109	27	1.3	3.8	2.5	0.122	54740	22775	20m.my8031.cy8
194175	0	0	0.0	258.8	59.5	0.000	0.000	0.001	0.314	19982	73.8	0.103	30	0.8	1.8	0.4	0.112	53542	13485	20m.fbmy5635.cay9c
151515	0	0	0.0	193.5	42.9	0.000	0.000	0.001	0.290	15625	67.2	0.103	35	0.7	1.9	0.7	0.538	41754	15689	20m.fbmy8028.cay9c
l.x
l.x: create secondary indexes
Performance metrics for all DBMS, not just the ones listed above. Some are normalized by throughput, others are not. Legend for results is here.
ips	qps	rps	rmbps	wps	wmbps	rpq	rkbpq	wpi	wkbpi	csps	cpups	cspq	cpupq	dbgb1	dbgb2	rss	maxop	p50	p99	tag
239286	0	509	2.0	6686.9	292.7	0.002	0.009	0.028	1.252	22479	41.4	0.094	14	2.7	43.2	3.5	0.019	NA	NA	20m.my5651.cy8
456818	0	0	0.0	5002.8	333.5	0.000	0.000	0.011	0.748	22798	38.7	0.050	7	3.0	43.5	3.8	0.015	NA	NA	20m.my5739.cy8
456818	0	2616	172.7	6185.1	404.7	0.006	0.387	0.014	0.907	20622	84.7	0.045	15	3.0	5.4	3.7	0.007	NA	NA	20m.my8031.cy8
300000	0	1	0.0	225.8	51.2	0.000	0.000	0.001	0.175	676	46.8	0.002	12	1.4	2.5	1.6	0.003	NA	NA	20m.fbmy5635.cay9c
245122	0	1	0.0	180.4	41.0	0.000	0.000	0.001	0.171	679	47.9	0.003	16	1.4	2.7	2.2	0.005	NA	NA	20m.fbmy8028.cay9c
l.i1
l.i1: continue load after secondary indexes created
Performance metrics for all DBMS, not just the ones listed above. Some are normalized by throughput, others are not. Legend for results is here.
ips	qps	rps	rmbps	wps	wmbps	rpq	rkbpq	wpi	wkbpi	csps	cpups	cspq	cpupq	dbgb1	dbgb2	rss	maxop	p50	p99	tag
92166	0	1519	5.9	278.1	57.3	0.016	0.066	0.003	0.636	23392	58.6	0.254	51	8.0	48.5	7.9	0.182	24273	5543	20m.my5651.cy8
95238	0	0	0.0	725.2	70.6	0.000	0.000	0.008	0.759	20111	61.3	0.211	51	7.9	48.5	8.3	0.280	25282	2498	20m.my5739.cy8
76046	0	351	5.5	4638.7	162.4	0.005	0.074	0.061	2.187	28100	60.0	0.370	63	7.9	10.4	8.4	0.414	20377	1300	20m.my8031.cy8
91324	0	26	3.2	330.2	75.8	0.000	0.036	0.004	0.850	20035	75.3	0.219	66	4.0	5.8	1.8	0.139	23574	16132	20m.fbmy5635.cay9c
79681	0	14	1.7	292.3	66.5	0.000	0.022	0.004	0.855	17083	74.6	0.214	75	5.0	7.0	2.8	0.232	20434	15943	20m.fbmy8028.cay9c
q100.1
q100.1: range queries with 100 insert/s per client
Performance metrics for all DBMS, not just the ones listed above. Some are normalized by throughput, others are not. Legend for results is here.
ips	qps	rps	rmbps	wps	wmbps	rpq	rkbpq	wpi	wkbpi	csps	cpups	cspq	cpupq	dbgb1	dbgb2	rss	maxop	p50	p99	tag
399	23556	7	0.0	80.0	2.6	0.000	0.001	0.200	6.729	90180	50.3	3.828	171	8.8	49.3	8.7	0.049	5930	5340	20m.my5651.cy8
399	18446	0	0.0	59.9	2.0	0.000	0.000	0.150	5.252	70652	51.2	3.830	222	8.8	49.3	9.0	0.048	4571	3916	20m.my5739.cy8
399	14411	0	0.0	283.5	7.4	0.000	0.000	0.710	18.987	55958	50.4	3.883	280	8.8	11.3	9.2	0.030	3612	2974	20m.my8031.cy8
399	10776	3	0.0	10.3	1.3	0.000	0.002	0.026	3.291	40896	50.3	3.795	373	2.9	4.9	6.9	0.102	2685	2333	20m.fbmy5635.cay9c
399	10562	9	0.1	9.3	1.5	0.001	0.009	0.023	3.918	39910	51.3	3.779	389	2.9	5.0	8.5	0.149	2670	2158	20m.fbmy8028.cay9c
q500.1
q500.1: range queries with 500 insert/s per client
Performance metrics for all DBMS, not just the ones listed above. Some are normalized by throughput, others are not. Legend for results is here.
ips	qps	rps	rmbps	wps	wmbps	rpq	rkbpq	wpi	wkbpi	csps	cpups	cspq	cpupq	dbgb1	dbgb2	rss	maxop	p50	p99	tag
1996	23276	33	0.1	5.9	0.9	0.001	0.006	0.003	0.484	88461	51.1	3.801	176	9.9	50.4	9.7	0.009	5770	5242	20m.my5651.cy8
1996	18228	0	0.0	21.8	1.3	0.000	0.000	0.011	0.681	69307	52.0	3.802	228	9.9	50.4	10.0	0.017	4541	3932	20m.my5739.cy8
1996	14376	0	0.0	637.4	16.8	0.000	0.000	0.319	8.606	56257	51.7	3.913	288	9.9	12.3	10.1	0.027	3596	3005	20m.my8031.cy8
1996	10787	2	0.3	18.7	3.2	0.000	0.026	0.009	1.649	40450	51.6	3.750	383	3.4	4.3	10.5	0.018	2685	2349	20m.fbmy5635.cay9c
1996	10376	2	0.3	15.9	3.0	0.000	0.027	0.008	1.513	38736	52.5	3.733	405	3.4	4.5	10.9	0.019	2621	2142	20m.fbmy8028.cay9c
q1000.1
q1000.1: range queries with 1000 insert/s per client
Performance metrics for all DBMS, not just the ones listed above. Some are normalized by throughput, others are not. Legend for results is here.
ips	qps	rps	rmbps	wps	wmbps	rpq	rkbpq	wpi	wkbpi	csps	cpups	cspq	cpupq	dbgb1	dbgb2	rss	maxop	p50	p99	tag
3992	23546	68	0.3	113.0	4.5	0.003	0.012	0.028	1.144	89189	52.0	3.788	177	10.9	51.4	10.6	0.033	5866	5290	20m.my5651.cy8
3992	18326	0	0.0	132.6	4.9	0.000	0.000	0.033	1.269	69092	53.2	3.770	232	10.9	51.4	11.0	0.025	4619	3964	20m.my5739.cy8
3992	14175	0	0.0	936.7	24.8	0.000	0.000	0.235	6.367	55497	53.1	3.915	300	10.9	13.3	11.0	0.022	3532	2973	20m.my8031.cy8
3992	10880	8	1.0	33.0	6.4	0.001	0.092	0.008	1.635	40142	53.6	3.690	394	4.5	5.2	10.6	0.049	2686	2348	20m.fbmy5635.cay9c
3991	10467	8	1.0	31.7	6.5	0.001	0.096	0.008	1.676	38019	55.1	3.632	421	4.5	5.4	10.9	0.024	2622	2222	20m.fbmy8028.cay9c
l.i0
- l.i0: load without secondary indexes
- Legend for results is here.
- Each entry lists the percentage of responses that fit in that bucket (slower than max time for previous bucket, faster than min time for next bucket).
Insert response time histogram
256us	1ms	4ms	16ms	64ms	256ms	1s	4s	16s	gt	max	tag
0.000	6.781	92.765	0.324	0.117	0.013	0.000	0.000	0.000	0.000	0.116	my5651.cy8
0.000	0.189	99.576	0.178	0.041	0.013	0.003	0.000	0.000	0.000	0.399	my5739.cy8
0.000	0.000	99.686	0.269	0.023	0.021	0.000	0.000	0.000	0.000	0.122	my8031.cy8
0.000	0.000	99.886	0.101	0.000	0.013	0.000	0.000	0.000	0.000	0.112	fbmy5635.cay9c
0.000	0.000	99.580	0.396	0.007	0.016	0.001	0.000	0.000	0.000	0.538	fbmy8028.cay9c
l.x
- l.x: create secondary indexes
- Legend for results is here.
- Each entry lists the percentage of responses that fit in that bucket (slower than max time for previous bucket, faster than min time for next bucket).
TODO - determine whether there is data for create index response time
l.i1
- l.i1: continue load after secondary indexes created
- Legend for results is here.
- Each entry lists the percentage of responses that fit in that bucket (slower than max time for previous bucket, faster than min time for next bucket).
Insert response time histogram
256us	1ms	4ms	16ms	64ms	256ms	1s	4s	16s	gt	max	tag
0.000	0.000	98.849	0.901	0.239	0.011	0.000	0.000	0.000	0.000	0.182	my5651.cy8
0.000	0.000	99.384	0.480	0.120	0.015	0.001	0.000	0.000	0.000	0.280	my5739.cy8
0.000	0.000	98.698	0.960	0.296	0.043	0.003	0.000	0.000	0.000	0.414	my8031.cy8
0.000	0.000	99.737	0.251	0.004	0.008	0.000	0.000	0.000	0.000	0.139	fbmy5635.cay9c
0.000	0.000	99.380	0.583	0.021	0.016	0.000	0.000	0.000	0.000	0.232	fbmy8028.cay9c
q100.1
- q100.1: range queries with 100 insert/s per client
- Legend for results is here.
- Each entry lists the percentage of responses that fit in that bucket (slower than max time for previous bucket, faster than min time for next bucket).
Query response time histogram
256us	1ms	4ms	16ms	64ms	256ms	1s	4s	16s	gt	max	tag
96.890	3.102	0.006	0.002	nonzero	0.000	0.000	0.000	0.000	0.000	0.049	my5651.cy8
83.506	16.489	0.005	nonzero	nonzero	0.000	0.000	0.000	0.000	0.000	0.048	my5739.cy8
53.847	46.147	0.006	0.001	nonzero	0.000	0.000	0.000	0.000	0.000	0.030	my8031.cy8
12.369	87.616	0.013	0.003	nonzero	nonzero	0.000	0.000	0.000	0.000	0.102	fbmy5635.cay9c
5.818	94.170	0.010	0.002	nonzero	nonzero	0.000	0.000	0.000	0.000	0.149	fbmy8028.cay9c
Insert response time histogram
256us	1ms	4ms	16ms	64ms	256ms	1s	4s	16s	gt	max	tag
0.000	0.000	90.049	8.990	0.962	0.000	0.000	0.000	0.000	0.000	0.053	my5651.cy8
0.000	0.000	99.149	0.816	0.035	0.000	0.000	0.000	0.000	0.000	0.054	my5739.cy8
0.000	0.000	99.059	0.812	0.128	0.000	0.000	0.000	0.000	0.000	0.035	my8031.cy8
0.000	0.000	99.965	0.031	0.003	0.000	0.000	0.000	0.000	0.000	0.022	fbmy5635.cay9c
0.000	0.000	99.892	0.101	0.007	0.000	0.000	0.000	0.000	0.000	0.020	fbmy8028.cay9c
q500.1
- q500.1: range queries with 500 insert/s per client
- Legend for results is here.
- Each entry lists the percentage of responses that fit in that bucket (slower than max time for previous bucket, faster than min time for next bucket).
Query response time histogram
256us	1ms	4ms	16ms	64ms	256ms	1s	4s	16s	gt	max	tag
96.564	3.421	0.015	0.001	0.000	0.000	0.000	0.000	0.000	0.000	0.009	my5651.cy8
83.131	16.854	0.014	0.001	nonzero	0.000	0.000	0.000	0.000	0.000	0.017	my5739.cy8
53.180	46.802	0.017	0.002	nonzero	0.000	0.000	0.000	0.000	0.000	0.027	my8031.cy8
10.952	88.994	0.049	0.005	nonzero	0.000	0.000	0.000	0.000	0.000	0.018	fbmy5635.cay9c
3.589	96.367	0.041	0.004	nonzero	0.000	0.000	0.000	0.000	0.000	0.019	fbmy8028.cay9c
Insert response time histogram
256us	1ms	4ms	16ms	64ms	256ms	1s	4s	16s	gt	max	tag
0.000	0.000	95.919	4.076	0.005	0.000	0.000	0.000	0.000	0.000	0.027	my5651.cy8
0.000	0.000	99.172	0.824	0.005	0.000	0.000	0.000	0.000	0.000	0.023	my5739.cy8
0.000	0.000	97.888	2.013	0.056	0.042	0.000	0.000	0.000	0.000	0.113	my8031.cy8
0.000	0.000	98.948	1.038	0.015	0.000	0.000	0.000	0.000	0.000	0.023	fbmy5635.cay9c
0.000	0.000	95.422	4.533	0.046	0.000	0.000	0.000	0.000	0.000	0.028	fbmy8028.cay9c
q1000.1
- q1000.1: range queries with 1000 insert/s per client
- Legend for results is here.
- Each entry lists the percentage of responses that fit in that bucket (slower than max time for previous bucket, faster than min time for next bucket).
Query response time histogram
256us	1ms	4ms	16ms	64ms	256ms	1s	4s	16s	gt	max	tag
96.813	3.161	0.025	0.001	nonzero	0.000	0.000	0.000	0.000	0.000	0.033	my5651.cy8
84.257	15.716	0.025	0.003	nonzero	0.000	0.000	0.000	0.000	0.000	0.025	my5739.cy8
50.311	49.649	0.038	0.003	nonzero	0.000	0.000	0.000	0.000	0.000	0.022	my8031.cy8
10.135	89.719	0.136	0.010	nonzero	0.000	0.000	0.000	0.000	0.000	0.049	fbmy5635.cay9c
3.620	96.286	0.087	0.006	nonzero	0.000	0.000	0.000	0.000	0.000	0.024	fbmy8028.cay9c
Insert response time histogram
256us	1ms	4ms	16ms	64ms	256ms	1s	4s	16s	gt	max	tag
0.000	0.000	97.776	2.209	0.015	0.000	0.000	0.000	0.000	0.000	0.039	my5651.cy8
0.000	0.000	96.293	3.612	0.094	0.001	0.000	0.000	0.000	0.000	0.082	my5739.cy8
0.000	0.000	98.853	1.109	0.026	0.012	0.000	0.000	0.000	0.000	0.110	my8031.cy8
0.000	0.000	87.679	12.276	0.045	0.000	0.000	0.000	0.000	0.000	0.027	fbmy5635.cay9c
0.000	0.000	94.752	5.213	0.035	0.000	0.000	0.000	0.000	0.000	0.032	fbmy8028.cay9c