Introduction
This is a report for the insert benchmark with 20M docs and 3 client(s). It is generated by scripts (bash, awk, sed) and Tufte might not be impressed. An overview of the insert benchmark is here and a short update is here. Below, by DBMS, I mean DBMS+version.config. An example is my8020.c10b40 where my means MySQL, 8020 is version 8.0.20 and c10b40 is the name for the configuration file.
The test server has 8 AMD cores, 16G RAM and an NVMe SSD. It is described here. The benchmark was run with 3 clients and there were 1 or 2 connections per client (1 for queries, 1 for inserts). The benchmark loads 20M rows without secondary indexes, creates secondary indexes, loads another 20M rows then does 3 read+write tests for one hour each that do queries as fast as possible with 100, 500 and then 1000 writes/second/client concurrent with the queries. The database is cached by the storage engine and the only IO is for writes. Clients and the DBMS share one server. The per-database configs are in the per-database subdirectories here.
The tested DBMS are:
- my5651.cy8 - MySQL 5.6.51, InnoDB and the cy8 config
- my5739.cy8 - MySQL 5.7.39, InnoDB and the cy8 config
- my8031.cy8 - MySQL 8.0.31, InnoDB and the cy8 config
- fbmy5635.cay9c - FB MySQL 5.6.35, MyRocks and the cay9c config
- fbmy8028.cay9c - FB MySQL 8.0.28, MyRocks and the cay9c config
Contents
- Summary
- l.i0: load without secondary indexes
- l.x: create secondary indexes
- l.i1: continue load after secondary indexes created
- q100.1: range queries with 100 insert/s per client
- q500.1: range queries with 500 insert/s per client
- q1000.1: range queries with 1000 insert/s per client
Summary
The numbers are inserts/s for l.i0 and l.i1, indexed docs (or rows) /s for l.x and queries/s for q*.2. The values are the average rate over the entire test for inserts (IPS) and queries (QPS). The range of values for IPS and QPS is split into 3 parts: bottom 25%, middle 50%, top 25%. Values in the bottom 25% have a red background, values in the top 25% have a green background and values in the middle have no color. A gray background is used for values that can be ignored because the DBMS did not sustain the target insert rate. Red backgrounds are not used when the minimum value is within 80% of the max value.
| dbms | l.i0 | l.x | l.i1 | q100.1 | q500.1 | q1000.1 |
|---|---|---|---|---|---|---|
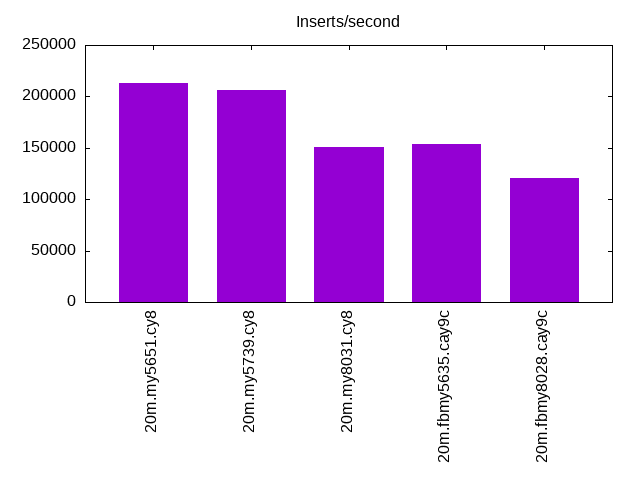
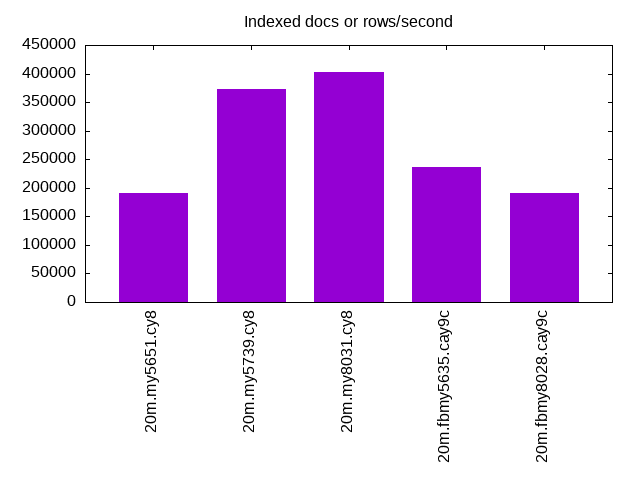
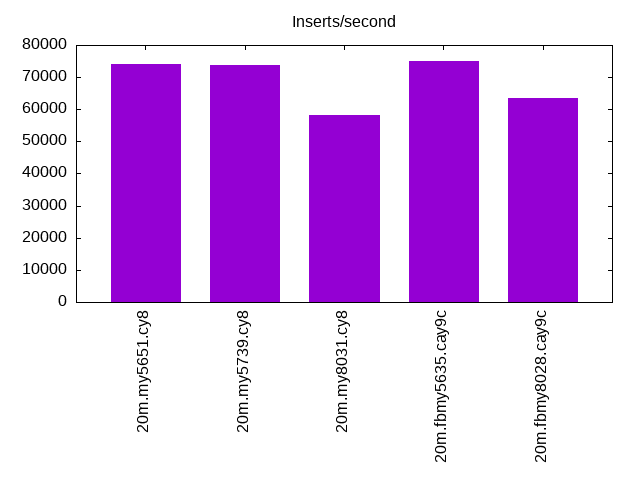
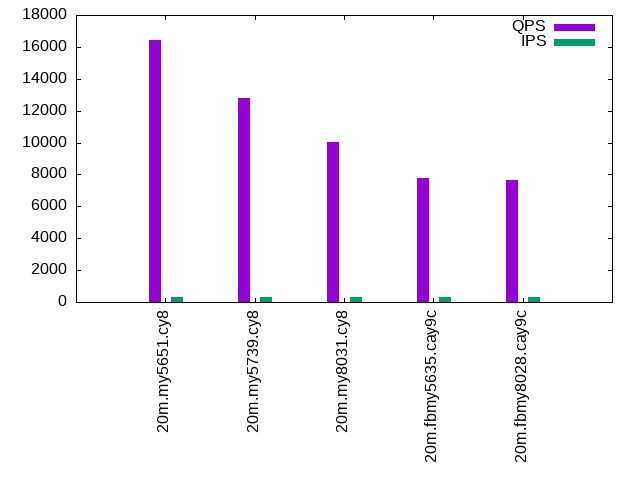
| 20m.my5651.cy8 | 212766 | 191428 | 74074 | 16452 | 16762 | 16662 |
| 20m.my5739.cy8 | 206186 | 372222 | 73801 | 12784 | 12798 | 13171 |
| 20m.my8031.cy8 | 150376 | 402000 | 58309 | 10017 | 10202 | 10217 |
| 20m.fbmy5635.cay9c | 153846 | 236470 | 74906 | 7769 | 7796 | 7928 |
| 20m.fbmy8028.cay9c | 120482 | 191428 | 63492 | 7630 | 7545 | 7731 |
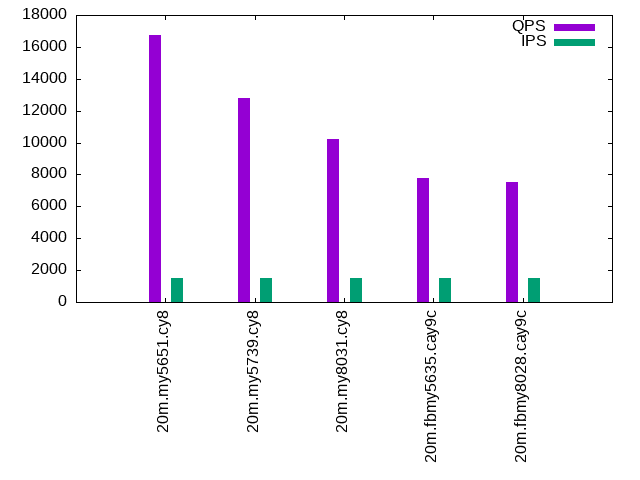
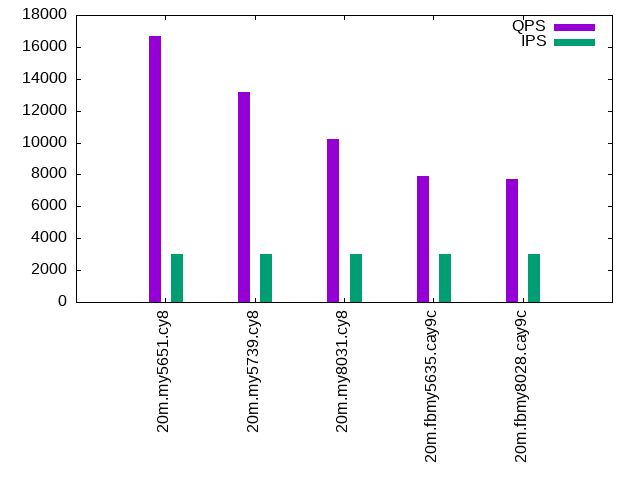
This lists the average rate of inserts/s for the tests that do inserts concurrent with queries. For such tests the query rate is listed in the table above. The read+write tests are setup so that the insert rate should match the target rate every second. Cells that are not at least 95% of the target have a red background to indicate a failure to satisfy the target.
| dbms | q100.1 | q500.1 | q1000.1 |
|---|---|---|---|
| my5651.cy8 | 300 | 1498 | 2995 |
| my5739.cy8 | 300 | 1498 | 2995 |
| my8031.cy8 | 300 | 1498 | 2995 |
| fbmy5635.cay9c | 300 | 1498 | 2995 |
| fbmy8028.cay9c | 300 | 1498 | 2995 |
| target | 300 | 1500 | 3000 |
l.i0
l.i0: load without secondary indexes. Graphs for performance per 1-second interval are here.
Average throughput:
Insert response time histogram: each cell has the percentage of responses that take <= the time in the header and max is the max response time in seconds. For the max column values in the top 25% of the range have a red background and in the bottom 25% of the range have a green background. The red background is not used when the min value is within 80% of the max value.
| dbms | 256us | 1ms | 4ms | 16ms | 64ms | 256ms | 1s | 4s | 16s | gt | max |
|---|---|---|---|---|---|---|---|---|---|---|---|
| my5651.cy8 | 12.758 | 86.813 | 0.312 | 0.107 | 0.010 | 0.122 | |||||
| my5739.cy8 | 0.304 | 99.481 | 0.184 | 0.019 | 0.009 | 0.002 | 0.403 | ||||
| my8031.cy8 | 99.731 | 0.245 | 0.012 | 0.011 | 0.112 | ||||||
| fbmy5635.cay9c | 99.979 | 0.011 | 0.010 | 0.107 | |||||||
| fbmy8028.cay9c | 99.802 | 0.185 | 0.003 | 0.010 | 0.113 |
Performance metrics for the DBMS listed above. Some are normalized by throughput, others are not. Legend for results is here.
ips	qps	rps	rmbps	wps	wmbps	rpq	rkbpq	wpi	wkbpi	csps	cpups	cspq	cpupq	dbgb1	dbgb2	rss	maxop	p50	p99	tag
212766	0	1804	7.1	208.1	49.4	0.008	0.034	0.001	0.238	24274	54.0	0.114	20	1.3	41.8	2.1	0.122	80214	44351	20m.my5651.cy8
206186	0	0	0.0	319.3	50.5	0.000	0.000	0.002	0.251	21142	55.2	0.103	21	1.3	41.9	2.3	0.403	78115	35461	20m.my5739.cy8
150376	0	0	0.0	753.8	51.6	0.000	0.000	0.005	0.352	16749	54.1	0.111	29	1.3	3.8	2.5	0.112	55240	20984	20m.my8031.cy8
153846	0	0	0.0	200.5	45.9	0.000	0.000	0.001	0.306	16014	57.0	0.104	30	0.7	1.7	0.4	0.107	55041	44471	20m.fbmy5635.cay9c
120482	0	0	0.0	153.1	33.4	0.000	0.000	0.001	0.284	12902	54.8	0.107	36	0.7	1.9	0.7	0.113	42653	37159	20m.fbmy8028.cay9c
l.x
l.x: create secondary indexes.
Average throughput:
Performance metrics for the DBMS listed above. Some are normalized by throughput, others are not. Legend for results is here.
ips	qps	rps	rmbps	wps	wmbps	rpq	rkbpq	wpi	wkbpi	csps	cpups	cspq	cpupq	dbgb1	dbgb2	rss	maxop	p50	p99	tag
191428	0	553	2.2	6526.0	257.6	0.003	0.012	0.034	1.378	20695	30.2	0.108	13	2.7	43.2	3.5	0.006	NA	NA	20m.my5651.cy8
372222	0	0	0.0	4554.6	294.8	0.000	0.000	0.012	0.811	22231	32.4	0.060	7	3.0	43.5	3.8	0.008	NA	NA	20m.my5739.cy8
402000	0	2101	138.5	8025.9	385.3	0.005	0.353	0.020	0.981	25785	77.5	0.064	15	3.0	5.4	3.7	0.016	NA	NA	20m.my8031.cy8
236470	0	0	0.0	168.6	38.2	0.000	0.000	0.001	0.166	651	35.9	0.003	12	1.4	2.4	1.5	0.003	NA	NA	20m.fbmy5635.cay9c
191428	0	0	0.0	136.9	31.0	0.000	0.000	0.001	0.166	710	35.0	0.004	15	1.4	2.7	2.1	0.005	NA	NA	20m.fbmy8028.cay9c
l.i1
l.i1: continue load after secondary indexes created. Graphs for performance per 1-second interval are here.
Average throughput:
Insert response time histogram: each cell has the percentage of responses that take <= the time in the header and max is the max response time in seconds. For the max column values in the top 25% of the range have a red background and in the bottom 25% of the range have a green background. The red background is not used when the min value is within 80% of the max value.
| dbms | 256us | 1ms | 4ms | 16ms | 64ms | 256ms | 1s | 4s | 16s | gt | max |
|---|---|---|---|---|---|---|---|---|---|---|---|
| my5651.cy8 | 98.979 | 0.811 | 0.205 | 0.004 | nonzero | 0.286 | |||||
| my5739.cy8 | 99.372 | 0.484 | 0.134 | 0.010 | 0.204 | ||||||
| my8031.cy8 | 98.920 | 0.786 | 0.271 | 0.021 | 0.001 | 0.415 | |||||
| fbmy5635.cay9c | 99.960 | 0.034 | 0.006 | 0.001 | 0.116 | ||||||
| fbmy8028.cay9c | 99.813 | 0.164 | 0.017 | 0.006 | 0.174 |
Performance metrics for the DBMS listed above. Some are normalized by throughput, others are not. Legend for results is here.
ips	qps	rps	rmbps	wps	wmbps	rpq	rkbpq	wpi	wkbpi	csps	cpups	cspq	cpupq	dbgb1	dbgb2	rss	maxop	p50	p99	tag
74074	0	1244	4.9	228.2	45.4	0.017	0.067	0.003	0.628	18475	46.8	0.249	51	7.8	48.3	7.8	0.286	25871	4595	20m.my5651.cy8
73801	0	0	0.0	717.3	58.5	0.000	0.000	0.010	0.812	16326	48.6	0.221	53	7.8	48.3	8.1	0.204	25972	3146	20m.my5739.cy8
58309	0	270	4.2	3582.1	124.3	0.005	0.074	0.061	2.183	22553	47.0	0.387	64	7.8	10.2	8.2	0.415	20431	1099	20m.my8031.cy8
74906	0	23	2.8	282.4	64.8	0.000	0.038	0.004	0.885	16526	65.9	0.221	70	3.9	5.7	1.8	0.116	25320	21477	20m.fbmy5635.cay9c
63492	0	19	2.4	244.2	55.5	0.000	0.038	0.004	0.896	14000	62.7	0.220	79	3.3	5.2	2.6	0.174	21426	17031	20m.fbmy8028.cay9c
q100.1
q100.1: range queries with 100 insert/s per client. Graphs for performance per 1-second interval are here.
Average throughput:
Query response time histogram: each cell has the percentage of responses that take <= the time in the header and max is the max response time in seconds. For max values in the top 25% of the range have a red background and in the bottom 25% of the range have a green background. The red background is not used when the min value is within 80% of the max value.
| dbms | 256us | 1ms | 4ms | 16ms | 64ms | 256ms | 1s | 4s | 16s | gt | max |
|---|---|---|---|---|---|---|---|---|---|---|---|
| my5651.cy8 | 95.701 | 4.295 | 0.003 | 0.001 | nonzero | 0.039 | |||||
| my5739.cy8 | 76.932 | 23.066 | 0.002 | nonzero | nonzero | 0.045 | |||||
| my8031.cy8 | 39.820 | 60.177 | 0.002 | nonzero | nonzero | 0.025 | |||||
| fbmy5635.cay9c | 5.906 | 94.091 | 0.003 | nonzero | nonzero | 0.032 | |||||
| fbmy8028.cay9c | 5.494 | 94.503 | 0.003 | nonzero | 0.006 |
Insert response time histogram: each cell has the percentage of responses that take <= the time in the header and max is the max response time in seconds. For max values in the top 25% of the range have a red background and in the bottom 25% of the range have a green background. The red background is not used when the min value is within 80% of the max value.
| dbms | 256us | 1ms | 4ms | 16ms | 64ms | 256ms | 1s | 4s | 16s | gt | max |
|---|---|---|---|---|---|---|---|---|---|---|---|
| my5651.cy8 | 89.597 | 9.685 | 0.718 | 0.056 | |||||||
| my5739.cy8 | 99.181 | 0.778 | 0.042 | 0.051 | |||||||
| my8031.cy8 | 98.852 | 0.991 | 0.157 | 0.030 | |||||||
| fbmy5635.cay9c | 100.000 | 0.004 | |||||||||
| fbmy8028.cay9c | 99.894 | 0.079 | 0.028 | 0.039 |
Performance metrics for the DBMS listed above. Some are normalized by throughput, others are not. Legend for results is here.
ips	qps	rps	rmbps	wps	wmbps	rpq	rkbpq	wpi	wkbpi	csps	cpups	cspq	cpupq	dbgb1	dbgb2	rss	maxop	p50	p99	tag
300	16452	5	0.0	80.5	2.6	0.000	0.001	0.269	8.727	63261	37.9	3.845	184	8.5	49.0	8.4	0.039	5450	5162	20m.my5651.cy8
300	12784	0	0.0	45.3	1.5	0.000	0.000	0.151	5.285	49159	38.5	3.845	241	8.5	49.0	8.7	0.045	4219	3836	20m.my5739.cy8
300	10017	0	0.0	243.2	6.3	0.000	0.000	0.812	21.470	39343	38.3	3.928	306	8.5	10.9	8.9	0.025	3292	2829	20m.my8031.cy8
300	7769	0	0.0	8.8	0.9	0.000	0.000	0.029	3.126	29898	38.2	3.849	393	2.9	4.7	5.7	0.032	2573	2318	20m.fbmy5635.cay9c
300	7630	0	0.0	7.5	1.1	0.000	0.000	0.025	3.695	29479	39.0	3.864	409	2.9	4.9	6.4	0.006	2525	2078	20m.fbmy8028.cay9c
q500.1
q500.1: range queries with 500 insert/s per client. Graphs for performance per 1-second interval are here.
Average throughput:
Query response time histogram: each cell has the percentage of responses that take <= the time in the header and max is the max response time in seconds. For max values in the top 25% of the range have a red background and in the bottom 25% of the range have a green background. The red background is not used when the min value is within 80% of the max value.
| dbms | 256us | 1ms | 4ms | 16ms | 64ms | 256ms | 1s | 4s | 16s | gt | max |
|---|---|---|---|---|---|---|---|---|---|---|---|
| my5651.cy8 | 95.908 | 4.085 | 0.007 | nonzero | 0.010 | ||||||
| my5739.cy8 | 76.946 | 23.048 | 0.006 | nonzero | nonzero | 0.022 | |||||
| my8031.cy8 | 43.046 | 56.945 | 0.008 | 0.001 | nonzero | 0.029 | |||||
| fbmy5635.cay9c | 7.962 | 92.024 | 0.014 | 0.001 | 0.008 | ||||||
| fbmy8028.cay9c | 3.688 | 96.294 | 0.017 | 0.001 | 0.012 |
Insert response time histogram: each cell has the percentage of responses that take <= the time in the header and max is the max response time in seconds. For max values in the top 25% of the range have a red background and in the bottom 25% of the range have a green background. The red background is not used when the min value is within 80% of the max value.
| dbms | 256us | 1ms | 4ms | 16ms | 64ms | 256ms | 1s | 4s | 16s | gt | max |
|---|---|---|---|---|---|---|---|---|---|---|---|
| my5651.cy8 | 95.266 | 4.734 | 0.015 | ||||||||
| my5739.cy8 | 99.523 | 0.475 | 0.002 | 0.024 | |||||||
| my8031.cy8 | 98.941 | 1.011 | 0.046 | 0.002 | 0.103 | ||||||
| fbmy5635.cay9c | 99.739 | 0.261 | 0.014 | ||||||||
| fbmy8028.cay9c | 99.313 | 0.686 | 0.001 | 0.016 |
Performance metrics for the DBMS listed above. Some are normalized by throughput, others are not. Legend for results is here.
ips	qps	rps	rmbps	wps	wmbps	rpq	rkbpq	wpi	wkbpi	csps	cpups	cspq	cpupq	dbgb1	dbgb2	rss	maxop	p50	p99	tag
1498	16762	24	0.1	5.2	0.9	0.001	0.006	0.004	0.592	64254	38.6	3.833	184	9.7	50.2	9.5	0.010	5562	5148	20m.my5651.cy8
1498	12798	0	0.0	12.9	1.1	0.000	0.000	0.009	0.718	49224	39.3	3.846	246	9.7	50.2	9.8	0.022	4267	3710	20m.my5739.cy8
1498	10202	0	0.0	554.4	14.6	0.000	0.000	0.370	10.004	40949	39.4	4.014	309	9.7	12.2	10.0	0.029	3342	2813	20m.my8031.cy8
1498	7796	0	0.0	12.9	2.0	0.000	0.000	0.009	1.380	30109	39.3	3.862	403	3.3	3.9	10.0	0.008	2557	2237	20m.fbmy5635.cay9c
1498	7545	0	0.0	10.8	2.0	0.000	0.000	0.007	1.341	29239	40.0	3.875	424	3.3	4.1	10.6	0.012	2493	2014	20m.fbmy8028.cay9c
q1000.1
q1000.1: range queries with 1000 insert/s per client. Graphs for performance per 1-second interval are here.
Average throughput:
Query response time histogram: each cell has the percentage of responses that take <= the time in the header and max is the max response time in seconds. For max values in the top 25% of the range have a red background and in the bottom 25% of the range have a green background. The red background is not used when the min value is within 80% of the max value.
| dbms | 256us | 1ms | 4ms | 16ms | 64ms | 256ms | 1s | 4s | 16s | gt | max |
|---|---|---|---|---|---|---|---|---|---|---|---|
| my5651.cy8 | 95.395 | 4.593 | 0.011 | nonzero | nonzero | 0.041 | |||||
| my5739.cy8 | 79.732 | 20.245 | 0.023 | 0.001 | nonzero | 0.046 | |||||
| my8031.cy8 | 43.353 | 56.618 | 0.028 | 0.001 | nonzero | 0.024 | |||||
| fbmy5635.cay9c | 9.256 | 90.716 | 0.028 | 0.001 | nonzero | 0.022 | |||||
| fbmy8028.cay9c | 4.133 | 95.824 | 0.042 | 0.001 | nonzero | 0.016 |
Insert response time histogram: each cell has the percentage of responses that take <= the time in the header and max is the max response time in seconds. For max values in the top 25% of the range have a red background and in the bottom 25% of the range have a green background. The red background is not used when the min value is within 80% of the max value.
| dbms | 256us | 1ms | 4ms | 16ms | 64ms | 256ms | 1s | 4s | 16s | gt | max |
|---|---|---|---|---|---|---|---|---|---|---|---|
| my5651.cy8 | 94.723 | 5.233 | 0.044 | 0.050 | |||||||
| my5739.cy8 | 99.174 | 0.821 | 0.005 | nonzero | 0.076 | ||||||
| my8031.cy8 | 97.700 | 2.253 | 0.028 | 0.018 | 0.110 | ||||||
| fbmy5635.cay9c | 97.469 | 2.527 | 0.004 | 0.026 | |||||||
| fbmy8028.cay9c | 94.917 | 5.077 | 0.006 | 0.038 |
Performance metrics for the DBMS listed above. Some are normalized by throughput, others are not. Legend for results is here.
ips	qps	rps	rmbps	wps	wmbps	rpq	rkbpq	wpi	wkbpi	csps	cpups	cspq	cpupq	dbgb1	dbgb2	rss	maxop	p50	p99	tag
2995	16662	48	0.2	65.5	2.8	0.003	0.011	0.022	0.954	63957	39.4	3.839	189	10.5	51.0	10.3	0.041	5514	5133	20m.my5651.cy8
2995	13171	0	0.0	91.7	3.4	0.000	0.000	0.031	1.168	50661	40.3	3.847	245	10.5	51.0	10.6	0.046	4379	3820	20m.my5739.cy8
2995	10217	0	0.0	784.3	20.6	0.000	0.000	0.262	7.059	41372	40.5	4.049	317	10.5	13.0	10.8	0.024	3358	2893	20m.my8031.cy8
2995	7928	3	0.3	23.6	4.4	0.000	0.044	0.008	1.513	30552	41.0	3.854	414	4.1	6.0	10.5	0.022	2637	2333	20m.fbmy5635.cay9c
2995	7731	4	0.5	22.6	4.6	0.001	0.067	0.008	1.572	29833	42.2	3.859	437	4.0	6.2	10.9	0.016	2573	2126	20m.fbmy8028.cay9c
l.i0
l.i0: load without secondary indexes
Performance metrics for all DBMS, not just the ones listed above. Some are normalized by throughput, others are not. Legend for results is here.
ips	qps	rps	rmbps	wps	wmbps	rpq	rkbpq	wpi	wkbpi	csps	cpups	cspq	cpupq	dbgb1	dbgb2	rss	maxop	p50	p99	tag
212766	0	1804	7.1	208.1	49.4	0.008	0.034	0.001	0.238	24274	54.0	0.114	20	1.3	41.8	2.1	0.122	80214	44351	20m.my5651.cy8
206186	0	0	0.0	319.3	50.5	0.000	0.000	0.002	0.251	21142	55.2	0.103	21	1.3	41.9	2.3	0.403	78115	35461	20m.my5739.cy8
150376	0	0	0.0	753.8	51.6	0.000	0.000	0.005	0.352	16749	54.1	0.111	29	1.3	3.8	2.5	0.112	55240	20984	20m.my8031.cy8
153846	0	0	0.0	200.5	45.9	0.000	0.000	0.001	0.306	16014	57.0	0.104	30	0.7	1.7	0.4	0.107	55041	44471	20m.fbmy5635.cay9c
120482	0	0	0.0	153.1	33.4	0.000	0.000	0.001	0.284	12902	54.8	0.107	36	0.7	1.9	0.7	0.113	42653	37159	20m.fbmy8028.cay9c
l.x
l.x: create secondary indexes
Performance metrics for all DBMS, not just the ones listed above. Some are normalized by throughput, others are not. Legend for results is here.
ips	qps	rps	rmbps	wps	wmbps	rpq	rkbpq	wpi	wkbpi	csps	cpups	cspq	cpupq	dbgb1	dbgb2	rss	maxop	p50	p99	tag
191428	0	553	2.2	6526.0	257.6	0.003	0.012	0.034	1.378	20695	30.2	0.108	13	2.7	43.2	3.5	0.006	NA	NA	20m.my5651.cy8
372222	0	0	0.0	4554.6	294.8	0.000	0.000	0.012	0.811	22231	32.4	0.060	7	3.0	43.5	3.8	0.008	NA	NA	20m.my5739.cy8
402000	0	2101	138.5	8025.9	385.3	0.005	0.353	0.020	0.981	25785	77.5	0.064	15	3.0	5.4	3.7	0.016	NA	NA	20m.my8031.cy8
236470	0	0	0.0	168.6	38.2	0.000	0.000	0.001	0.166	651	35.9	0.003	12	1.4	2.4	1.5	0.003	NA	NA	20m.fbmy5635.cay9c
191428	0	0	0.0	136.9	31.0	0.000	0.000	0.001	0.166	710	35.0	0.004	15	1.4	2.7	2.1	0.005	NA	NA	20m.fbmy8028.cay9c
l.i1
l.i1: continue load after secondary indexes created
Performance metrics for all DBMS, not just the ones listed above. Some are normalized by throughput, others are not. Legend for results is here.
ips	qps	rps	rmbps	wps	wmbps	rpq	rkbpq	wpi	wkbpi	csps	cpups	cspq	cpupq	dbgb1	dbgb2	rss	maxop	p50	p99	tag
74074	0	1244	4.9	228.2	45.4	0.017	0.067	0.003	0.628	18475	46.8	0.249	51	7.8	48.3	7.8	0.286	25871	4595	20m.my5651.cy8
73801	0	0	0.0	717.3	58.5	0.000	0.000	0.010	0.812	16326	48.6	0.221	53	7.8	48.3	8.1	0.204	25972	3146	20m.my5739.cy8
58309	0	270	4.2	3582.1	124.3	0.005	0.074	0.061	2.183	22553	47.0	0.387	64	7.8	10.2	8.2	0.415	20431	1099	20m.my8031.cy8
74906	0	23	2.8	282.4	64.8	0.000	0.038	0.004	0.885	16526	65.9	0.221	70	3.9	5.7	1.8	0.116	25320	21477	20m.fbmy5635.cay9c
63492	0	19	2.4	244.2	55.5	0.000	0.038	0.004	0.896	14000	62.7	0.220	79	3.3	5.2	2.6	0.174	21426	17031	20m.fbmy8028.cay9c
q100.1
q100.1: range queries with 100 insert/s per client
Performance metrics for all DBMS, not just the ones listed above. Some are normalized by throughput, others are not. Legend for results is here.
ips	qps	rps	rmbps	wps	wmbps	rpq	rkbpq	wpi	wkbpi	csps	cpups	cspq	cpupq	dbgb1	dbgb2	rss	maxop	p50	p99	tag
300	16452	5	0.0	80.5	2.6	0.000	0.001	0.269	8.727	63261	37.9	3.845	184	8.5	49.0	8.4	0.039	5450	5162	20m.my5651.cy8
300	12784	0	0.0	45.3	1.5	0.000	0.000	0.151	5.285	49159	38.5	3.845	241	8.5	49.0	8.7	0.045	4219	3836	20m.my5739.cy8
300	10017	0	0.0	243.2	6.3	0.000	0.000	0.812	21.470	39343	38.3	3.928	306	8.5	10.9	8.9	0.025	3292	2829	20m.my8031.cy8
300	7769	0	0.0	8.8	0.9	0.000	0.000	0.029	3.126	29898	38.2	3.849	393	2.9	4.7	5.7	0.032	2573	2318	20m.fbmy5635.cay9c
300	7630	0	0.0	7.5	1.1	0.000	0.000	0.025	3.695	29479	39.0	3.864	409	2.9	4.9	6.4	0.006	2525	2078	20m.fbmy8028.cay9c
q500.1
q500.1: range queries with 500 insert/s per client
Performance metrics for all DBMS, not just the ones listed above. Some are normalized by throughput, others are not. Legend for results is here.
ips	qps	rps	rmbps	wps	wmbps	rpq	rkbpq	wpi	wkbpi	csps	cpups	cspq	cpupq	dbgb1	dbgb2	rss	maxop	p50	p99	tag
1498	16762	24	0.1	5.2	0.9	0.001	0.006	0.004	0.592	64254	38.6	3.833	184	9.7	50.2	9.5	0.010	5562	5148	20m.my5651.cy8
1498	12798	0	0.0	12.9	1.1	0.000	0.000	0.009	0.718	49224	39.3	3.846	246	9.7	50.2	9.8	0.022	4267	3710	20m.my5739.cy8
1498	10202	0	0.0	554.4	14.6	0.000	0.000	0.370	10.004	40949	39.4	4.014	309	9.7	12.2	10.0	0.029	3342	2813	20m.my8031.cy8
1498	7796	0	0.0	12.9	2.0	0.000	0.000	0.009	1.380	30109	39.3	3.862	403	3.3	3.9	10.0	0.008	2557	2237	20m.fbmy5635.cay9c
1498	7545	0	0.0	10.8	2.0	0.000	0.000	0.007	1.341	29239	40.0	3.875	424	3.3	4.1	10.6	0.012	2493	2014	20m.fbmy8028.cay9c
q1000.1
q1000.1: range queries with 1000 insert/s per client
Performance metrics for all DBMS, not just the ones listed above. Some are normalized by throughput, others are not. Legend for results is here.
ips	qps	rps	rmbps	wps	wmbps	rpq	rkbpq	wpi	wkbpi	csps	cpups	cspq	cpupq	dbgb1	dbgb2	rss	maxop	p50	p99	tag
2995	16662	48	0.2	65.5	2.8	0.003	0.011	0.022	0.954	63957	39.4	3.839	189	10.5	51.0	10.3	0.041	5514	5133	20m.my5651.cy8
2995	13171	0	0.0	91.7	3.4	0.000	0.000	0.031	1.168	50661	40.3	3.847	245	10.5	51.0	10.6	0.046	4379	3820	20m.my5739.cy8
2995	10217	0	0.0	784.3	20.6	0.000	0.000	0.262	7.059	41372	40.5	4.049	317	10.5	13.0	10.8	0.024	3358	2893	20m.my8031.cy8
2995	7928	3	0.3	23.6	4.4	0.000	0.044	0.008	1.513	30552	41.0	3.854	414	4.1	6.0	10.5	0.022	2637	2333	20m.fbmy5635.cay9c
2995	7731	4	0.5	22.6	4.6	0.001	0.067	0.008	1.572	29833	42.2	3.859	437	4.0	6.2	10.9	0.016	2573	2126	20m.fbmy8028.cay9c
l.i0
- l.i0: load without secondary indexes
- Legend for results is here.
- Each entry lists the percentage of responses that fit in that bucket (slower than max time for previous bucket, faster than min time for next bucket).
Insert response time histogram
256us	1ms	4ms	16ms	64ms	256ms	1s	4s	16s	gt	max	tag
0.000	12.758	86.813	0.312	0.107	0.010	0.000	0.000	0.000	0.000	0.122	my5651.cy8
0.000	0.304	99.481	0.184	0.019	0.009	0.002	0.000	0.000	0.000	0.403	my5739.cy8
0.000	0.000	99.731	0.245	0.012	0.011	0.000	0.000	0.000	0.000	0.112	my8031.cy8
0.000	0.000	99.979	0.011	0.000	0.010	0.000	0.000	0.000	0.000	0.107	fbmy5635.cay9c
0.000	0.000	99.802	0.185	0.003	0.010	0.000	0.000	0.000	0.000	0.113	fbmy8028.cay9c
l.x
- l.x: create secondary indexes
- Legend for results is here.
- Each entry lists the percentage of responses that fit in that bucket (slower than max time for previous bucket, faster than min time for next bucket).
TODO - determine whether there is data for create index response time
l.i1
- l.i1: continue load after secondary indexes created
- Legend for results is here.
- Each entry lists the percentage of responses that fit in that bucket (slower than max time for previous bucket, faster than min time for next bucket).
Insert response time histogram
256us	1ms	4ms	16ms	64ms	256ms	1s	4s	16s	gt	max	tag
0.000	0.000	98.979	0.811	0.205	0.004	nonzero	0.000	0.000	0.000	0.286	my5651.cy8
0.000	0.000	99.372	0.484	0.134	0.010	0.000	0.000	0.000	0.000	0.204	my5739.cy8
0.000	0.000	98.920	0.786	0.271	0.021	0.001	0.000	0.000	0.000	0.415	my8031.cy8
0.000	0.000	99.960	0.034	0.006	0.001	0.000	0.000	0.000	0.000	0.116	fbmy5635.cay9c
0.000	0.000	99.813	0.164	0.017	0.006	0.000	0.000	0.000	0.000	0.174	fbmy8028.cay9c
q100.1
- q100.1: range queries with 100 insert/s per client
- Legend for results is here.
- Each entry lists the percentage of responses that fit in that bucket (slower than max time for previous bucket, faster than min time for next bucket).
Query response time histogram
256us	1ms	4ms	16ms	64ms	256ms	1s	4s	16s	gt	max	tag
95.701	4.295	0.003	0.001	nonzero	0.000	0.000	0.000	0.000	0.000	0.039	my5651.cy8
76.932	23.066	0.002	nonzero	nonzero	0.000	0.000	0.000	0.000	0.000	0.045	my5739.cy8
39.820	60.177	0.002	nonzero	nonzero	0.000	0.000	0.000	0.000	0.000	0.025	my8031.cy8
5.906	94.091	0.003	nonzero	nonzero	0.000	0.000	0.000	0.000	0.000	0.032	fbmy5635.cay9c
5.494	94.503	0.003	nonzero	0.000	0.000	0.000	0.000	0.000	0.000	0.006	fbmy8028.cay9c
Insert response time histogram
256us	1ms	4ms	16ms	64ms	256ms	1s	4s	16s	gt	max	tag
0.000	0.000	89.597	9.685	0.718	0.000	0.000	0.000	0.000	0.000	0.056	my5651.cy8
0.000	0.000	99.181	0.778	0.042	0.000	0.000	0.000	0.000	0.000	0.051	my5739.cy8
0.000	0.000	98.852	0.991	0.157	0.000	0.000	0.000	0.000	0.000	0.030	my8031.cy8
0.000	0.000	100.000	0.000	0.000	0.000	0.000	0.000	0.000	0.000	0.004	fbmy5635.cay9c
0.000	0.000	99.894	0.079	0.028	0.000	0.000	0.000	0.000	0.000	0.039	fbmy8028.cay9c
q500.1
- q500.1: range queries with 500 insert/s per client
- Legend for results is here.
- Each entry lists the percentage of responses that fit in that bucket (slower than max time for previous bucket, faster than min time for next bucket).
Query response time histogram
256us	1ms	4ms	16ms	64ms	256ms	1s	4s	16s	gt	max	tag
95.908	4.085	0.007	nonzero	0.000	0.000	0.000	0.000	0.000	0.000	0.010	my5651.cy8
76.946	23.048	0.006	nonzero	nonzero	0.000	0.000	0.000	0.000	0.000	0.022	my5739.cy8
43.046	56.945	0.008	0.001	nonzero	0.000	0.000	0.000	0.000	0.000	0.029	my8031.cy8
7.962	92.024	0.014	0.001	0.000	0.000	0.000	0.000	0.000	0.000	0.008	fbmy5635.cay9c
3.688	96.294	0.017	0.001	0.000	0.000	0.000	0.000	0.000	0.000	0.012	fbmy8028.cay9c
Insert response time histogram
256us	1ms	4ms	16ms	64ms	256ms	1s	4s	16s	gt	max	tag
0.000	0.000	95.266	4.734	0.000	0.000	0.000	0.000	0.000	0.000	0.015	my5651.cy8
0.000	0.000	99.523	0.475	0.002	0.000	0.000	0.000	0.000	0.000	0.024	my5739.cy8
0.000	0.000	98.941	1.011	0.046	0.002	0.000	0.000	0.000	0.000	0.103	my8031.cy8
0.000	0.000	99.739	0.261	0.000	0.000	0.000	0.000	0.000	0.000	0.014	fbmy5635.cay9c
0.000	0.000	99.313	0.686	0.001	0.000	0.000	0.000	0.000	0.000	0.016	fbmy8028.cay9c
q1000.1
- q1000.1: range queries with 1000 insert/s per client
- Legend for results is here.
- Each entry lists the percentage of responses that fit in that bucket (slower than max time for previous bucket, faster than min time for next bucket).
Query response time histogram
256us	1ms	4ms	16ms	64ms	256ms	1s	4s	16s	gt	max	tag
95.395	4.593	0.011	nonzero	nonzero	0.000	0.000	0.000	0.000	0.000	0.041	my5651.cy8
79.732	20.245	0.023	0.001	nonzero	0.000	0.000	0.000	0.000	0.000	0.046	my5739.cy8
43.353	56.618	0.028	0.001	nonzero	0.000	0.000	0.000	0.000	0.000	0.024	my8031.cy8
9.256	90.716	0.028	0.001	nonzero	0.000	0.000	0.000	0.000	0.000	0.022	fbmy5635.cay9c
4.133	95.824	0.042	0.001	nonzero	0.000	0.000	0.000	0.000	0.000	0.016	fbmy8028.cay9c
Insert response time histogram
256us	1ms	4ms	16ms	64ms	256ms	1s	4s	16s	gt	max	tag
0.000	0.000	94.723	5.233	0.044	0.000	0.000	0.000	0.000	0.000	0.050	my5651.cy8
0.000	0.000	99.174	0.821	0.005	nonzero	0.000	0.000	0.000	0.000	0.076	my5739.cy8
0.000	0.000	97.700	2.253	0.028	0.018	0.000	0.000	0.000	0.000	0.110	my8031.cy8
0.000	0.000	97.469	2.527	0.004	0.000	0.000	0.000	0.000	0.000	0.026	fbmy5635.cay9c
0.000	0.000	94.917	5.077	0.006	0.000	0.000	0.000	0.000	0.000	0.038	fbmy8028.cay9c