Introduction
This is a report for the insert benchmark with 20M docs and 2 client(s). It is generated by scripts (bash, awk, sed) and Tufte might not be impressed. An overview of the insert benchmark is here and a short update is here. Below, by DBMS, I mean DBMS+version.config. An example is my8020.c10b40 where my means MySQL, 8020 is version 8.0.20 and c10b40 is the name for the configuration file.
The test server has 8 AMD cores, 16G RAM and an NVMe SSD. It is described here. The benchmark was run with 2 clients and there were 1 or 2 connections per client (1 for queries, 1 for inserts). The benchmark loads 20M rows without secondary indexes, creates secondary indexes, loads another 20M rows then does 3 read+write tests for one hour each that do queries as fast as possible with 100, 500 and then 1000 writes/second/client concurrent with the queries. The database is cached by the storage engine and the only IO is for writes. Clients and the DBMS share one server. The per-database configs are in the per-database subdirectories here.
The tested DBMS are:
- my5651.cy8 - MySQL 5.6.51, InnoDB and the cy8 config
- my5739.cy8 - MySQL 5.7.39, InnoDB and the cy8 config
- my8031.cy8 - MySQL 8.0.31, InnoDB and the cy8 config
- fbmy5635.cay9c - FB MySQL 5.6.35, MyRocks and the cay9c config
- fbmy8028.cay9c - FB MySQL 8.0.28, MyRocks and the cay9c config
Contents
- Summary
- l.i0: load without secondary indexes
- l.x: create secondary indexes
- l.i1: continue load after secondary indexes created
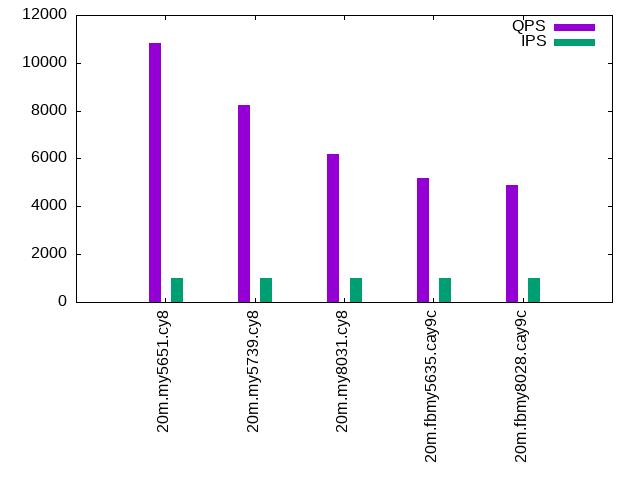
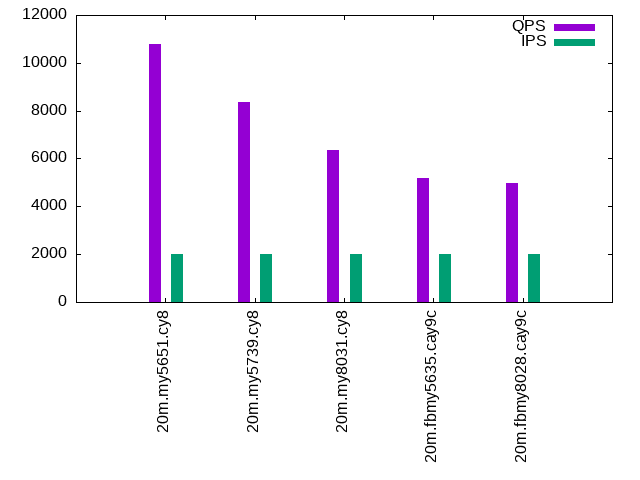
- q100.1: range queries with 100 insert/s per client
- q500.1: range queries with 500 insert/s per client
- q1000.1: range queries with 1000 insert/s per client
Summary
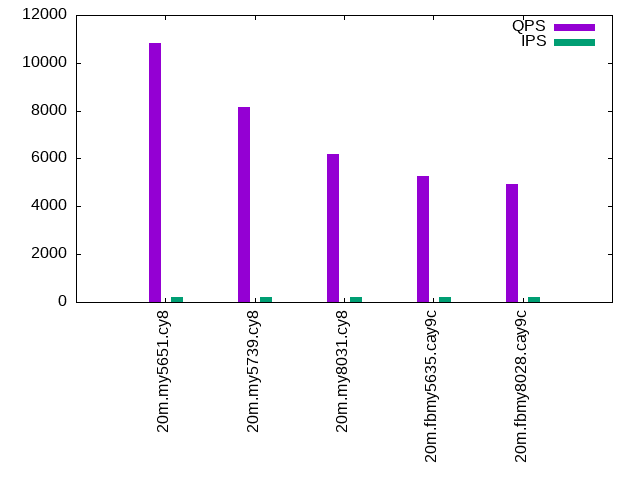
The numbers are inserts/s for l.i0 and l.i1, indexed docs (or rows) /s for l.x and queries/s for q*.2. The values are the average rate over the entire test for inserts (IPS) and queries (QPS). The range of values for IPS and QPS is split into 3 parts: bottom 25%, middle 50%, top 25%. Values in the bottom 25% have a red background, values in the top 25% have a green background and values in the middle have no color. A gray background is used for values that can be ignored because the DBMS did not sustain the target insert rate. Red backgrounds are not used when the minimum value is within 80% of the max value.
| dbms | l.i0 | l.x | l.i1 | q100.1 | q500.1 | q1000.1 |
|---|---|---|---|---|---|---|
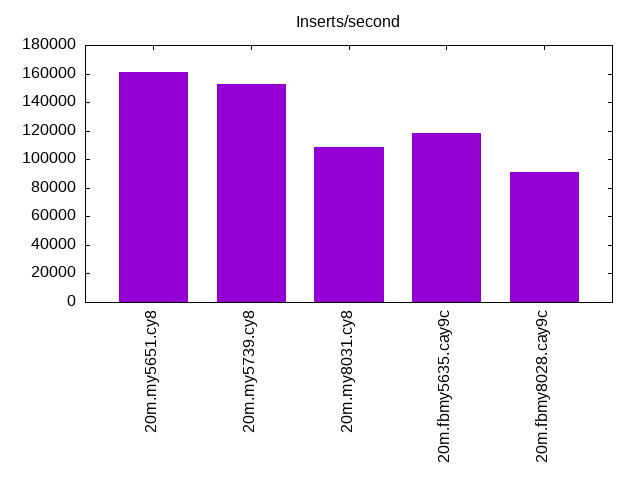
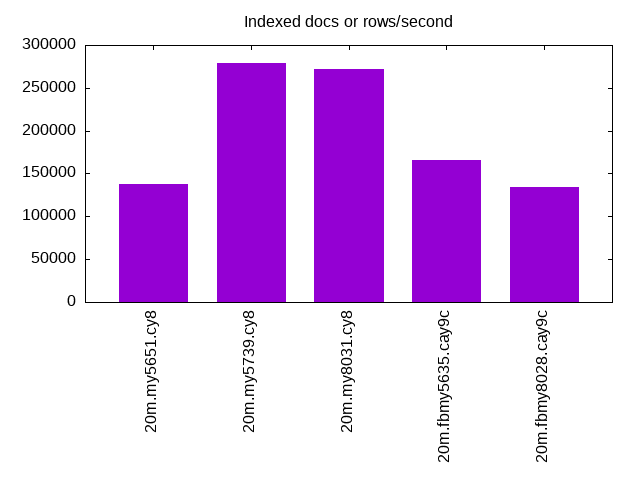
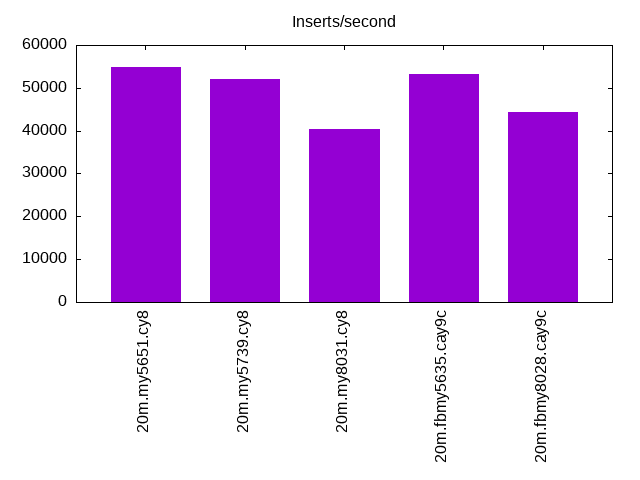
| 20m.my5651.cy8 | 161290 | 137671 | 54945 | 10850 | 10817 | 10779 |
| 20m.my5739.cy8 | 152672 | 279167 | 51948 | 8152 | 8227 | 8356 |
| 20m.my8031.cy8 | 108696 | 271622 | 40404 | 6193 | 6197 | 6356 |
| 20m.fbmy5635.cay9c | 118343 | 166116 | 53333 | 5278 | 5185 | 5199 |
| 20m.fbmy8028.cay9c | 90909 | 134000 | 44346 | 4915 | 4907 | 4989 |
This lists the average rate of inserts/s for the tests that do inserts concurrent with queries. For such tests the query rate is listed in the table above. The read+write tests are setup so that the insert rate should match the target rate every second. Cells that are not at least 95% of the target have a red background to indicate a failure to satisfy the target.
| dbms | q100.1 | q500.1 | q1000.1 |
|---|---|---|---|
| my5651.cy8 | 200 | 999 | 1997 |
| my5739.cy8 | 200 | 999 | 1997 |
| my8031.cy8 | 200 | 999 | 1997 |
| fbmy5635.cay9c | 200 | 999 | 1997 |
| fbmy8028.cay9c | 200 | 999 | 1997 |
| target | 200 | 1000 | 2000 |
l.i0
l.i0: load without secondary indexes. Graphs for performance per 1-second interval are here.
Average throughput:
Insert response time histogram: each cell has the percentage of responses that take <= the time in the header and max is the max response time in seconds. For the max column values in the top 25% of the range have a red background and in the bottom 25% of the range have a green background. The red background is not used when the min value is within 80% of the max value.
| dbms | 256us | 1ms | 4ms | 16ms | 64ms | 256ms | 1s | 4s | 16s | gt | max |
|---|---|---|---|---|---|---|---|---|---|---|---|
| my5651.cy8 | 32.434 | 67.203 | 0.263 | 0.094 | 0.006 | 0.116 | |||||
| my5739.cy8 | 0.508 | 99.301 | 0.158 | 0.026 | 0.006 | 0.002 | 0.377 | ||||
| my8031.cy8 | 99.761 | 0.229 | 0.003 | 0.007 | 0.109 | ||||||
| fbmy5635.cay9c | 99.987 | 0.007 | 0.006 | 0.107 | |||||||
| fbmy8028.cay9c | 99.889 | 0.101 | 0.004 | 0.005 | 0.002 | 0.429 |
Performance metrics for the DBMS listed above. Some are normalized by throughput, others are not. Legend for results is here.
ips	qps	rps	rmbps	wps	wmbps	rpq	rkbpq	wpi	wkbpi	csps	cpups	cspq	cpupq	dbgb1	dbgb2	rss	maxop	p50	p99	tag
161290	0	1430	5.6	157.3	37.2	0.009	0.035	0.001	0.236	18082	38.0	0.112	19	1.3	41.8	2.1	0.116	87405	59135	20m.my5651.cy8
152672	0	0	0.0	261.8	37.9	0.000	0.000	0.002	0.255	14887	39.2	0.098	21	1.3	41.9	2.3	0.377	83643	49147	20m.my5739.cy8
108696	0	0	0.0	589.8	38.4	0.000	0.000	0.005	0.362	12737	40.9	0.117	30	1.3	3.8	2.5	0.109	57137	49753	20m.my8031.cy8
118343	0	0	0.0	146.3	33.0	0.000	0.000	0.001	0.286	12416	42.9	0.105	29	0.7	1.7	0.4	0.107	58535	49147	20m.fbmy5635.cay9c
90909	0	0	0.0	110.3	23.5	0.000	0.000	0.001	0.265	9695	40.1	0.107	35	0.7	1.9	0.7	0.429	45050	25372	20m.fbmy8028.cay9c
l.x
l.x: create secondary indexes.
Average throughput:
Performance metrics for the DBMS listed above. Some are normalized by throughput, others are not. Legend for results is here.
ips	qps	rps	rmbps	wps	wmbps	rpq	rkbpq	wpi	wkbpi	csps	cpups	cspq	cpupq	dbgb1	dbgb2	rss	maxop	p50	p99	tag
137671	0	525	2.0	5835.0	208.7	0.004	0.015	0.042	1.553	18864	21.1	0.137	12	2.7	43.2	3.5	0.006	NA	NA	20m.my5651.cy8
279167	0	0	0.0	3681.1	232.1	0.000	0.000	0.013	0.851	17656	23.3	0.063	7	3.0	43.5	3.8	0.009	NA	NA	20m.my5739.cy8
271622	0	1487	98.9	4508.6	263.4	0.005	0.373	0.017	0.993	16456	71.8	0.061	21	3.0	5.4	3.9	0.008	NA	NA	20m.my8031.cy8
166116	0	0	0.0	117.3	26.3	0.000	0.000	0.001	0.162	496	23.8	0.003	11	1.4	2.5	1.4	0.003	NA	NA	20m.fbmy5635.cay9c
134000	0	0	0.0	93.7	21.2	0.000	0.000	0.001	0.162	627	24.3	0.005	15	1.4	2.7	2.0	0.005	NA	NA	20m.fbmy8028.cay9c
l.i1
l.i1: continue load after secondary indexes created. Graphs for performance per 1-second interval are here.
Average throughput:
Insert response time histogram: each cell has the percentage of responses that take <= the time in the header and max is the max response time in seconds. For the max column values in the top 25% of the range have a red background and in the bottom 25% of the range have a green background. The red background is not used when the min value is within 80% of the max value.
| dbms | 256us | 1ms | 4ms | 16ms | 64ms | 256ms | 1s | 4s | 16s | gt | max |
|---|---|---|---|---|---|---|---|---|---|---|---|
| my5651.cy8 | 99.082 | 0.877 | 0.040 | 0.001 | nonzero | 0.273 | |||||
| my5739.cy8 | 99.392 | 0.495 | 0.110 | 0.004 | 0.160 | ||||||
| my8031.cy8 | 99.155 | 0.604 | 0.231 | 0.009 | 0.001 | 0.312 | |||||
| fbmy5635.cay9c | 99.989 | 0.006 | 0.006 | 0.048 | |||||||
| fbmy8028.cay9c | 99.920 | 0.067 | 0.009 | 0.003 | 0.163 |
Performance metrics for the DBMS listed above. Some are normalized by throughput, others are not. Legend for results is here.
ips	qps	rps	rmbps	wps	wmbps	rpq	rkbpq	wpi	wkbpi	csps	cpups	cspq	cpupq	dbgb1	dbgb2	rss	maxop	p50	p99	tag
54945	0	955	3.7	183.3	34.7	0.017	0.070	0.003	0.646	13497	33.0	0.246	48	8.0	48.5	8.0	0.273	28632	5942	20m.my5651.cy8
51948	0	0	0.0	797.7	50.4	0.000	0.000	0.015	0.994	12470	34.1	0.240	53	8.0	48.5	8.3	0.160	26991	3047	20m.my5739.cy8
40404	0	186	2.9	2797.1	94.8	0.005	0.074	0.069	2.402	17321	33.2	0.429	66	8.0	10.5	8.5	0.312	21127	1249	20m.my8031.cy8
53333	0	16	2.0	219.2	50.2	0.000	0.038	0.004	0.964	11960	49.4	0.224	74	3.6	5.4	1.8	0.048	26682	23823	20m.fbmy5635.cay9c
44346	0	13	1.6	189.9	43.3	0.000	0.038	0.004	1.001	10310	46.6	0.232	84	3.2	5.1	2.7	0.163	22186	19229	20m.fbmy8028.cay9c
q100.1
q100.1: range queries with 100 insert/s per client. Graphs for performance per 1-second interval are here.
Average throughput:
Query response time histogram: each cell has the percentage of responses that take <= the time in the header and max is the max response time in seconds. For max values in the top 25% of the range have a red background and in the bottom 25% of the range have a green background. The red background is not used when the min value is within 80% of the max value.
| dbms | 256us | 1ms | 4ms | 16ms | 64ms | 256ms | 1s | 4s | 16s | gt | max |
|---|---|---|---|---|---|---|---|---|---|---|---|
| my5651.cy8 | 96.428 | 3.570 | 0.002 | 0.001 | nonzero | 0.040 | |||||
| my5739.cy8 | 72.590 | 27.410 | 0.001 | nonzero | nonzero | 0.039 | |||||
| my8031.cy8 | 25.245 | 74.754 | 0.001 | nonzero | nonzero | 0.025 | |||||
| fbmy5635.cay9c | 2.346 | 97.653 | 0.001 | nonzero | nonzero | 0.044 | |||||
| fbmy8028.cay9c | 3.036 | 96.963 | 0.001 | nonzero | 0.006 |
Insert response time histogram: each cell has the percentage of responses that take <= the time in the header and max is the max response time in seconds. For max values in the top 25% of the range have a red background and in the bottom 25% of the range have a green background. The red background is not used when the min value is within 80% of the max value.
| dbms | 256us | 1ms | 4ms | 16ms | 64ms | 256ms | 1s | 4s | 16s | gt | max |
|---|---|---|---|---|---|---|---|---|---|---|---|
| my5651.cy8 | 83.521 | 15.736 | 0.743 | 0.051 | |||||||
| my5739.cy8 | 99.062 | 0.889 | 0.049 | 0.053 | |||||||
| my8031.cy8 | 98.611 | 1.243 | 0.146 | 0.036 | |||||||
| fbmy5635.cay9c | 100.000 | 0.004 | |||||||||
| fbmy8028.cay9c | 99.903 | 0.097 | 0.008 |
Performance metrics for the DBMS listed above. Some are normalized by throughput, others are not. Legend for results is here.
ips	qps	rps	rmbps	wps	wmbps	rpq	rkbpq	wpi	wkbpi	csps	cpups	cspq	cpupq	dbgb1	dbgb2	rss	maxop	p50	p99	tag
200	10850	4	0.0	80.4	2.5	0.000	0.001	0.402	12.676	41896	25.5	3.861	188	8.5	49.0	8.5	0.040	5402	5274	20m.my5651.cy8
200	8152	0	0.0	8.3	0.4	0.000	0.000	0.041	1.983	31395	26.0	3.851	255	8.5	49.1	8.8	0.039	4012	3820	20m.my5739.cy8
200	6193	0	0.0	209.0	5.3	0.000	0.000	1.047	27.336	24739	26.1	3.995	337	8.5	11.0	8.9	0.025	3069	2909	20m.my8031.cy8
200	5278	0	0.0	7.6	0.6	0.000	0.000	0.038	3.185	20379	25.8	3.861	391	2.8	4.7	5.3	0.044	2607	2413	20m.fbmy5635.cay9c
200	4915	0	0.0	6.2	0.8	0.000	0.000	0.031	3.913	19138	26.5	3.894	431	2.8	4.9	6.0	0.006	2445	2078	20m.fbmy8028.cay9c
q500.1
q500.1: range queries with 500 insert/s per client. Graphs for performance per 1-second interval are here.
Average throughput:
Query response time histogram: each cell has the percentage of responses that take <= the time in the header and max is the max response time in seconds. For max values in the top 25% of the range have a red background and in the bottom 25% of the range have a green background. The red background is not used when the min value is within 80% of the max value.
| dbms | 256us | 1ms | 4ms | 16ms | 64ms | 256ms | 1s | 4s | 16s | gt | max |
|---|---|---|---|---|---|---|---|---|---|---|---|
| my5651.cy8 | 95.920 | 4.075 | 0.005 | nonzero | 0.011 | ||||||
| my5739.cy8 | 73.491 | 26.505 | 0.004 | nonzero | 0.012 | ||||||
| my8031.cy8 | 25.048 | 74.946 | 0.006 | 0.001 | nonzero | 0.028 | |||||
| fbmy5635.cay9c | 4.283 | 95.711 | 0.005 | nonzero | 0.006 | ||||||
| fbmy8028.cay9c | 2.425 | 97.567 | 0.007 | nonzero | 0.005 |
Insert response time histogram: each cell has the percentage of responses that take <= the time in the header and max is the max response time in seconds. For max values in the top 25% of the range have a red background and in the bottom 25% of the range have a green background. The red background is not used when the min value is within 80% of the max value.
| dbms | 256us | 1ms | 4ms | 16ms | 64ms | 256ms | 1s | 4s | 16s | gt | max |
|---|---|---|---|---|---|---|---|---|---|---|---|
| my5651.cy8 | 95.865 | 4.135 | 0.014 | ||||||||
| my5739.cy8 | 99.651 | 0.346 | 0.003 | 0.018 | |||||||
| my8031.cy8 | 99.526 | 0.404 | 0.069 | 0.032 | |||||||
| fbmy5635.cay9c | 99.963 | 0.037 | 0.010 | ||||||||
| fbmy8028.cay9c | 99.790 | 0.206 | 0.004 | 0.019 |
Performance metrics for the DBMS listed above. Some are normalized by throughput, others are not. Legend for results is here.
ips	qps	rps	rmbps	wps	wmbps	rpq	rkbpq	wpi	wkbpi	csps	cpups	cspq	cpupq	dbgb1	dbgb2	rss	maxop	p50	p99	tag
999	10817	17	0.1	4.5	0.6	0.002	0.006	0.005	0.627	41698	26.2	3.855	194	9.5	50.0	9.3	0.011	5370	5226	20m.my5651.cy8
999	8227	0	0.0	37.7	1.4	0.000	0.000	0.038	1.443	31910	26.8	3.879	261	9.5	50.0	9.6	0.012	4075	3807	20m.my5739.cy8
999	6197	0	0.0	424.0	11.1	0.000	0.000	0.425	11.381	25513	26.7	4.117	345	9.4	11.9	9.7	0.028	3085	2877	20m.my8031.cy8
999	5185	0	0.0	9.2	1.0	0.000	0.000	0.009	1.072	20151	26.3	3.887	406	3.2	3.5	6.5	0.006	2573	2319	20m.fbmy5635.cay9c
999	4907	0	0.0	7.3	1.1	0.000	0.000	0.007	1.093	19231	27.1	3.919	442	3.2	3.7	7.8	0.005	2445	2062	20m.fbmy8028.cay9c
q1000.1
q1000.1: range queries with 1000 insert/s per client. Graphs for performance per 1-second interval are here.
Average throughput:
Query response time histogram: each cell has the percentage of responses that take <= the time in the header and max is the max response time in seconds. For max values in the top 25% of the range have a red background and in the bottom 25% of the range have a green background. The red background is not used when the min value is within 80% of the max value.
| dbms | 256us | 1ms | 4ms | 16ms | 64ms | 256ms | 1s | 4s | 16s | gt | max |
|---|---|---|---|---|---|---|---|---|---|---|---|
| my5651.cy8 | 95.456 | 4.536 | 0.008 | nonzero | 0.014 | ||||||
| my5739.cy8 | 74.619 | 25.373 | 0.008 | nonzero | nonzero | 0.034 | |||||
| my8031.cy8 | 29.902 | 70.083 | 0.014 | nonzero | nonzero | 0.028 | |||||
| fbmy5635.cay9c | 5.595 | 94.390 | 0.015 | nonzero | nonzero | 0.018 | |||||
| fbmy8028.cay9c | 2.920 | 97.062 | 0.018 | nonzero | 0.008 |
Insert response time histogram: each cell has the percentage of responses that take <= the time in the header and max is the max response time in seconds. For max values in the top 25% of the range have a red background and in the bottom 25% of the range have a green background. The red background is not used when the min value is within 80% of the max value.
| dbms | 256us | 1ms | 4ms | 16ms | 64ms | 256ms | 1s | 4s | 16s | gt | max |
|---|---|---|---|---|---|---|---|---|---|---|---|
| my5651.cy8 | 97.892 | 2.100 | 0.008 | 0.052 | |||||||
| my5739.cy8 | 99.856 | 0.139 | 0.006 | 0.055 | |||||||
| my8031.cy8 | 99.575 | 0.387 | 0.038 | 0.037 | |||||||
| fbmy5635.cay9c | 99.911 | 0.089 | 0.013 | ||||||||
| fbmy8028.cay9c | 99.724 | 0.274 | 0.002 | 0.027 |
Performance metrics for the DBMS listed above. Some are normalized by throughput, others are not. Legend for results is here.
ips	qps	rps	rmbps	wps	wmbps	rpq	rkbpq	wpi	wkbpi	csps	cpups	cspq	cpupq	dbgb1	dbgb2	rss	maxop	p50	p99	tag
1997	10779	34	0.1	25.7	1.4	0.003	0.013	0.013	0.709	41819	26.6	3.880	197	10.1	50.6	9.9	0.014	5386	5194	20m.my5651.cy8
1997	8356	0	0.0	71.1	2.5	0.000	0.000	0.036	1.272	32681	27.2	3.911	260	10.1	50.6	10.2	0.034	4123	3788	20m.my5739.cy8
1997	6356	0	0.0	612.9	16.0	0.000	0.000	0.307	8.211	26838	27.5	4.222	346	10.1	12.5	10.4	0.028	3148	2893	20m.my8031.cy8
1997	5199	0	0.1	17.2	2.9	0.000	0.011	0.009	1.471	20409	27.9	3.926	429	3.7	4.9	10.6	0.018	2573	2318	20m.fbmy5635.cay9c
1997	4989	0	0.0	15.0	2.8	0.000	0.007	0.007	1.419	19740	28.6	3.957	459	3.8	5.2	10.9	0.008	2493	2078	20m.fbmy8028.cay9c
l.i0
l.i0: load without secondary indexes
Performance metrics for all DBMS, not just the ones listed above. Some are normalized by throughput, others are not. Legend for results is here.
ips	qps	rps	rmbps	wps	wmbps	rpq	rkbpq	wpi	wkbpi	csps	cpups	cspq	cpupq	dbgb1	dbgb2	rss	maxop	p50	p99	tag
161290	0	1430	5.6	157.3	37.2	0.009	0.035	0.001	0.236	18082	38.0	0.112	19	1.3	41.8	2.1	0.116	87405	59135	20m.my5651.cy8
152672	0	0	0.0	261.8	37.9	0.000	0.000	0.002	0.255	14887	39.2	0.098	21	1.3	41.9	2.3	0.377	83643	49147	20m.my5739.cy8
108696	0	0	0.0	589.8	38.4	0.000	0.000	0.005	0.362	12737	40.9	0.117	30	1.3	3.8	2.5	0.109	57137	49753	20m.my8031.cy8
118343	0	0	0.0	146.3	33.0	0.000	0.000	0.001	0.286	12416	42.9	0.105	29	0.7	1.7	0.4	0.107	58535	49147	20m.fbmy5635.cay9c
90909	0	0	0.0	110.3	23.5	0.000	0.000	0.001	0.265	9695	40.1	0.107	35	0.7	1.9	0.7	0.429	45050	25372	20m.fbmy8028.cay9c
l.x
l.x: create secondary indexes
Performance metrics for all DBMS, not just the ones listed above. Some are normalized by throughput, others are not. Legend for results is here.
ips	qps	rps	rmbps	wps	wmbps	rpq	rkbpq	wpi	wkbpi	csps	cpups	cspq	cpupq	dbgb1	dbgb2	rss	maxop	p50	p99	tag
137671	0	525	2.0	5835.0	208.7	0.004	0.015	0.042	1.553	18864	21.1	0.137	12	2.7	43.2	3.5	0.006	NA	NA	20m.my5651.cy8
279167	0	0	0.0	3681.1	232.1	0.000	0.000	0.013	0.851	17656	23.3	0.063	7	3.0	43.5	3.8	0.009	NA	NA	20m.my5739.cy8
271622	0	1487	98.9	4508.6	263.4	0.005	0.373	0.017	0.993	16456	71.8	0.061	21	3.0	5.4	3.9	0.008	NA	NA	20m.my8031.cy8
166116	0	0	0.0	117.3	26.3	0.000	0.000	0.001	0.162	496	23.8	0.003	11	1.4	2.5	1.4	0.003	NA	NA	20m.fbmy5635.cay9c
134000	0	0	0.0	93.7	21.2	0.000	0.000	0.001	0.162	627	24.3	0.005	15	1.4	2.7	2.0	0.005	NA	NA	20m.fbmy8028.cay9c
l.i1
l.i1: continue load after secondary indexes created
Performance metrics for all DBMS, not just the ones listed above. Some are normalized by throughput, others are not. Legend for results is here.
ips	qps	rps	rmbps	wps	wmbps	rpq	rkbpq	wpi	wkbpi	csps	cpups	cspq	cpupq	dbgb1	dbgb2	rss	maxop	p50	p99	tag
54945	0	955	3.7	183.3	34.7	0.017	0.070	0.003	0.646	13497	33.0	0.246	48	8.0	48.5	8.0	0.273	28632	5942	20m.my5651.cy8
51948	0	0	0.0	797.7	50.4	0.000	0.000	0.015	0.994	12470	34.1	0.240	53	8.0	48.5	8.3	0.160	26991	3047	20m.my5739.cy8
40404	0	186	2.9	2797.1	94.8	0.005	0.074	0.069	2.402	17321	33.2	0.429	66	8.0	10.5	8.5	0.312	21127	1249	20m.my8031.cy8
53333	0	16	2.0	219.2	50.2	0.000	0.038	0.004	0.964	11960	49.4	0.224	74	3.6	5.4	1.8	0.048	26682	23823	20m.fbmy5635.cay9c
44346	0	13	1.6	189.9	43.3	0.000	0.038	0.004	1.001	10310	46.6	0.232	84	3.2	5.1	2.7	0.163	22186	19229	20m.fbmy8028.cay9c
q100.1
q100.1: range queries with 100 insert/s per client
Performance metrics for all DBMS, not just the ones listed above. Some are normalized by throughput, others are not. Legend for results is here.
ips	qps	rps	rmbps	wps	wmbps	rpq	rkbpq	wpi	wkbpi	csps	cpups	cspq	cpupq	dbgb1	dbgb2	rss	maxop	p50	p99	tag
200	10850	4	0.0	80.4	2.5	0.000	0.001	0.402	12.676	41896	25.5	3.861	188	8.5	49.0	8.5	0.040	5402	5274	20m.my5651.cy8
200	8152	0	0.0	8.3	0.4	0.000	0.000	0.041	1.983	31395	26.0	3.851	255	8.5	49.1	8.8	0.039	4012	3820	20m.my5739.cy8
200	6193	0	0.0	209.0	5.3	0.000	0.000	1.047	27.336	24739	26.1	3.995	337	8.5	11.0	8.9	0.025	3069	2909	20m.my8031.cy8
200	5278	0	0.0	7.6	0.6	0.000	0.000	0.038	3.185	20379	25.8	3.861	391	2.8	4.7	5.3	0.044	2607	2413	20m.fbmy5635.cay9c
200	4915	0	0.0	6.2	0.8	0.000	0.000	0.031	3.913	19138	26.5	3.894	431	2.8	4.9	6.0	0.006	2445	2078	20m.fbmy8028.cay9c
q500.1
q500.1: range queries with 500 insert/s per client
Performance metrics for all DBMS, not just the ones listed above. Some are normalized by throughput, others are not. Legend for results is here.
ips	qps	rps	rmbps	wps	wmbps	rpq	rkbpq	wpi	wkbpi	csps	cpups	cspq	cpupq	dbgb1	dbgb2	rss	maxop	p50	p99	tag
999	10817	17	0.1	4.5	0.6	0.002	0.006	0.005	0.627	41698	26.2	3.855	194	9.5	50.0	9.3	0.011	5370	5226	20m.my5651.cy8
999	8227	0	0.0	37.7	1.4	0.000	0.000	0.038	1.443	31910	26.8	3.879	261	9.5	50.0	9.6	0.012	4075	3807	20m.my5739.cy8
999	6197	0	0.0	424.0	11.1	0.000	0.000	0.425	11.381	25513	26.7	4.117	345	9.4	11.9	9.7	0.028	3085	2877	20m.my8031.cy8
999	5185	0	0.0	9.2	1.0	0.000	0.000	0.009	1.072	20151	26.3	3.887	406	3.2	3.5	6.5	0.006	2573	2319	20m.fbmy5635.cay9c
999	4907	0	0.0	7.3	1.1	0.000	0.000	0.007	1.093	19231	27.1	3.919	442	3.2	3.7	7.8	0.005	2445	2062	20m.fbmy8028.cay9c
q1000.1
q1000.1: range queries with 1000 insert/s per client
Performance metrics for all DBMS, not just the ones listed above. Some are normalized by throughput, others are not. Legend for results is here.
ips	qps	rps	rmbps	wps	wmbps	rpq	rkbpq	wpi	wkbpi	csps	cpups	cspq	cpupq	dbgb1	dbgb2	rss	maxop	p50	p99	tag
1997	10779	34	0.1	25.7	1.4	0.003	0.013	0.013	0.709	41819	26.6	3.880	197	10.1	50.6	9.9	0.014	5386	5194	20m.my5651.cy8
1997	8356	0	0.0	71.1	2.5	0.000	0.000	0.036	1.272	32681	27.2	3.911	260	10.1	50.6	10.2	0.034	4123	3788	20m.my5739.cy8
1997	6356	0	0.0	612.9	16.0	0.000	0.000	0.307	8.211	26838	27.5	4.222	346	10.1	12.5	10.4	0.028	3148	2893	20m.my8031.cy8
1997	5199	0	0.1	17.2	2.9	0.000	0.011	0.009	1.471	20409	27.9	3.926	429	3.7	4.9	10.6	0.018	2573	2318	20m.fbmy5635.cay9c
1997	4989	0	0.0	15.0	2.8	0.000	0.007	0.007	1.419	19740	28.6	3.957	459	3.8	5.2	10.9	0.008	2493	2078	20m.fbmy8028.cay9c
l.i0
- l.i0: load without secondary indexes
- Legend for results is here.
- Each entry lists the percentage of responses that fit in that bucket (slower than max time for previous bucket, faster than min time for next bucket).
Insert response time histogram
256us	1ms	4ms	16ms	64ms	256ms	1s	4s	16s	gt	max	tag
0.000	32.434	67.203	0.263	0.094	0.006	0.000	0.000	0.000	0.000	0.116	my5651.cy8
0.000	0.508	99.301	0.158	0.026	0.006	0.002	0.000	0.000	0.000	0.377	my5739.cy8
0.000	0.000	99.761	0.229	0.003	0.007	0.000	0.000	0.000	0.000	0.109	my8031.cy8
0.000	0.000	99.987	0.007	0.000	0.006	0.000	0.000	0.000	0.000	0.107	fbmy5635.cay9c
0.000	0.000	99.889	0.101	0.004	0.005	0.002	0.000	0.000	0.000	0.429	fbmy8028.cay9c
l.x
- l.x: create secondary indexes
- Legend for results is here.
- Each entry lists the percentage of responses that fit in that bucket (slower than max time for previous bucket, faster than min time for next bucket).
TODO - determine whether there is data for create index response time
l.i1
- l.i1: continue load after secondary indexes created
- Legend for results is here.
- Each entry lists the percentage of responses that fit in that bucket (slower than max time for previous bucket, faster than min time for next bucket).
Insert response time histogram
256us	1ms	4ms	16ms	64ms	256ms	1s	4s	16s	gt	max	tag
0.000	0.000	99.082	0.877	0.040	0.001	nonzero	0.000	0.000	0.000	0.273	my5651.cy8
0.000	0.000	99.392	0.495	0.110	0.004	0.000	0.000	0.000	0.000	0.160	my5739.cy8
0.000	0.000	99.155	0.604	0.231	0.009	0.001	0.000	0.000	0.000	0.312	my8031.cy8
0.000	0.000	99.989	0.006	0.006	0.000	0.000	0.000	0.000	0.000	0.048	fbmy5635.cay9c
0.000	0.000	99.920	0.067	0.009	0.003	0.000	0.000	0.000	0.000	0.163	fbmy8028.cay9c
q100.1
- q100.1: range queries with 100 insert/s per client
- Legend for results is here.
- Each entry lists the percentage of responses that fit in that bucket (slower than max time for previous bucket, faster than min time for next bucket).
Query response time histogram
256us	1ms	4ms	16ms	64ms	256ms	1s	4s	16s	gt	max	tag
96.428	3.570	0.002	0.001	nonzero	0.000	0.000	0.000	0.000	0.000	0.040	my5651.cy8
72.590	27.410	0.001	nonzero	nonzero	0.000	0.000	0.000	0.000	0.000	0.039	my5739.cy8
25.245	74.754	0.001	nonzero	nonzero	0.000	0.000	0.000	0.000	0.000	0.025	my8031.cy8
2.346	97.653	0.001	nonzero	nonzero	0.000	0.000	0.000	0.000	0.000	0.044	fbmy5635.cay9c
3.036	96.963	0.001	nonzero	0.000	0.000	0.000	0.000	0.000	0.000	0.006	fbmy8028.cay9c
Insert response time histogram
256us	1ms	4ms	16ms	64ms	256ms	1s	4s	16s	gt	max	tag
0.000	0.000	83.521	15.736	0.743	0.000	0.000	0.000	0.000	0.000	0.051	my5651.cy8
0.000	0.000	99.062	0.889	0.049	0.000	0.000	0.000	0.000	0.000	0.053	my5739.cy8
0.000	0.000	98.611	1.243	0.146	0.000	0.000	0.000	0.000	0.000	0.036	my8031.cy8
0.000	0.000	100.000	0.000	0.000	0.000	0.000	0.000	0.000	0.000	0.004	fbmy5635.cay9c
0.000	0.000	99.903	0.097	0.000	0.000	0.000	0.000	0.000	0.000	0.008	fbmy8028.cay9c
q500.1
- q500.1: range queries with 500 insert/s per client
- Legend for results is here.
- Each entry lists the percentage of responses that fit in that bucket (slower than max time for previous bucket, faster than min time for next bucket).
Query response time histogram
256us	1ms	4ms	16ms	64ms	256ms	1s	4s	16s	gt	max	tag
95.920	4.075	0.005	nonzero	0.000	0.000	0.000	0.000	0.000	0.000	0.011	my5651.cy8
73.491	26.505	0.004	nonzero	0.000	0.000	0.000	0.000	0.000	0.000	0.012	my5739.cy8
25.048	74.946	0.006	0.001	nonzero	0.000	0.000	0.000	0.000	0.000	0.028	my8031.cy8
4.283	95.711	0.005	nonzero	0.000	0.000	0.000	0.000	0.000	0.000	0.006	fbmy5635.cay9c
2.425	97.567	0.007	nonzero	0.000	0.000	0.000	0.000	0.000	0.000	0.005	fbmy8028.cay9c
Insert response time histogram
256us	1ms	4ms	16ms	64ms	256ms	1s	4s	16s	gt	max	tag
0.000	0.000	95.865	4.135	0.000	0.000	0.000	0.000	0.000	0.000	0.014	my5651.cy8
0.000	0.000	99.651	0.346	0.003	0.000	0.000	0.000	0.000	0.000	0.018	my5739.cy8
0.000	0.000	99.526	0.404	0.069	0.000	0.000	0.000	0.000	0.000	0.032	my8031.cy8
0.000	0.000	99.963	0.037	0.000	0.000	0.000	0.000	0.000	0.000	0.010	fbmy5635.cay9c
0.000	0.000	99.790	0.206	0.004	0.000	0.000	0.000	0.000	0.000	0.019	fbmy8028.cay9c
q1000.1
- q1000.1: range queries with 1000 insert/s per client
- Legend for results is here.
- Each entry lists the percentage of responses that fit in that bucket (slower than max time for previous bucket, faster than min time for next bucket).
Query response time histogram
256us	1ms	4ms	16ms	64ms	256ms	1s	4s	16s	gt	max	tag
95.456	4.536	0.008	nonzero	0.000	0.000	0.000	0.000	0.000	0.000	0.014	my5651.cy8
74.619	25.373	0.008	nonzero	nonzero	0.000	0.000	0.000	0.000	0.000	0.034	my5739.cy8
29.902	70.083	0.014	nonzero	nonzero	0.000	0.000	0.000	0.000	0.000	0.028	my8031.cy8
5.595	94.390	0.015	nonzero	nonzero	0.000	0.000	0.000	0.000	0.000	0.018	fbmy5635.cay9c
2.920	97.062	0.018	nonzero	0.000	0.000	0.000	0.000	0.000	0.000	0.008	fbmy8028.cay9c
Insert response time histogram
256us	1ms	4ms	16ms	64ms	256ms	1s	4s	16s	gt	max	tag
0.000	0.000	97.892	2.100	0.008	0.000	0.000	0.000	0.000	0.000	0.052	my5651.cy8
0.000	0.000	99.856	0.139	0.006	0.000	0.000	0.000	0.000	0.000	0.055	my5739.cy8
0.000	0.000	99.575	0.387	0.038	0.000	0.000	0.000	0.000	0.000	0.037	my8031.cy8
0.000	0.000	99.911	0.089	0.000	0.000	0.000	0.000	0.000	0.000	0.013	fbmy5635.cay9c
0.000	0.000	99.724	0.274	0.002	0.000	0.000	0.000	0.000	0.000	0.027	fbmy8028.cay9c