Introduction
This is a report for the insert benchmark with 20M docs and 1 client(s). It is generated by scripts (bash, awk, sed) and Tufte might not be impressed. An overview of the insert benchmark is here and a short update is here. Below, by DBMS, I mean DBMS+version.config. An example is my8020.c10b40 where my means MySQL, 8020 is version 8.0.20 and c10b40 is the name for the configuration file.
The test server has 8 AMD cores, 16G RAM and an NVMe SSD. It is described here. The benchmark was run with 1 clients and there were 1 or 2 connections per client (1 for queries, 1 for inserts). The benchmark loads 20M rows without secondary indexes, creates secondary indexes, loads another 20M rows then does 3 read+write tests for one hour each that do queries as fast as possible with 100, 500 and then 1000 writes/second/client concurrent with the queries. The database is cached by the storage engine and the only IO is for writes. Clients and the DBMS share one server. The per-database configs are in the per-database subdirectories here.
The tested DBMS are:
- my5651.cy8 - MySQL 5.6.51, InnoDB and the cy8 config
- my5739.cy8 - MySQL 5.7.39, InnoDB and the cy8 config
- my8031.cy8 - MySQL 8.0.31, InnoDB and the cy8 config
- fbmy5635.cay9c - FB MySQL 5.6.35, MyRocks and the cay9c config
- fbmy8028.cay9c - FB MySQL 8.0.28, MyRocks and the cay9c config
Contents
- Summary
- l.i0: load without secondary indexes
- l.x: create secondary indexes
- l.i1: continue load after secondary indexes created
- q100.1: range queries with 100 insert/s per client
- q500.1: range queries with 500 insert/s per client
- q1000.1: range queries with 1000 insert/s per client
Summary
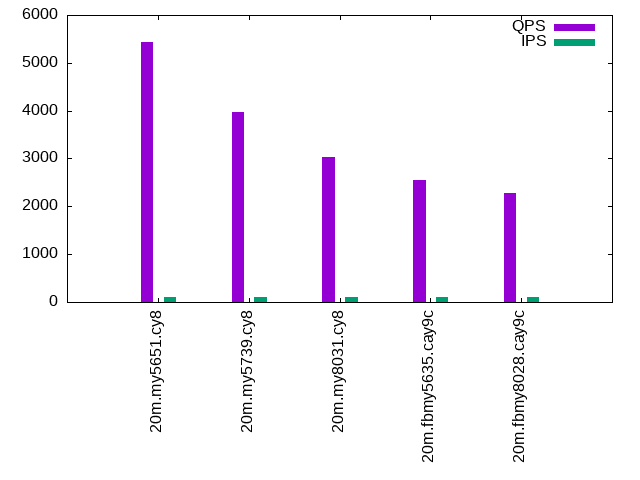
The numbers are inserts/s for l.i0 and l.i1, indexed docs (or rows) /s for l.x and queries/s for q*.2. The values are the average rate over the entire test for inserts (IPS) and queries (QPS). The range of values for IPS and QPS is split into 3 parts: bottom 25%, middle 50%, top 25%. Values in the bottom 25% have a red background, values in the top 25% have a green background and values in the middle have no color. A gray background is used for values that can be ignored because the DBMS did not sustain the target insert rate. Red backgrounds are not used when the minimum value is within 80% of the max value.
| dbms | l.i0 | l.x | l.i1 | q100.1 | q500.1 | q1000.1 |
|---|---|---|---|---|---|---|
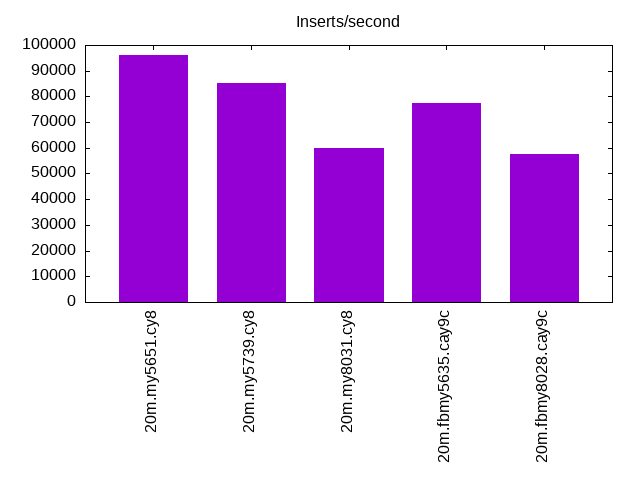
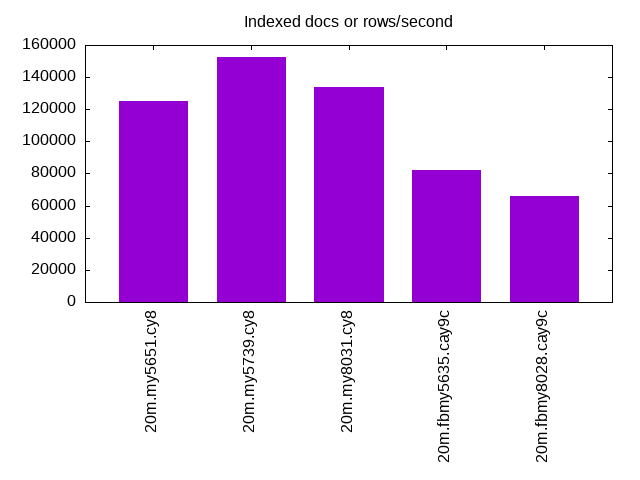
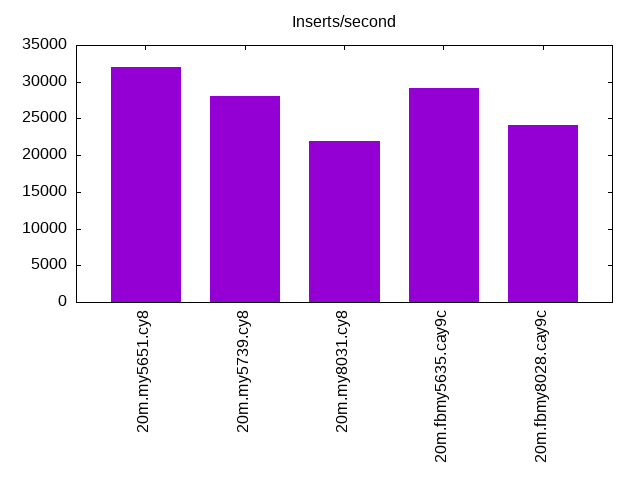
| 20m.my5651.cy8 | 96154 | 124845 | 32000 | 5438 | 5362 | 5369 |
| 20m.my5739.cy8 | 85106 | 152273 | 28011 | 3965 | 3958 | 3975 |
| 20m.my8031.cy8 | 60060 | 134000 | 21858 | 3024 | 3079 | 3062 |
| 20m.fbmy5635.cay9c | 77519 | 82041 | 29112 | 2557 | 2545 | 2553 |
| 20m.fbmy8028.cay9c | 57471 | 65686 | 24096 | 2282 | 2313 | 2318 |
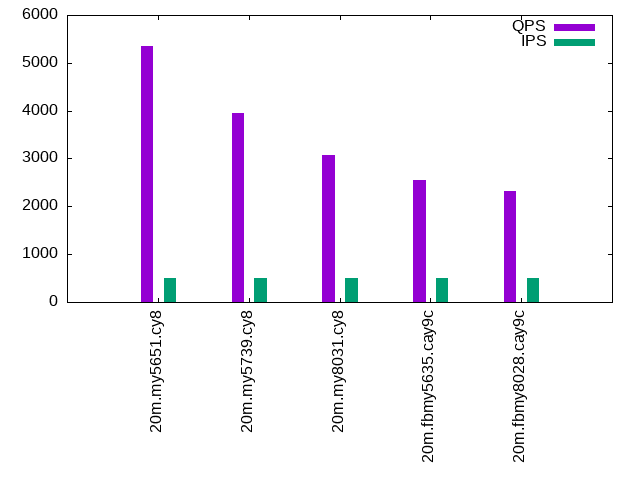
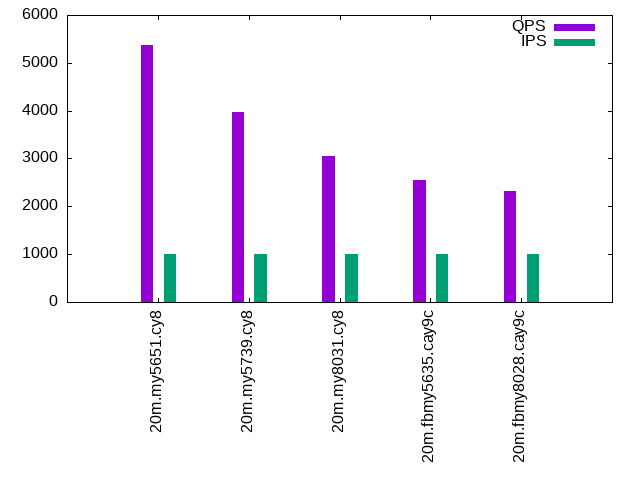
This lists the average rate of inserts/s for the tests that do inserts concurrent with queries. For such tests the query rate is listed in the table above. The read+write tests are setup so that the insert rate should match the target rate every second. Cells that are not at least 95% of the target have a red background to indicate a failure to satisfy the target.
| dbms | q100.1 | q500.1 | q1000.1 |
|---|---|---|---|
| my5651.cy8 | 100 | 499 | 999 |
| my5739.cy8 | 100 | 499 | 999 |
| my8031.cy8 | 100 | 499 | 999 |
| fbmy5635.cay9c | 100 | 499 | 999 |
| fbmy8028.cay9c | 100 | 499 | 999 |
| target | 100 | 500 | 1000 |
l.i0
l.i0: load without secondary indexes. Graphs for performance per 1-second interval are here.
Average throughput:
Insert response time histogram: each cell has the percentage of responses that take <= the time in the header and max is the max response time in seconds. For the max column values in the top 25% of the range have a red background and in the bottom 25% of the range have a green background. The red background is not used when the min value is within 80% of the max value.
| dbms | 256us | 1ms | 4ms | 16ms | 64ms | 256ms | 1s | 4s | 16s | gt | max |
|---|---|---|---|---|---|---|---|---|---|---|---|
| my5651.cy8 | 87.213 | 12.536 | 0.245 | 0.003 | 0.003 | 0.112 | |||||
| my5739.cy8 | 1.279 | 98.543 | 0.148 | 0.027 | 0.003 | 0.111 | |||||
| my8031.cy8 | 99.797 | 0.199 | 0.004 | 0.049 | |||||||
| fbmy5635.cay9c | 99.996 | 0.001 | 0.003 | 0.043 | |||||||
| fbmy8028.cay9c | 99.926 | 0.069 | 0.005 | 0.054 |
Performance metrics for the DBMS listed above. Some are normalized by throughput, others are not. Legend for results is here.
ips	qps	rps	rmbps	wps	wmbps	rpq	rkbpq	wpi	wkbpi	csps	cpups	cspq	cpupq	dbgb1	dbgb2	rss	maxop	p50	p99	tag
96154	0	844	3.3	93.3	21.9	0.009	0.035	0.001	0.234	11075	22.6	0.115	19	1.3	41.8	2.1	0.112	96890	81808	20m.my5651.cy8
85106	0	0	0.0	166.9	21.7	0.000	0.000	0.002	0.261	8544	21.6	0.100	20	1.3	41.8	2.3	0.111	86005	71220	20m.my5739.cy8
60060	0	0	0.0	357.1	21.8	0.000	0.000	0.006	0.372	7181	21.6	0.120	29	1.3	3.8	2.5	0.049	60331	56137	20m.my8031.cy8
77519	0	0	0.0	63.0	13.1	0.000	0.000	0.001	0.173	7672	22.5	0.099	23	0.7	1.8	0.2	0.043	77912	71120	20m.fbmy5635.cay9c
57471	0	0	0.0	56.5	11.1	0.000	0.000	0.001	0.198	6042	22.7	0.105	32	0.7	1.9	0.6	0.054	57637	53240	20m.fbmy8028.cay9c
l.x
l.x: create secondary indexes.
Average throughput:
Performance metrics for the DBMS listed above. Some are normalized by throughput, others are not. Legend for results is here.
ips	qps	rps	rmbps	wps	wmbps	rpq	rkbpq	wpi	wkbpi	csps	cpups	cspq	cpupq	dbgb1	dbgb2	rss	maxop	p50	p99	tag
124845	0	13	0.1	1601.9	128.5	0.000	0.000	0.013	1.054	4186	12.5	0.034	8	2.7	43.2	3.5	0.009	NA	NA	20m.my5651.cy8
152273	0	0	0.0	1876.9	134.0	0.000	0.000	0.012	0.901	9429	12.6	0.062	7	3.0	43.5	3.7	0.009	NA	NA	20m.my5739.cy8
134000	0	714	47.8	2285.3	135.7	0.005	0.365	0.017	1.037	9154	39.9	0.068	24	3.0	5.4	3.9	0.006	NA	NA	20m.my8031.cy8
82041	0	0	0.0	57.9	12.5	0.000	0.000	0.001	0.156	331	12.4	0.004	12	1.5	2.5	1.3	0.002	NA	NA	20m.fbmy5635.cay9c
65686	0	0	0.0	45.2	10.0	0.000	0.000	0.001	0.156	431	12.6	0.007	15	1.4	2.7	1.9	0.003	NA	NA	20m.fbmy8028.cay9c
l.i1
l.i1: continue load after secondary indexes created. Graphs for performance per 1-second interval are here.
Average throughput:
Insert response time histogram: each cell has the percentage of responses that take <= the time in the header and max is the max response time in seconds. For the max column values in the top 25% of the range have a red background and in the bottom 25% of the range have a green background. The red background is not used when the min value is within 80% of the max value.
| dbms | 256us | 1ms | 4ms | 16ms | 64ms | 256ms | 1s | 4s | 16s | gt | max |
|---|---|---|---|---|---|---|---|---|---|---|---|
| my5651.cy8 | 99.237 | 0.754 | 0.009 | nonzero | 2.118 | ||||||
| my5739.cy8 | 99.409 | 0.504 | 0.086 | 0.001 | 0.085 | ||||||
| my8031.cy8 | 99.321 | 0.508 | 0.168 | 0.002 | 0.085 | ||||||
| fbmy5635.cay9c | 99.996 | 0.002 | 0.003 | 0.042 | |||||||
| fbmy8028.cay9c | 99.958 | 0.037 | 0.005 | 0.001 | 0.127 |
Performance metrics for the DBMS listed above. Some are normalized by throughput, others are not. Legend for results is here.
ips	qps	rps	rmbps	wps	wmbps	rpq	rkbpq	wpi	wkbpi	csps	cpups	cspq	cpupq	dbgb1	dbgb2	rss	maxop	p50	p99	tag
32000	0	560	2.2	130.8	20.6	0.018	0.070	0.004	0.661	7557	16.9	0.236	42	7.9	48.4	7.9	2.118	32813	5193	20m.my5651.cy8
28011	0	0	0.0	684.8	34.2	0.000	0.000	0.024	1.249	7576	17.0	0.270	49	7.9	48.4	8.2	0.085	28569	7941	20m.my5739.cy8
21858	0	100	1.6	1988.5	62.9	0.005	0.073	0.091	2.947	11388	17.1	0.521	63	7.9	10.3	8.3	0.085	22475	1548	20m.my8031.cy8
29112	0	9	1.1	159.1	36.2	0.000	0.038	0.005	1.274	6399	30.2	0.220	83	3.0	4.7	2.1	0.042	28917	26120	20m.fbmy5635.cay9c
24096	0	7	0.9	118.3	26.7	0.000	0.038	0.005	1.134	5515	27.9	0.229	93	2.9	4.8	2.6	0.127	23824	21327	20m.fbmy8028.cay9c
q100.1
q100.1: range queries with 100 insert/s per client. Graphs for performance per 1-second interval are here.
Average throughput:
Query response time histogram: each cell has the percentage of responses that take <= the time in the header and max is the max response time in seconds. For max values in the top 25% of the range have a red background and in the bottom 25% of the range have a green background. The red background is not used when the min value is within 80% of the max value.
| dbms | 256us | 1ms | 4ms | 16ms | 64ms | 256ms | 1s | 4s | 16s | gt | max |
|---|---|---|---|---|---|---|---|---|---|---|---|
| my5651.cy8 | 96.771 | 3.229 | 0.001 | nonzero | nonzero | 0.036 | |||||
| my5739.cy8 | 69.744 | 30.256 | nonzero | nonzero | nonzero | 0.019 | |||||
| my8031.cy8 | 22.161 | 77.839 | nonzero | nonzero | 0.009 | ||||||
| fbmy5635.cay9c | 1.285 | 98.715 | nonzero | nonzero | 0.006 | ||||||
| fbmy8028.cay9c | 0.480 | 99.519 | nonzero | 0.004 |
Insert response time histogram: each cell has the percentage of responses that take <= the time in the header and max is the max response time in seconds. For max values in the top 25% of the range have a red background and in the bottom 25% of the range have a green background. The red background is not used when the min value is within 80% of the max value.
| dbms | 256us | 1ms | 4ms | 16ms | 64ms | 256ms | 1s | 4s | 16s | gt | max |
|---|---|---|---|---|---|---|---|---|---|---|---|
| my5651.cy8 | 74.833 | 24.681 | 0.486 | 0.039 | |||||||
| my5739.cy8 | 99.278 | 0.681 | 0.042 | 0.022 | |||||||
| my8031.cy8 | 99.181 | 0.792 | 0.028 | 0.029 | |||||||
| fbmy5635.cay9c | 100.000 | 0.004 | |||||||||
| fbmy8028.cay9c | 99.889 | 0.111 | 0.015 |
Performance metrics for the DBMS listed above. Some are normalized by throughput, others are not. Legend for results is here.
ips	qps	rps	rmbps	wps	wmbps	rpq	rkbpq	wpi	wkbpi	csps	cpups	cspq	cpupq	dbgb1	dbgb2	rss	maxop	p50	p99	tag
100	5438	2	0.0	58.7	1.7	0.000	0.001	0.588	17.547	21147	13.2	3.888	194	8.1	48.6	8.0	0.036	5418	5306	20m.my5651.cy8
100	3965	0	0.0	18.2	0.5	0.000	0.000	0.182	5.086	15414	12.9	3.887	260	8.1	48.6	8.3	0.019	3931	3772	20m.my5739.cy8
100	3024	0	0.0	124.4	3.0	0.000	0.000	1.246	31.023	12385	13.1	4.096	347	8.1	10.5	8.5	0.009	3005	2861	20m.my8031.cy8
100	2557	0	0.0	6.0	0.2	0.000	0.000	0.060	2.045	9957	13.0	3.894	407	2.8	4.6	3.9	0.006	2541	2413	20m.fbmy5635.cay9c
100	2282	0	0.0	3.8	0.2	0.000	0.000	0.038	1.634	9042	13.4	3.962	470	2.8	4.8	4.3	0.004	2237	2046	20m.fbmy8028.cay9c
q500.1
q500.1: range queries with 500 insert/s per client. Graphs for performance per 1-second interval are here.
Average throughput:
Query response time histogram: each cell has the percentage of responses that take <= the time in the header and max is the max response time in seconds. For max values in the top 25% of the range have a red background and in the bottom 25% of the range have a green background. The red background is not used when the min value is within 80% of the max value.
| dbms | 256us | 1ms | 4ms | 16ms | 64ms | 256ms | 1s | 4s | 16s | gt | max |
|---|---|---|---|---|---|---|---|---|---|---|---|
| my5651.cy8 | 96.426 | 3.572 | 0.001 | nonzero | 0.009 | ||||||
| my5739.cy8 | 69.506 | 30.493 | nonzero | nonzero | nonzero | 0.043 | |||||
| my8031.cy8 | 24.590 | 75.409 | 0.001 | nonzero | nonzero | 0.028 | |||||
| fbmy5635.cay9c | 1.466 | 98.533 | nonzero | 0.003 | |||||||
| fbmy8028.cay9c | 0.448 | 99.551 | nonzero | nonzero | 0.004 |
Insert response time histogram: each cell has the percentage of responses that take <= the time in the header and max is the max response time in seconds. For max values in the top 25% of the range have a red background and in the bottom 25% of the range have a green background. The red background is not used when the min value is within 80% of the max value.
| dbms | 256us | 1ms | 4ms | 16ms | 64ms | 256ms | 1s | 4s | 16s | gt | max |
|---|---|---|---|---|---|---|---|---|---|---|---|
| my5651.cy8 | 90.817 | 9.183 | 0.011 | ||||||||
| my5739.cy8 | 99.539 | 0.444 | 0.017 | 0.054 | |||||||
| my8031.cy8 | 99.456 | 0.483 | 0.061 | 0.035 | |||||||
| fbmy5635.cay9c | 99.981 | 0.019 | 0.006 | ||||||||
| fbmy8028.cay9c | 99.933 | 0.067 | 0.008 |
Performance metrics for the DBMS listed above. Some are normalized by throughput, others are not. Legend for results is here.
ips	qps	rps	rmbps	wps	wmbps	rpq	rkbpq	wpi	wkbpi	csps	cpups	cspq	cpupq	dbgb1	dbgb2	rss	maxop	p50	p99	tag
499	5362	9	0.0	9.9	0.6	0.002	0.007	0.020	1.174	20782	13.3	3.876	198	8.7	49.2	8.6	0.009	5338	5241	20m.my5651.cy8
499	3958	0	0.0	20.4	0.8	0.000	0.000	0.041	1.608	15453	13.3	3.904	269	8.7	49.2	8.9	0.043	3931	3771	20m.my5739.cy8
499	3079	0	0.0	234.5	6.1	0.000	0.000	0.470	12.519	12986	13.7	4.217	356	8.7	11.1	9.1	0.028	3053	2893	20m.my8031.cy8
499	2545	0	0.0	6.8	0.5	0.000	0.000	0.014	0.935	9976	13.3	3.919	418	3.0	3.0	4.7	0.003	2525	2397	20m.fbmy5635.cay9c
499	2313	0	0.0	4.8	0.5	0.000	0.000	0.010	0.927	9243	13.8	3.996	477	3.0	3.2	5.0	0.004	2317	2014	20m.fbmy8028.cay9c
q1000.1
q1000.1: range queries with 1000 insert/s per client. Graphs for performance per 1-second interval are here.
Average throughput:
Query response time histogram: each cell has the percentage of responses that take <= the time in the header and max is the max response time in seconds. For max values in the top 25% of the range have a red background and in the bottom 25% of the range have a green background. The red background is not used when the min value is within 80% of the max value.
| dbms | 256us | 1ms | 4ms | 16ms | 64ms | 256ms | 1s | 4s | 16s | gt | max |
|---|---|---|---|---|---|---|---|---|---|---|---|
| my5651.cy8 | 96.352 | 3.647 | 0.001 | nonzero | 0.007 | ||||||
| my5739.cy8 | 70.061 | 29.938 | nonzero | nonzero | 0.016 | ||||||
| my8031.cy8 | 23.516 | 76.483 | 0.001 | nonzero | nonzero | 0.027 | |||||
| fbmy5635.cay9c | 1.443 | 98.556 | 0.001 | 0.003 | |||||||
| fbmy8028.cay9c | 0.543 | 99.456 | 0.001 | nonzero | 0.005 |
Insert response time histogram: each cell has the percentage of responses that take <= the time in the header and max is the max response time in seconds. For max values in the top 25% of the range have a red background and in the bottom 25% of the range have a green background. The red background is not used when the min value is within 80% of the max value.
| dbms | 256us | 1ms | 4ms | 16ms | 64ms | 256ms | 1s | 4s | 16s | gt | max |
|---|---|---|---|---|---|---|---|---|---|---|---|
| my5651.cy8 | 95.492 | 4.508 | 0.010 | ||||||||
| my5739.cy8 | 99.844 | 0.153 | 0.003 | 0.018 | |||||||
| my8031.cy8 | 99.733 | 0.240 | 0.026 | 0.030 | |||||||
| fbmy5635.cay9c | 99.974 | 0.026 | 0.014 | ||||||||
| fbmy8028.cay9c | 99.933 | 0.065 | 0.001 | 0.016 |
Performance metrics for the DBMS listed above. Some are normalized by throughput, others are not. Legend for results is here.
ips	qps	rps	rmbps	wps	wmbps	rpq	rkbpq	wpi	wkbpi	csps	cpups	cspq	cpupq	dbgb1	dbgb2	rss	maxop	p50	p99	tag
999	5369	18	0.1	10.0	0.6	0.003	0.013	0.010	0.632	20920	13.3	3.897	198	9.1	49.6	9.0	0.007	5353	5226	20m.my5651.cy8
999	3975	0	0.0	32.9	1.1	0.000	0.000	0.033	1.130	15667	14.1	3.942	284	9.1	49.7	9.3	0.016	3934	3772	20m.my5739.cy8
999	3062	0	0.0	372.8	9.6	0.000	0.000	0.373	9.878	13462	13.9	4.396	363	9.1	11.6	9.5	0.027	3037	2892	20m.my8031.cy8
999	2553	0	0.0	10.3	1.3	0.000	0.000	0.010	1.363	10108	14.3	3.960	448	3.3	3.7	7.0	0.003	2541	2397	20m.fbmy5635.cay9c
999	2318	0	0.0	8.1	1.3	0.000	0.000	0.008	1.284	9350	14.7	4.034	507	3.3	3.9	7.6	0.005	2333	2014	20m.fbmy8028.cay9c
l.i0
l.i0: load without secondary indexes
Performance metrics for all DBMS, not just the ones listed above. Some are normalized by throughput, others are not. Legend for results is here.
ips	qps	rps	rmbps	wps	wmbps	rpq	rkbpq	wpi	wkbpi	csps	cpups	cspq	cpupq	dbgb1	dbgb2	rss	maxop	p50	p99	tag
96154	0	844	3.3	93.3	21.9	0.009	0.035	0.001	0.234	11075	22.6	0.115	19	1.3	41.8	2.1	0.112	96890	81808	20m.my5651.cy8
85106	0	0	0.0	166.9	21.7	0.000	0.000	0.002	0.261	8544	21.6	0.100	20	1.3	41.8	2.3	0.111	86005	71220	20m.my5739.cy8
60060	0	0	0.0	357.1	21.8	0.000	0.000	0.006	0.372	7181	21.6	0.120	29	1.3	3.8	2.5	0.049	60331	56137	20m.my8031.cy8
77519	0	0	0.0	63.0	13.1	0.000	0.000	0.001	0.173	7672	22.5	0.099	23	0.7	1.8	0.2	0.043	77912	71120	20m.fbmy5635.cay9c
57471	0	0	0.0	56.5	11.1	0.000	0.000	0.001	0.198	6042	22.7	0.105	32	0.7	1.9	0.6	0.054	57637	53240	20m.fbmy8028.cay9c
l.x
l.x: create secondary indexes
Performance metrics for all DBMS, not just the ones listed above. Some are normalized by throughput, others are not. Legend for results is here.
ips	qps	rps	rmbps	wps	wmbps	rpq	rkbpq	wpi	wkbpi	csps	cpups	cspq	cpupq	dbgb1	dbgb2	rss	maxop	p50	p99	tag
124845	0	13	0.1	1601.9	128.5	0.000	0.000	0.013	1.054	4186	12.5	0.034	8	2.7	43.2	3.5	0.009	NA	NA	20m.my5651.cy8
152273	0	0	0.0	1876.9	134.0	0.000	0.000	0.012	0.901	9429	12.6	0.062	7	3.0	43.5	3.7	0.009	NA	NA	20m.my5739.cy8
134000	0	714	47.8	2285.3	135.7	0.005	0.365	0.017	1.037	9154	39.9	0.068	24	3.0	5.4	3.9	0.006	NA	NA	20m.my8031.cy8
82041	0	0	0.0	57.9	12.5	0.000	0.000	0.001	0.156	331	12.4	0.004	12	1.5	2.5	1.3	0.002	NA	NA	20m.fbmy5635.cay9c
65686	0	0	0.0	45.2	10.0	0.000	0.000	0.001	0.156	431	12.6	0.007	15	1.4	2.7	1.9	0.003	NA	NA	20m.fbmy8028.cay9c
l.i1
l.i1: continue load after secondary indexes created
Performance metrics for all DBMS, not just the ones listed above. Some are normalized by throughput, others are not. Legend for results is here.
ips	qps	rps	rmbps	wps	wmbps	rpq	rkbpq	wpi	wkbpi	csps	cpups	cspq	cpupq	dbgb1	dbgb2	rss	maxop	p50	p99	tag
32000	0	560	2.2	130.8	20.6	0.018	0.070	0.004	0.661	7557	16.9	0.236	42	7.9	48.4	7.9	2.118	32813	5193	20m.my5651.cy8
28011	0	0	0.0	684.8	34.2	0.000	0.000	0.024	1.249	7576	17.0	0.270	49	7.9	48.4	8.2	0.085	28569	7941	20m.my5739.cy8
21858	0	100	1.6	1988.5	62.9	0.005	0.073	0.091	2.947	11388	17.1	0.521	63	7.9	10.3	8.3	0.085	22475	1548	20m.my8031.cy8
29112	0	9	1.1	159.1	36.2	0.000	0.038	0.005	1.274	6399	30.2	0.220	83	3.0	4.7	2.1	0.042	28917	26120	20m.fbmy5635.cay9c
24096	0	7	0.9	118.3	26.7	0.000	0.038	0.005	1.134	5515	27.9	0.229	93	2.9	4.8	2.6	0.127	23824	21327	20m.fbmy8028.cay9c
q100.1
q100.1: range queries with 100 insert/s per client
Performance metrics for all DBMS, not just the ones listed above. Some are normalized by throughput, others are not. Legend for results is here.
ips	qps	rps	rmbps	wps	wmbps	rpq	rkbpq	wpi	wkbpi	csps	cpups	cspq	cpupq	dbgb1	dbgb2	rss	maxop	p50	p99	tag
100	5438	2	0.0	58.7	1.7	0.000	0.001	0.588	17.547	21147	13.2	3.888	194	8.1	48.6	8.0	0.036	5418	5306	20m.my5651.cy8
100	3965	0	0.0	18.2	0.5	0.000	0.000	0.182	5.086	15414	12.9	3.887	260	8.1	48.6	8.3	0.019	3931	3772	20m.my5739.cy8
100	3024	0	0.0	124.4	3.0	0.000	0.000	1.246	31.023	12385	13.1	4.096	347	8.1	10.5	8.5	0.009	3005	2861	20m.my8031.cy8
100	2557	0	0.0	6.0	0.2	0.000	0.000	0.060	2.045	9957	13.0	3.894	407	2.8	4.6	3.9	0.006	2541	2413	20m.fbmy5635.cay9c
100	2282	0	0.0	3.8	0.2	0.000	0.000	0.038	1.634	9042	13.4	3.962	470	2.8	4.8	4.3	0.004	2237	2046	20m.fbmy8028.cay9c
q500.1
q500.1: range queries with 500 insert/s per client
Performance metrics for all DBMS, not just the ones listed above. Some are normalized by throughput, others are not. Legend for results is here.
ips	qps	rps	rmbps	wps	wmbps	rpq	rkbpq	wpi	wkbpi	csps	cpups	cspq	cpupq	dbgb1	dbgb2	rss	maxop	p50	p99	tag
499	5362	9	0.0	9.9	0.6	0.002	0.007	0.020	1.174	20782	13.3	3.876	198	8.7	49.2	8.6	0.009	5338	5241	20m.my5651.cy8
499	3958	0	0.0	20.4	0.8	0.000	0.000	0.041	1.608	15453	13.3	3.904	269	8.7	49.2	8.9	0.043	3931	3771	20m.my5739.cy8
499	3079	0	0.0	234.5	6.1	0.000	0.000	0.470	12.519	12986	13.7	4.217	356	8.7	11.1	9.1	0.028	3053	2893	20m.my8031.cy8
499	2545	0	0.0	6.8	0.5	0.000	0.000	0.014	0.935	9976	13.3	3.919	418	3.0	3.0	4.7	0.003	2525	2397	20m.fbmy5635.cay9c
499	2313	0	0.0	4.8	0.5	0.000	0.000	0.010	0.927	9243	13.8	3.996	477	3.0	3.2	5.0	0.004	2317	2014	20m.fbmy8028.cay9c
q1000.1
q1000.1: range queries with 1000 insert/s per client
Performance metrics for all DBMS, not just the ones listed above. Some are normalized by throughput, others are not. Legend for results is here.
ips	qps	rps	rmbps	wps	wmbps	rpq	rkbpq	wpi	wkbpi	csps	cpups	cspq	cpupq	dbgb1	dbgb2	rss	maxop	p50	p99	tag
999	5369	18	0.1	10.0	0.6	0.003	0.013	0.010	0.632	20920	13.3	3.897	198	9.1	49.6	9.0	0.007	5353	5226	20m.my5651.cy8
999	3975	0	0.0	32.9	1.1	0.000	0.000	0.033	1.130	15667	14.1	3.942	284	9.1	49.7	9.3	0.016	3934	3772	20m.my5739.cy8
999	3062	0	0.0	372.8	9.6	0.000	0.000	0.373	9.878	13462	13.9	4.396	363	9.1	11.6	9.5	0.027	3037	2892	20m.my8031.cy8
999	2553	0	0.0	10.3	1.3	0.000	0.000	0.010	1.363	10108	14.3	3.960	448	3.3	3.7	7.0	0.003	2541	2397	20m.fbmy5635.cay9c
999	2318	0	0.0	8.1	1.3	0.000	0.000	0.008	1.284	9350	14.7	4.034	507	3.3	3.9	7.6	0.005	2333	2014	20m.fbmy8028.cay9c
l.i0
- l.i0: load without secondary indexes
- Legend for results is here.
- Each entry lists the percentage of responses that fit in that bucket (slower than max time for previous bucket, faster than min time for next bucket).
Insert response time histogram
256us	1ms	4ms	16ms	64ms	256ms	1s	4s	16s	gt	max	tag
0.000	87.213	12.536	0.245	0.003	0.003	0.000	0.000	0.000	0.000	0.112	my5651.cy8
0.000	1.279	98.543	0.148	0.027	0.003	0.000	0.000	0.000	0.000	0.111	my5739.cy8
0.000	0.000	99.797	0.199	0.004	0.000	0.000	0.000	0.000	0.000	0.049	my8031.cy8
0.000	0.000	99.996	0.001	0.003	0.000	0.000	0.000	0.000	0.000	0.043	fbmy5635.cay9c
0.000	0.000	99.926	0.069	0.005	0.000	0.000	0.000	0.000	0.000	0.054	fbmy8028.cay9c
l.x
- l.x: create secondary indexes
- Legend for results is here.
- Each entry lists the percentage of responses that fit in that bucket (slower than max time for previous bucket, faster than min time for next bucket).
TODO - determine whether there is data for create index response time
l.i1
- l.i1: continue load after secondary indexes created
- Legend for results is here.
- Each entry lists the percentage of responses that fit in that bucket (slower than max time for previous bucket, faster than min time for next bucket).
Insert response time histogram
256us	1ms	4ms	16ms	64ms	256ms	1s	4s	16s	gt	max	tag
0.000	0.000	99.237	0.754	0.009	0.000	0.000	nonzero	0.000	0.000	2.118	my5651.cy8
0.000	0.000	99.409	0.504	0.086	0.001	0.000	0.000	0.000	0.000	0.085	my5739.cy8
0.000	0.000	99.321	0.508	0.168	0.002	0.000	0.000	0.000	0.000	0.085	my8031.cy8
0.000	0.000	99.996	0.002	0.003	0.000	0.000	0.000	0.000	0.000	0.042	fbmy5635.cay9c
0.000	0.000	99.958	0.037	0.005	0.001	0.000	0.000	0.000	0.000	0.127	fbmy8028.cay9c
q100.1
- q100.1: range queries with 100 insert/s per client
- Legend for results is here.
- Each entry lists the percentage of responses that fit in that bucket (slower than max time for previous bucket, faster than min time for next bucket).
Query response time histogram
256us	1ms	4ms	16ms	64ms	256ms	1s	4s	16s	gt	max	tag
96.771	3.229	0.001	nonzero	nonzero	0.000	0.000	0.000	0.000	0.000	0.036	my5651.cy8
69.744	30.256	nonzero	nonzero	nonzero	0.000	0.000	0.000	0.000	0.000	0.019	my5739.cy8
22.161	77.839	nonzero	nonzero	0.000	0.000	0.000	0.000	0.000	0.000	0.009	my8031.cy8
1.285	98.715	nonzero	nonzero	0.000	0.000	0.000	0.000	0.000	0.000	0.006	fbmy5635.cay9c
0.480	99.519	nonzero	0.000	0.000	0.000	0.000	0.000	0.000	0.000	0.004	fbmy8028.cay9c
Insert response time histogram
256us	1ms	4ms	16ms	64ms	256ms	1s	4s	16s	gt	max	tag
0.000	0.000	74.833	24.681	0.486	0.000	0.000	0.000	0.000	0.000	0.039	my5651.cy8
0.000	0.000	99.278	0.681	0.042	0.000	0.000	0.000	0.000	0.000	0.022	my5739.cy8
0.000	0.000	99.181	0.792	0.028	0.000	0.000	0.000	0.000	0.000	0.029	my8031.cy8
0.000	0.000	100.000	0.000	0.000	0.000	0.000	0.000	0.000	0.000	0.004	fbmy5635.cay9c
0.000	0.000	99.889	0.111	0.000	0.000	0.000	0.000	0.000	0.000	0.015	fbmy8028.cay9c
q500.1
- q500.1: range queries with 500 insert/s per client
- Legend for results is here.
- Each entry lists the percentage of responses that fit in that bucket (slower than max time for previous bucket, faster than min time for next bucket).
Query response time histogram
256us	1ms	4ms	16ms	64ms	256ms	1s	4s	16s	gt	max	tag
96.426	3.572	0.001	nonzero	0.000	0.000	0.000	0.000	0.000	0.000	0.009	my5651.cy8
69.506	30.493	nonzero	nonzero	nonzero	0.000	0.000	0.000	0.000	0.000	0.043	my5739.cy8
24.590	75.409	0.001	nonzero	nonzero	0.000	0.000	0.000	0.000	0.000	0.028	my8031.cy8
1.466	98.533	nonzero	0.000	0.000	0.000	0.000	0.000	0.000	0.000	0.003	fbmy5635.cay9c
0.448	99.551	nonzero	nonzero	0.000	0.000	0.000	0.000	0.000	0.000	0.004	fbmy8028.cay9c
Insert response time histogram
256us	1ms	4ms	16ms	64ms	256ms	1s	4s	16s	gt	max	tag
0.000	0.000	90.817	9.183	0.000	0.000	0.000	0.000	0.000	0.000	0.011	my5651.cy8
0.000	0.000	99.539	0.444	0.017	0.000	0.000	0.000	0.000	0.000	0.054	my5739.cy8
0.000	0.000	99.456	0.483	0.061	0.000	0.000	0.000	0.000	0.000	0.035	my8031.cy8
0.000	0.000	99.981	0.019	0.000	0.000	0.000	0.000	0.000	0.000	0.006	fbmy5635.cay9c
0.000	0.000	99.933	0.067	0.000	0.000	0.000	0.000	0.000	0.000	0.008	fbmy8028.cay9c
q1000.1
- q1000.1: range queries with 1000 insert/s per client
- Legend for results is here.
- Each entry lists the percentage of responses that fit in that bucket (slower than max time for previous bucket, faster than min time for next bucket).
Query response time histogram
256us	1ms	4ms	16ms	64ms	256ms	1s	4s	16s	gt	max	tag
96.352	3.647	0.001	nonzero	0.000	0.000	0.000	0.000	0.000	0.000	0.007	my5651.cy8
70.061	29.938	nonzero	nonzero	0.000	0.000	0.000	0.000	0.000	0.000	0.016	my5739.cy8
23.516	76.483	0.001	nonzero	nonzero	0.000	0.000	0.000	0.000	0.000	0.027	my8031.cy8
1.443	98.556	0.001	0.000	0.000	0.000	0.000	0.000	0.000	0.000	0.003	fbmy5635.cay9c
0.543	99.456	0.001	nonzero	0.000	0.000	0.000	0.000	0.000	0.000	0.005	fbmy8028.cay9c
Insert response time histogram
256us	1ms	4ms	16ms	64ms	256ms	1s	4s	16s	gt	max	tag
0.000	0.000	95.492	4.508	0.000	0.000	0.000	0.000	0.000	0.000	0.010	my5651.cy8
0.000	0.000	99.844	0.153	0.003	0.000	0.000	0.000	0.000	0.000	0.018	my5739.cy8
0.000	0.000	99.733	0.240	0.026	0.000	0.000	0.000	0.000	0.000	0.030	my8031.cy8
0.000	0.000	99.974	0.026	0.000	0.000	0.000	0.000	0.000	0.000	0.014	fbmy5635.cay9c
0.000	0.000	99.933	0.065	0.001	0.000	0.000	0.000	0.000	0.000	0.016	fbmy8028.cay9c