Introduction
This is a report for the insert benchmark with 20M docs and 1 client(s). It is generated by scripts (bash, awk, sed) and Tufte might not be impressed. An overview of the insert benchmark is here and a short update is here. Below, by DBMS, I mean DBMS+version.config. An example is my8020.c10b40 where my means MySQL, 8020 is version 8.0.20 and c10b40 is the name for the configuration file.
The test server is an c6i.2xl with 4 cores, 4 HW threads (hyperthread disabled), 16G RAM and io2 storage (256G, 10K IOPs). The benchmark was run with 1 clients and there was 1 or 2 connections per client (1 for queries, 1 for inserts). The benchmark loads 20M rows without secondary indexes, creates secondary indexes, loads another 20M rows then does 3 read+write tests for one hour each that do queries as fast as possible with 100, 500 and then 1000 writes/second/client concurrent with the queries. The database is cached by the storage engine and the only IO is for writes. Clients and the DBMS share one server. The per-database configs are in the per-database subdirectories here.
The tested DBMS are:
- my8031.cy8 - MySQL 8.0.31 with InnoDB and the cy8 config
- fbmy8028.cy9c - FB MySQL 8.0.28 with MyRocks and the cy9c config
- pg151.cx7 - Postgres 15.1 and the cx7 config
Contents
- Summary
- l.i0: load without secondary indexes
- l.x: create secondary indexes
- l.i1: continue load after secondary indexes created
- q100.1: range queries with 100 insert/s per client
- q500.1: range queries with 500 insert/s per client
- q1000.1: range queries with 1000 insert/s per client
Summary
The numbers are inserts/s for l.i0 and l.i1, indexed docs (or rows) /s for l.x and queries/s for q*.2. The values are the average rate over the entire test for inserts (IPS) and queries (QPS). The range of values for IPS and QPS is split into 3 parts: bottom 25%, middle 50%, top 25%. Values in the bottom 25% have a red background, values in the top 25% have a green background and values in the middle have no color. A gray background is used for values that can be ignored because the DBMS did not sustain the target insert rate. Red backgrounds are not used when the minimum value is within 80% of the max value.
| dbms | l.i0 | l.x | l.i1 | q100.1 | q500.1 | q1000.1 |
|---|---|---|---|---|---|---|
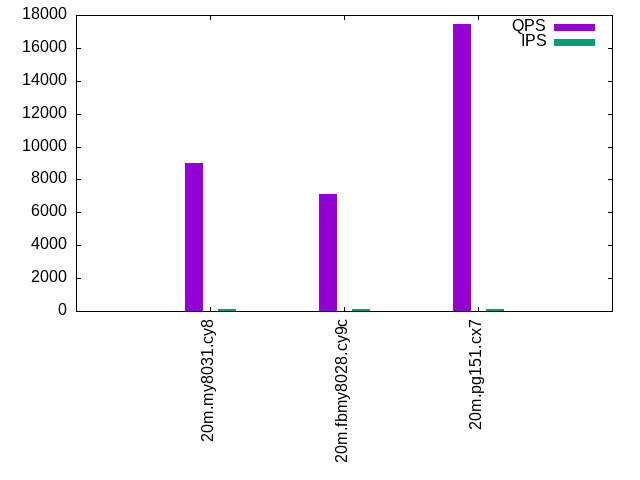
| 20m.my8031.cy8 | 131579 | 121084 | 41841 | 8979 | 8986 | 8891 |
| 20m.fbmy8028.cy9c | 128205 | 119643 | 51948 | 7119 | 6986 | 6954 |
| 20m.pg151.cx7 | 163934 | 446667 | 51680 | 17427 | 17368 | 17325 |
This lists the average rate of inserts/s for the tests that do inserts concurrent with queries. For such tests the query rate is listed in the table above. The read+write tests are setup so that the insert rate should match the target rate every second. Cells that are not at least 95% of the target have a red background to indicate a failure to satisfy the target.
| dbms | q100.1 | q500.1 | q1000.1 |
|---|---|---|---|
| my8031.cy8 | 100 | 499 | 999 |
| fbmy8028.cy9c | 100 | 500 | 999 |
| pg151.cx7 | 100 | 500 | 999 |
| target | 100 | 500 | 1000 |
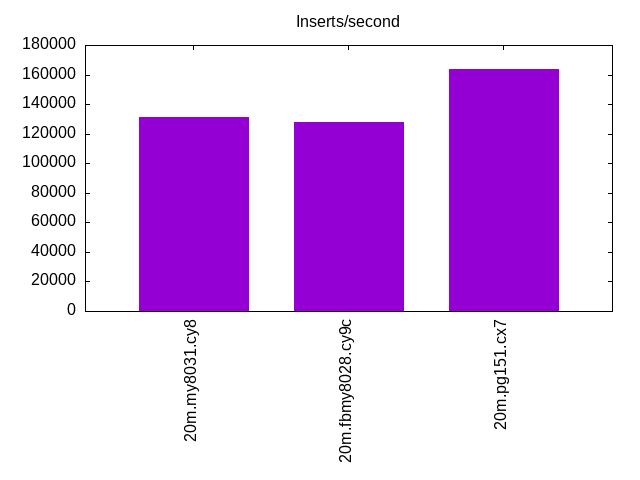
l.i0
l.i0: load without secondary indexes. Graphs for performance per 1-second interval are here.
Average throughput:
Insert response time histogram: each cell has the percentage of responses that take <= the time in the header and max is the max response time in seconds. For the max column values in the top 25% of the range have a red background and in the bottom 25% of the range have a green background. The red background is not used when the min value is within 80% of the max value.
| dbms | 256us | 1ms | 4ms | 16ms | 64ms | 256ms | 1s | 4s | 16s | gt | max |
|---|---|---|---|---|---|---|---|---|---|---|---|
| my8031.cy8 | 99.623 | 0.189 | 0.184 | 0.004 | 0.001 | 0.096 | |||||
| fbmy8028.cy9c | 98.772 | 1.213 | 0.011 | 0.004 | 0.057 | ||||||
| pg151.cx7 | 99.909 | 0.091 | 0.002 |
Performance metrics for the DBMS listed above. Some are normalized by throughput, others are not. Legend for results is here.
ips	qps	rps	rmbps	wps	wmbps	rpq	rkbpq	wpi	wkbpi	csps	cpups	cspq	cpupq	dbgb1	dbgb2	rss	maxop	p50	p99	tag
131579	0	0	0.0	670.0	45.1	0.000	0.000	0.005	0.351	14734	36.4	0.112	11	1.3	3.8	2.5	0.096	132059	115277	20m.my8031.cy8
128205	0	0	0.0	123.5	25.1	0.000	0.000	0.001	0.201	13107	39.3	0.102	12	0.7	1.9	0.6	0.057	129897	118573	20m.fbmy8028.cy9c
163934	0	0	0.0	299.5	68.9	0.000	0.000	0.002	0.431	18896	39.9	0.115	10	1.9	5.2	0.0	0.002	164125	154439	20m.pg151.cx7
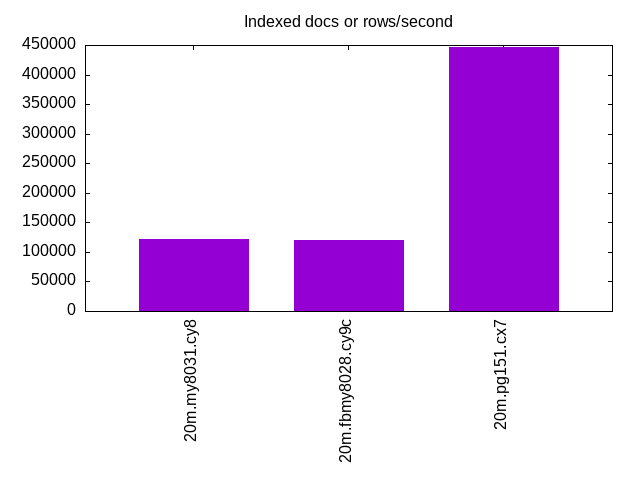
l.x
l.x: create secondary indexes.
Average throughput:
Performance metrics for the DBMS listed above. Some are normalized by throughput, others are not. Legend for results is here.
ips	qps	rps	rmbps	wps	wmbps	rpq	rkbpq	wpi	wkbpi	csps	cpups	cspq	cpupq	dbgb1	dbgb2	rss	maxop	p50	p99	tag
121084	0	626	42.0	2514.1	128.4	0.005	0.355	0.021	1.086	8547	43.4	0.071	14	3.0	5.4	3.9	0.009	NA	NA	20m.my8031.cy8
119643	0	0	0.0	79.7	18.0	0.000	0.000	0.001	0.154	585	24.5	0.005	8	1.4	2.7	1.9	0.002	NA	NA	20m.fbmy8028.cy9c
446667	0	0	0.0	342.8	83.3	0.000	0.000	0.001	0.191	1311	24.0	0.003	2	3.7	8.6	0.0	0.001	NA	NA	20m.pg151.cx7
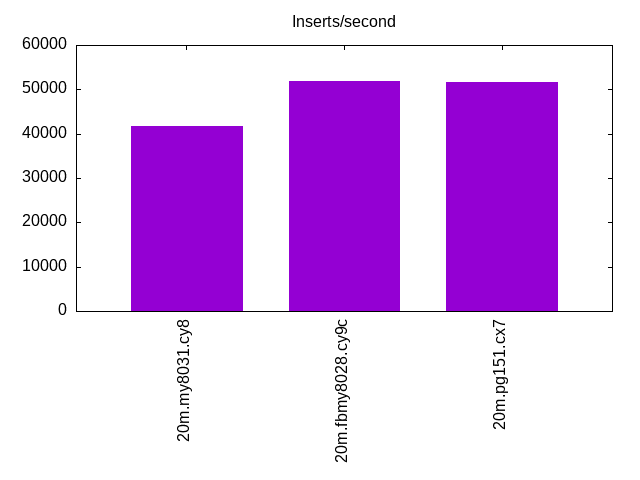
l.i1
l.i1: continue load after secondary indexes created. Graphs for performance per 1-second interval are here.
Average throughput:
Insert response time histogram: each cell has the percentage of responses that take <= the time in the header and max is the max response time in seconds. For the max column values in the top 25% of the range have a red background and in the bottom 25% of the range have a green background. The red background is not used when the min value is within 80% of the max value.
| dbms | 256us | 1ms | 4ms | 16ms | 64ms | 256ms | 1s | 4s | 16s | gt | max |
|---|---|---|---|---|---|---|---|---|---|---|---|
| my8031.cy8 | 1.913 | 97.581 | 0.357 | 0.104 | 0.043 | 0.001 | 0.361 | ||||
| fbmy8028.cy9c | 81.800 | 18.157 | 0.040 | 0.003 | 0.034 | ||||||
| pg151.cx7 | 84.478 | 15.502 | 0.009 | 0.011 | 0.049 |
Performance metrics for the DBMS listed above. Some are normalized by throughput, others are not. Legend for results is here.
ips	qps	rps	rmbps	wps	wmbps	rpq	rkbpq	wpi	wkbpi	csps	cpups	cspq	cpupq	dbgb1	dbgb2	rss	maxop	p50	p99	tag
41841	0	194	3.0	2786.3	94.8	0.005	0.074	0.067	2.321	17690	28.5	0.423	27	7.8	10.3	8.3	0.361	45751	499	20m.my8031.cy8
51948	0	16	1.9	259.4	58.7	0.000	0.038	0.005	1.158	10698	49.5	0.206	38	2.8	4.7	2.6	0.034	51459	43654	20m.fbmy8028.cy9c
51680	0	0	0.0	370.4	84.5	0.000	0.000	0.007	1.674	12839	30.7	0.248	24	8.2	23.9	0.0	0.049	52494	30068	20m.pg151.cx7
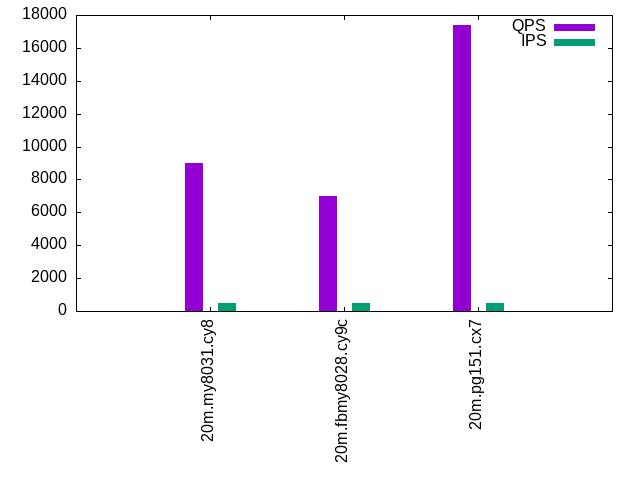
q100.1
q100.1: range queries with 100 insert/s per client. Graphs for performance per 1-second interval are here.
Average throughput:
Query response time histogram: each cell has the percentage of responses that take <= the time in the header and max is the max response time in seconds. For max values in the top 25% of the range have a red background and in the bottom 25% of the range have a green background. The red background is not used when the min value is within 80% of the max value.
| dbms | 256us | 1ms | 4ms | 16ms | 64ms | 256ms | 1s | 4s | 16s | gt | max |
|---|---|---|---|---|---|---|---|---|---|---|---|
| my8031.cy8 | 99.999 | 0.001 | nonzero | nonzero | 0.008 | ||||||
| fbmy8028.cy9c | 99.996 | 0.004 | nonzero | 0.003 | |||||||
| pg151.cx7 | 99.999 | 0.001 | nonzero | nonzero | 0.004 |
Insert response time histogram: each cell has the percentage of responses that take <= the time in the header and max is the max response time in seconds. For max values in the top 25% of the range have a red background and in the bottom 25% of the range have a green background. The red background is not used when the min value is within 80% of the max value.
| dbms | 256us | 1ms | 4ms | 16ms | 64ms | 256ms | 1s | 4s | 16s | gt | max |
|---|---|---|---|---|---|---|---|---|---|---|---|
| my8031.cy8 | 99.306 | 0.694 | 0.010 | ||||||||
| fbmy8028.cy9c | 8.083 | 91.917 | 0.002 | ||||||||
| pg151.cx7 | 99.986 | 0.014 | 0.004 |
Performance metrics for the DBMS listed above. Some are normalized by throughput, others are not. Legend for results is here.
ips	qps	rps	rmbps	wps	wmbps	rpq	rkbpq	wpi	wkbpi	csps	cpups	cspq	cpupq	dbgb1	dbgb2	rss	maxop	p50	p99	tag
100	8979	0	0.0	125.0	3.0	0.000	0.000	1.252	31.199	35039	24.5	3.902	109	8.0	10.5	8.5	0.008	8982	8809	20m.my8031.cy8
100	7119	0	0.0	3.3	0.1	0.000	0.000	0.033	0.586	27428	24.9	3.853	140	2.8	4.8	4.3	0.003	7098	6793	20m.fbmy8028.cy9c
100	17427	0	0.0	187.1	4.8	0.000	0.000	1.873	49.016	66695	23.0	3.827	53	8.2	18.7	0.0	0.004	17426	17246	20m.pg151.cx7
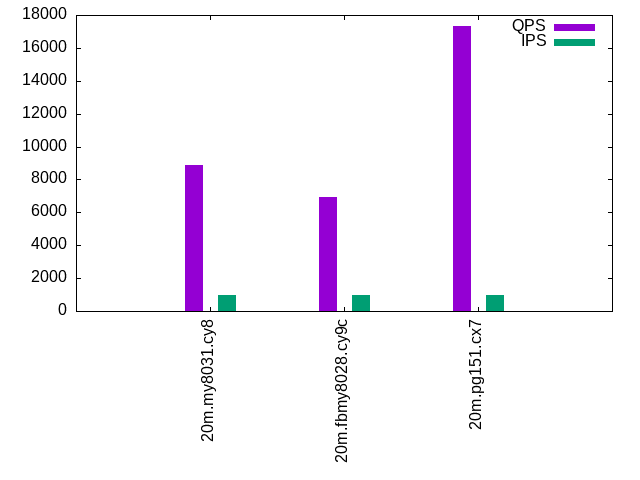
q500.1
q500.1: range queries with 500 insert/s per client. Graphs for performance per 1-second interval are here.
Average throughput:
Query response time histogram: each cell has the percentage of responses that take <= the time in the header and max is the max response time in seconds. For max values in the top 25% of the range have a red background and in the bottom 25% of the range have a green background. The red background is not used when the min value is within 80% of the max value.
| dbms | 256us | 1ms | 4ms | 16ms | 64ms | 256ms | 1s | 4s | 16s | gt | max |
|---|---|---|---|---|---|---|---|---|---|---|---|
| my8031.cy8 | 99.996 | 0.002 | 0.002 | nonzero | 0.008 | ||||||
| fbmy8028.cy9c | 99.991 | 0.008 | 0.002 | nonzero | 0.006 | ||||||
| pg151.cx7 | 99.990 | 0.005 | 0.005 | nonzero | 0.005 |
Insert response time histogram: each cell has the percentage of responses that take <= the time in the header and max is the max response time in seconds. For max values in the top 25% of the range have a red background and in the bottom 25% of the range have a green background. The red background is not used when the min value is within 80% of the max value.
| dbms | 256us | 1ms | 4ms | 16ms | 64ms | 256ms | 1s | 4s | 16s | gt | max |
|---|---|---|---|---|---|---|---|---|---|---|---|
| my8031.cy8 | 99.544 | 0.456 | 0.010 | ||||||||
| fbmy8028.cy9c | 25.406 | 74.592 | 0.003 | 0.006 | |||||||
| pg151.cx7 | 99.997 | 0.003 | 0.005 |
Performance metrics for the DBMS listed above. Some are normalized by throughput, others are not. Legend for results is here.
ips	qps	rps	rmbps	wps	wmbps	rpq	rkbpq	wpi	wkbpi	csps	cpups	cspq	cpupq	dbgb1	dbgb2	rss	maxop	p50	p99	tag
499	8986	0	0.0	234.5	6.1	0.000	0.000	0.470	12.530	35464	24.7	3.947	110	8.7	11.1	9.1	0.008	8982	8838	20m.my8031.cy8
500	6986	0	0.0	4.4	0.3	0.000	0.000	0.009	0.712	26986	25.3	3.863	145	3.0	3.2	4.8	0.006	6985	6571	20m.fbmy8028.cy9c
500	17368	0	0.0	346.0	11.7	0.000	0.000	0.693	23.948	66592	23.3	3.834	54	8.7	13.1	0.0	0.005	17373	17170	20m.pg151.cx7
q1000.1
q1000.1: range queries with 1000 insert/s per client. Graphs for performance per 1-second interval are here.
Average throughput:
Query response time histogram: each cell has the percentage of responses that take <= the time in the header and max is the max response time in seconds. For max values in the top 25% of the range have a red background and in the bottom 25% of the range have a green background. The red background is not used when the min value is within 80% of the max value.
| dbms | 256us | 1ms | 4ms | 16ms | 64ms | 256ms | 1s | 4s | 16s | gt | max |
|---|---|---|---|---|---|---|---|---|---|---|---|
| my8031.cy8 | 99.991 | 0.005 | 0.004 | nonzero | 0.008 | ||||||
| fbmy8028.cy9c | 99.984 | 0.012 | 0.004 | nonzero | 0.011 | ||||||
| pg151.cx7 | 99.977 | 0.015 | 0.008 | 0.004 |
Insert response time histogram: each cell has the percentage of responses that take <= the time in the header and max is the max response time in seconds. For max values in the top 25% of the range have a red background and in the bottom 25% of the range have a green background. The red background is not used when the min value is within 80% of the max value.
| dbms | 256us | 1ms | 4ms | 16ms | 64ms | 256ms | 1s | 4s | 16s | gt | max |
|---|---|---|---|---|---|---|---|---|---|---|---|
| my8031.cy8 | 99.846 | 0.154 | 0.010 | ||||||||
| fbmy8028.cy9c | 37.168 | 62.831 | 0.001 | 0.011 | |||||||
| pg151.cx7 | 99.754 | 0.243 | 0.003 | 0.025 |
Performance metrics for the DBMS listed above. Some are normalized by throughput, others are not. Legend for results is here.
ips	qps	rps	rmbps	wps	wmbps	rpq	rkbpq	wpi	wkbpi	csps	cpups	cspq	cpupq	dbgb1	dbgb2	rss	maxop	p50	p99	tag
999	8891	0	0.0	373.7	9.7	0.000	0.000	0.374	9.906	35623	25.2	4.006	113	9.1	11.6	9.5	0.008	8889	8743	20m.my8031.cy8
999	6954	1	0.1	8.4	1.3	0.000	0.010	0.008	1.359	26964	26.0	3.878	150	3.3	3.9	7.8	0.011	6953	6537	20m.fbmy8028.cy9c
999	17325	7	0.1	426.2	17.3	0.000	0.004	0.427	17.703	66591	23.9	3.844	55	10.6	15.4	0.0	0.004	17325	17123	20m.pg151.cx7
l.i0
l.i0: load without secondary indexes
Performance metrics for all DBMS, not just the ones listed above. Some are normalized by throughput, others are not. Legend for results is here.
ips	qps	rps	rmbps	wps	wmbps	rpq	rkbpq	wpi	wkbpi	csps	cpups	cspq	cpupq	dbgb1	dbgb2	rss	maxop	p50	p99	tag
131579	0	0	0.0	670.0	45.1	0.000	0.000	0.005	0.351	14734	36.4	0.112	11	1.3	3.8	2.5	0.096	132059	115277	20m.my8031.cy8
128205	0	0	0.0	123.5	25.1	0.000	0.000	0.001	0.201	13107	39.3	0.102	12	0.7	1.9	0.6	0.057	129897	118573	20m.fbmy8028.cy9c
163934	0	0	0.0	299.5	68.9	0.000	0.000	0.002	0.431	18896	39.9	0.115	10	1.9	5.2	0.0	0.002	164125	154439	20m.pg151.cx7
l.x
l.x: create secondary indexes
Performance metrics for all DBMS, not just the ones listed above. Some are normalized by throughput, others are not. Legend for results is here.
ips	qps	rps	rmbps	wps	wmbps	rpq	rkbpq	wpi	wkbpi	csps	cpups	cspq	cpupq	dbgb1	dbgb2	rss	maxop	p50	p99	tag
121084	0	626	42.0	2514.1	128.4	0.005	0.355	0.021	1.086	8547	43.4	0.071	14	3.0	5.4	3.9	0.009	NA	NA	20m.my8031.cy8
119643	0	0	0.0	79.7	18.0	0.000	0.000	0.001	0.154	585	24.5	0.005	8	1.4	2.7	1.9	0.002	NA	NA	20m.fbmy8028.cy9c
446667	0	0	0.0	342.8	83.3	0.000	0.000	0.001	0.191	1311	24.0	0.003	2	3.7	8.6	0.0	0.001	NA	NA	20m.pg151.cx7
l.i1
l.i1: continue load after secondary indexes created
Performance metrics for all DBMS, not just the ones listed above. Some are normalized by throughput, others are not. Legend for results is here.
ips	qps	rps	rmbps	wps	wmbps	rpq	rkbpq	wpi	wkbpi	csps	cpups	cspq	cpupq	dbgb1	dbgb2	rss	maxop	p50	p99	tag
41841	0	194	3.0	2786.3	94.8	0.005	0.074	0.067	2.321	17690	28.5	0.423	27	7.8	10.3	8.3	0.361	45751	499	20m.my8031.cy8
51948	0	16	1.9	259.4	58.7	0.000	0.038	0.005	1.158	10698	49.5	0.206	38	2.8	4.7	2.6	0.034	51459	43654	20m.fbmy8028.cy9c
51680	0	0	0.0	370.4	84.5	0.000	0.000	0.007	1.674	12839	30.7	0.248	24	8.2	23.9	0.0	0.049	52494	30068	20m.pg151.cx7
q100.1
q100.1: range queries with 100 insert/s per client
Performance metrics for all DBMS, not just the ones listed above. Some are normalized by throughput, others are not. Legend for results is here.
ips	qps	rps	rmbps	wps	wmbps	rpq	rkbpq	wpi	wkbpi	csps	cpups	cspq	cpupq	dbgb1	dbgb2	rss	maxop	p50	p99	tag
100	8979	0	0.0	125.0	3.0	0.000	0.000	1.252	31.199	35039	24.5	3.902	109	8.0	10.5	8.5	0.008	8982	8809	20m.my8031.cy8
100	7119	0	0.0	3.3	0.1	0.000	0.000	0.033	0.586	27428	24.9	3.853	140	2.8	4.8	4.3	0.003	7098	6793	20m.fbmy8028.cy9c
100	17427	0	0.0	187.1	4.8	0.000	0.000	1.873	49.016	66695	23.0	3.827	53	8.2	18.7	0.0	0.004	17426	17246	20m.pg151.cx7
q500.1
q500.1: range queries with 500 insert/s per client
Performance metrics for all DBMS, not just the ones listed above. Some are normalized by throughput, others are not. Legend for results is here.
ips	qps	rps	rmbps	wps	wmbps	rpq	rkbpq	wpi	wkbpi	csps	cpups	cspq	cpupq	dbgb1	dbgb2	rss	maxop	p50	p99	tag
499	8986	0	0.0	234.5	6.1	0.000	0.000	0.470	12.530	35464	24.7	3.947	110	8.7	11.1	9.1	0.008	8982	8838	20m.my8031.cy8
500	6986	0	0.0	4.4	0.3	0.000	0.000	0.009	0.712	26986	25.3	3.863	145	3.0	3.2	4.8	0.006	6985	6571	20m.fbmy8028.cy9c
500	17368	0	0.0	346.0	11.7	0.000	0.000	0.693	23.948	66592	23.3	3.834	54	8.7	13.1	0.0	0.005	17373	17170	20m.pg151.cx7
q1000.1
q1000.1: range queries with 1000 insert/s per client
Performance metrics for all DBMS, not just the ones listed above. Some are normalized by throughput, others are not. Legend for results is here.
ips	qps	rps	rmbps	wps	wmbps	rpq	rkbpq	wpi	wkbpi	csps	cpups	cspq	cpupq	dbgb1	dbgb2	rss	maxop	p50	p99	tag
999	8891	0	0.0	373.7	9.7	0.000	0.000	0.374	9.906	35623	25.2	4.006	113	9.1	11.6	9.5	0.008	8889	8743	20m.my8031.cy8
999	6954	1	0.1	8.4	1.3	0.000	0.010	0.008	1.359	26964	26.0	3.878	150	3.3	3.9	7.8	0.011	6953	6537	20m.fbmy8028.cy9c
999	17325	7	0.1	426.2	17.3	0.000	0.004	0.427	17.703	66591	23.9	3.844	55	10.6	15.4	0.0	0.004	17325	17123	20m.pg151.cx7
l.i0
- l.i0: load without secondary indexes
- Legend for results is here.
- Each entry lists the percentage of responses that fit in that bucket (slower than max time for previous bucket, faster than min time for next bucket).
Insert response time histogram
256us	1ms	4ms	16ms	64ms	256ms	1s	4s	16s	gt	max	tag
0.000	99.623	0.189	0.184	0.004	0.001	0.000	0.000	0.000	0.000	0.096	my8031.cy8
0.000	98.772	1.213	0.011	0.004	0.000	0.000	0.000	0.000	0.000	0.057	fbmy8028.cy9c
0.000	99.909	0.091	0.000	0.000	0.000	0.000	0.000	0.000	0.000	0.002	pg151.cx7
l.x
- l.x: create secondary indexes
- Legend for results is here.
- Each entry lists the percentage of responses that fit in that bucket (slower than max time for previous bucket, faster than min time for next bucket).
TODO - determine whether there is data for create index response time
l.i1
- l.i1: continue load after secondary indexes created
- Legend for results is here.
- Each entry lists the percentage of responses that fit in that bucket (slower than max time for previous bucket, faster than min time for next bucket).
Insert response time histogram
256us	1ms	4ms	16ms	64ms	256ms	1s	4s	16s	gt	max	tag
0.000	1.913	97.581	0.357	0.104	0.043	0.001	0.000	0.000	0.000	0.361	my8031.cy8
0.000	81.800	18.157	0.040	0.003	0.000	0.000	0.000	0.000	0.000	0.034	fbmy8028.cy9c
0.000	84.478	15.502	0.009	0.011	0.000	0.000	0.000	0.000	0.000	0.049	pg151.cx7
q100.1
- q100.1: range queries with 100 insert/s per client
- Legend for results is here.
- Each entry lists the percentage of responses that fit in that bucket (slower than max time for previous bucket, faster than min time for next bucket).
Query response time histogram
256us	1ms	4ms	16ms	64ms	256ms	1s	4s	16s	gt	max	tag
99.999	0.001	nonzero	nonzero	0.000	0.000	0.000	0.000	0.000	0.000	0.008	my8031.cy8
99.996	0.004	nonzero	0.000	0.000	0.000	0.000	0.000	0.000	0.000	0.003	fbmy8028.cy9c
99.999	0.001	nonzero	nonzero	0.000	0.000	0.000	0.000	0.000	0.000	0.004	pg151.cx7
Insert response time histogram
256us	1ms	4ms	16ms	64ms	256ms	1s	4s	16s	gt	max	tag
0.000	0.000	99.306	0.694	0.000	0.000	0.000	0.000	0.000	0.000	0.010	my8031.cy8
0.000	8.083	91.917	0.000	0.000	0.000	0.000	0.000	0.000	0.000	0.002	fbmy8028.cy9c
0.000	0.000	99.986	0.014	0.000	0.000	0.000	0.000	0.000	0.000	0.004	pg151.cx7
q500.1
- q500.1: range queries with 500 insert/s per client
- Legend for results is here.
- Each entry lists the percentage of responses that fit in that bucket (slower than max time for previous bucket, faster than min time for next bucket).
Query response time histogram
256us	1ms	4ms	16ms	64ms	256ms	1s	4s	16s	gt	max	tag
99.996	0.002	0.002	nonzero	0.000	0.000	0.000	0.000	0.000	0.000	0.008	my8031.cy8
99.991	0.008	0.002	nonzero	0.000	0.000	0.000	0.000	0.000	0.000	0.006	fbmy8028.cy9c
99.990	0.005	0.005	nonzero	0.000	0.000	0.000	0.000	0.000	0.000	0.005	pg151.cx7
Insert response time histogram
256us	1ms	4ms	16ms	64ms	256ms	1s	4s	16s	gt	max	tag
0.000	0.000	99.544	0.456	0.000	0.000	0.000	0.000	0.000	0.000	0.010	my8031.cy8
0.000	25.406	74.592	0.003	0.000	0.000	0.000	0.000	0.000	0.000	0.006	fbmy8028.cy9c
0.000	0.000	99.997	0.003	0.000	0.000	0.000	0.000	0.000	0.000	0.005	pg151.cx7
q1000.1
- q1000.1: range queries with 1000 insert/s per client
- Legend for results is here.
- Each entry lists the percentage of responses that fit in that bucket (slower than max time for previous bucket, faster than min time for next bucket).
Query response time histogram
256us	1ms	4ms	16ms	64ms	256ms	1s	4s	16s	gt	max	tag
99.991	0.005	0.004	nonzero	0.000	0.000	0.000	0.000	0.000	0.000	0.008	my8031.cy8
99.984	0.012	0.004	nonzero	0.000	0.000	0.000	0.000	0.000	0.000	0.011	fbmy8028.cy9c
99.977	0.015	0.008	0.000	0.000	0.000	0.000	0.000	0.000	0.000	0.004	pg151.cx7
Insert response time histogram
256us	1ms	4ms	16ms	64ms	256ms	1s	4s	16s	gt	max	tag
0.000	0.000	99.846	0.154	0.000	0.000	0.000	0.000	0.000	0.000	0.010	my8031.cy8
0.000	37.168	62.831	0.001	0.000	0.000	0.000	0.000	0.000	0.000	0.011	fbmy8028.cy9c
0.000	0.000	99.754	0.243	0.003	0.000	0.000	0.000	0.000	0.000	0.025	pg151.cx7