Introduction
This is a report for the insert benchmark with 100M docs and 8 client(s). It is generated by scripts (bash, awk, sed) and Tufte might not be impressed. An overview of the insert benchmark is here and a short update is here. Below, by DBMS, I mean DBMS+version.config. An example is my8020.c10b40 where my means MySQL, 8020 is version 8.0.20 and c10b40 is the name for the configuration file.
The test server is an c7g.8xl with 32 cores, 64G RAM and io2 storage (2T, 50K IOPs). The benchmark was run with 8 clients and there was 1 or 2 connections per client (1 for queries, 1 for inserts). The benchmark loads 75M rows without secondary indexes, creates secondary indexes, loads another 25M rows then does 3 read+write tests for one hour each that do queries as fast as possible with 100, 500 and then 1000 writes/second/client concurrent with the queries. The database is cached by the storage engine and the only IO is for writes. Clients and the DBMS share one server. The per-database configs are in the per-database subdirectories here.
The tested DBMS are:
- my8031.cy8_c32r64_50kio - MySQL 8.0.31 with InnoDB and the cy8_c32r64_50kio config
- fbmy8028.cy9c_c32r64_50kio - FB MySQL 8.0.28 with MyRocks and the cy9c_c32r64_50kio config
- pg151.cx7_c32r64_50kio - Postgres 15.1 and the cx7_c32r64_50kio config
Contents
- Summary
- l.i0: load without secondary indexes
- l.x: create secondary indexes
- l.i1: continue load after secondary indexes created
- q100.1: range queries with 100 insert/s per client
- q500.1: range queries with 500 insert/s per client
- q1000.1: range queries with 1000 insert/s per client
Summary
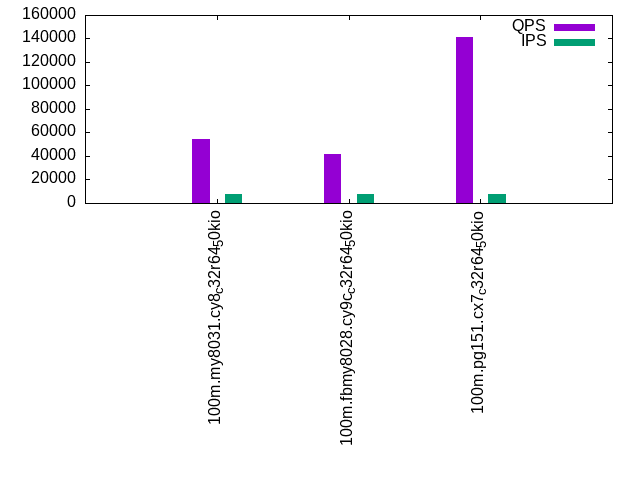
The numbers are inserts/s for l.i0 and l.i1, indexed docs (or rows) /s for l.x and queries/s for q*.2. The values are the average rate over the entire test for inserts (IPS) and queries (QPS). The range of values for IPS and QPS is split into 3 parts: bottom 25%, middle 50%, top 25%. Values in the bottom 25% have a red background, values in the top 25% have a green background and values in the middle have no color. A gray background is used for values that can be ignored because the DBMS did not sustain the target insert rate. Red backgrounds are not used when the minimum value is within 80% of the max value.
| dbms | l.i0 | l.x | l.i1 | q100.1 | q500.1 | q1000.1 |
|---|---|---|---|---|---|---|
| 100m.my8031.cy8_c32r64_50kio | 700934 | 798936 | 227273 | 54686 | 54251 | 54107 |
| 100m.fbmy8028.cy9c_c32r64_50kio | 500000 | 695370 | 211864 | 42392 | 42153 | 41685 |
| 100m.pg151.cx7_c32r64_50kio | 882353 | 2422581 | 320513 | 143022 | 141187 | 140864 |
This lists the average rate of inserts/s for the tests that do inserts concurrent with queries. For such tests the query rate is listed in the table above. The read+write tests are setup so that the insert rate should match the target rate every second. Cells that are not at least 95% of the target have a red background to indicate a failure to satisfy the target.
| dbms | q100.1 | q500.1 | q1000.1 |
|---|---|---|---|
| my8031.cy8_c32r64_50kio | 798 | 3989 | 7976 |
| fbmy8028.cy9c_c32r64_50kio | 798 | 3988 | 7978 |
| pg151.cx7_c32r64_50kio | 798 | 3988 | 7976 |
| target | 800 | 4000 | 8000 |
l.i0
l.i0: load without secondary indexes. Graphs for performance per 1-second interval are here.
Average throughput:

Insert response time histogram: each cell has the percentage of responses that take <= the time in the header and max is the max response time in seconds. For the max column values in the top 25% of the range have a red background and in the bottom 25% of the range have a green background. The red background is not used when the min value is within 80% of the max value.
| dbms | 256us | 1ms | 4ms | 16ms | 64ms | 256ms | 1s | 4s | 16s | gt | max |
|---|---|---|---|---|---|---|---|---|---|---|---|
| my8031.cy8_c32r64_50kio | 98.480 | 1.326 | 0.166 | 0.025 | 0.003 | 0.069 | |||||
| fbmy8028.cy9c_c32r64_50kio | 15.813 | 84.156 | 0.004 | 0.027 | 0.055 | ||||||
| pg151.cx7_c32r64_50kio | 99.970 | 0.030 | 0.003 |
Performance metrics for the DBMS listed above. Some are normalized by throughput, others are not. Legend for results is here.
ips	qps	rps	rmbps	wps	wmbps	rpq	rkbpq	wpi	wkbpi	csps	cpups	cspq	cpupq	dbgb1	dbgb2	rss	maxop	p50	p99	tag
700934	0	0	0.0	1091.6	183.2	0.000	0.000	0.002	0.268	103558	32.5	0.148	15	5.0	101.6	9.4	0.069	104589	71523	100m.my8031.cy8_c32r64_50kio
500000	0	0	0.0	801.9	182.7	0.000	0.000	0.002	0.374	64213	30.5	0.128	20	2.5	3.2	1.4	0.055	69325	32066	100m.fbmy8028.cy9c_c32r64_50kio
882353	0	0	0.0	1643.8	377.9	0.000	0.000	0.002	0.439	108525	32.9	0.123	12	7.2	19.4	0.0	0.003	137653	67628	100m.pg151.cx7_c32r64_50kio
l.x
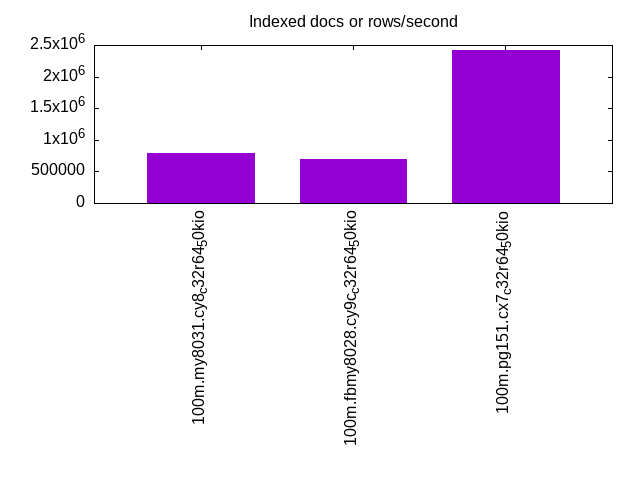
l.x: create secondary indexes.
Average throughput:
Performance metrics for the DBMS listed above. Some are normalized by throughput, others are not. Legend for results is here.
ips	qps	rps	rmbps	wps	wmbps	rpq	rkbpq	wpi	wkbpi	csps	cpups	cspq	cpupq	dbgb1	dbgb2	rss	maxop	p50	p99	tag
798936	0	4438	291.6	15781.5	783.9	0.006	0.374	0.020	1.005	76958	18.2	0.096	7	11.1	107.7	14.0	0.002	NA	NA	100m.my8031.cy8_c32r64_50kio
695370	0	2	0.1	580.3	132.0	0.000	0.000	0.001	0.194	4511	22.7	0.006	10	5.0	5.7	8.0	0.002	NA	NA	100m.fbmy8028.cy9c_c32r64_50kio
2422581	0	0	0.0	2507.7	612.0	0.000	0.000	0.001	0.259	30657	18.0	0.013	2	13.8	32.1	5.9	0.003	NA	NA	100m.pg151.cx7_c32r64_50kio
l.i1
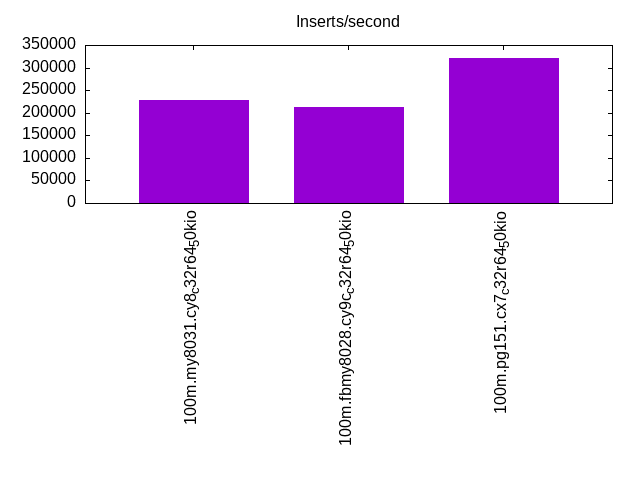
l.i1: continue load after secondary indexes created. Graphs for performance per 1-second interval are here.
Average throughput:
Insert response time histogram: each cell has the percentage of responses that take <= the time in the header and max is the max response time in seconds. For the max column values in the top 25% of the range have a red background and in the bottom 25% of the range have a green background. The red background is not used when the min value is within 80% of the max value.
| dbms | 256us | 1ms | 4ms | 16ms | 64ms | 256ms | 1s | 4s | 16s | gt | max |
|---|---|---|---|---|---|---|---|---|---|---|---|
| my8031.cy8_c32r64_50kio | 99.075 | 0.497 | 0.303 | 0.124 | 0.126 | ||||||
| fbmy8028.cy9c_c32r64_50kio | 1.214 | 98.750 | 0.022 | 0.014 | 0.063 | ||||||
| pg151.cx7_c32r64_50kio | 9.535 | 90.458 | 0.006 | 0.012 |
Performance metrics for the DBMS listed above. Some are normalized by throughput, others are not. Legend for results is here.
ips	qps	rps	rmbps	wps	wmbps	rpq	rkbpq	wpi	wkbpi	csps	cpups	cspq	cpupq	dbgb1	dbgb2	rss	maxop	p50	p99	tag
227273	0	3124	48.8	1863.4	209.8	0.014	0.220	0.008	0.945	96473	26.2	0.424	37	18.9	115.4	21.6	0.126	35412	400	100m.my8031.cy8_c32r64_50kio
211864	0	191	23.7	1106.8	251.1	0.001	0.115	0.005	1.214	69908	29.0	0.330	44	10.2	12.1	9.0	0.063	27671	699	100m.fbmy8028.cy9c_c32r64_50kio
320513	0	0	0.0	1952.8	445.2	0.000	0.000	0.006	1.422	84278	28.6	0.263	29	22.8	53.2	0.0	0.012	46900	23375	100m.pg151.cx7_c32r64_50kio
q100.1
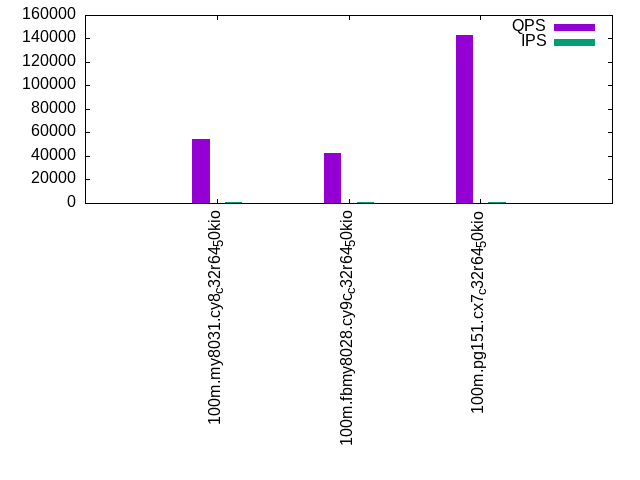
q100.1: range queries with 100 insert/s per client. Graphs for performance per 1-second interval are here.
Average throughput:
Query response time histogram: each cell has the percentage of responses that take <= the time in the header and max is the max response time in seconds. For max values in the top 25% of the range have a red background and in the bottom 25% of the range have a green background. The red background is not used when the min value is within 80% of the max value.
| dbms | 256us | 1ms | 4ms | 16ms | 64ms | 256ms | 1s | 4s | 16s | gt | max |
|---|---|---|---|---|---|---|---|---|---|---|---|
| my8031.cy8_c32r64_50kio | 99.999 | 0.001 | nonzero | nonzero | 0.024 | ||||||
| fbmy8028.cy9c_c32r64_50kio | 99.988 | 0.012 | nonzero | nonzero | nonzero | 0.024 | |||||
| pg151.cx7_c32r64_50kio | 99.999 | 0.001 | nonzero | nonzero | 0.009 |
Insert response time histogram: each cell has the percentage of responses that take <= the time in the header and max is the max response time in seconds. For max values in the top 25% of the range have a red background and in the bottom 25% of the range have a green background. The red background is not used when the min value is within 80% of the max value.
| dbms | 256us | 1ms | 4ms | 16ms | 64ms | 256ms | 1s | 4s | 16s | gt | max |
|---|---|---|---|---|---|---|---|---|---|---|---|
| my8031.cy8_c32r64_50kio | 99.903 | 0.097 | 0.011 | ||||||||
| fbmy8028.cy9c_c32r64_50kio | 11.490 | 88.503 | 0.007 | 0.008 | |||||||
| pg151.cx7_c32r64_50kio | 99.658 | 0.328 | 0.014 | 0.019 |
Performance metrics for the DBMS listed above. Some are normalized by throughput, others are not. Legend for results is here.
ips	qps	rps	rmbps	wps	wmbps	rpq	rkbpq	wpi	wkbpi	csps	cpups	cspq	cpupq	dbgb1	dbgb2	rss	maxop	p50	p99	tag
798	54686	0	0.0	276.0	7.7	0.000	0.000	0.346	9.934	210722	25.0	3.853	146	19.1	115.6	21.8	0.024	7033	6617	100m.my8031.cy8_c32r64_50kio
798	42392	1	0.0	15.1	2.9	0.000	0.000	0.019	3.707	162471	25.4	3.833	192	7.2	7.5	19.5	0.024	5242	4795	100m.fbmy8028.cy9c_c32r64_50kio
798	143022	0	0.0	1098.1	28.4	0.000	0.000	1.377	36.424	546584	25.0	3.822	56	23.1	49.1	0.0	0.009	18972	18412	100m.pg151.cx7_c32r64_50kio
q500.1
q500.1: range queries with 500 insert/s per client. Graphs for performance per 1-second interval are here.
Average throughput:
Query response time histogram: each cell has the percentage of responses that take <= the time in the header and max is the max response time in seconds. For max values in the top 25% of the range have a red background and in the bottom 25% of the range have a green background. The red background is not used when the min value is within 80% of the max value.
| dbms | 256us | 1ms | 4ms | 16ms | 64ms | 256ms | 1s | 4s | 16s | gt | max |
|---|---|---|---|---|---|---|---|---|---|---|---|
| my8031.cy8_c32r64_50kio | 99.994 | 0.006 | nonzero | nonzero | 0.005 | ||||||
| fbmy8028.cy9c_c32r64_50kio | 99.981 | 0.019 | nonzero | nonzero | 0.013 | ||||||
| pg151.cx7_c32r64_50kio | 99.998 | 0.002 | nonzero | nonzero | 0.010 |
Insert response time histogram: each cell has the percentage of responses that take <= the time in the header and max is the max response time in seconds. For max values in the top 25% of the range have a red background and in the bottom 25% of the range have a green background. The red background is not used when the min value is within 80% of the max value.
| dbms | 256us | 1ms | 4ms | 16ms | 64ms | 256ms | 1s | 4s | 16s | gt | max |
|---|---|---|---|---|---|---|---|---|---|---|---|
| my8031.cy8_c32r64_50kio | 99.900 | 0.100 | 0.009 | ||||||||
| fbmy8028.cy9c_c32r64_50kio | 4.937 | 95.044 | 0.019 | 0.014 | |||||||
| pg151.cx7_c32r64_50kio | nonzero | 95.204 | 4.793 | 0.003 | 0.019 |
Performance metrics for the DBMS listed above. Some are normalized by throughput, others are not. Legend for results is here.
ips	qps	rps	rmbps	wps	wmbps	rpq	rkbpq	wpi	wkbpi	csps	cpups	cspq	cpupq	dbgb1	dbgb2	rss	maxop	p50	p99	tag
3989	54251	0	0.0	39.8	2.3	0.000	0.000	0.010	0.597	209356	25.4	3.859	150	20.0	116.6	22.8	0.005	6793	6393	100m.my8031.cy8_c32r64_50kio
3988	42153	0	0.0	34.2	7.4	0.000	0.000	0.009	1.892	162646	26.1	3.858	198	8.2	10.3	34.8	0.013	5354	4923	100m.fbmy8028.cy9c_c32r64_50kio
3988	141187	0	0.0	1334.4	58.6	0.000	0.000	0.335	15.046	540896	25.2	3.831	57	24.5	43.2	0.0	0.010	17293	16079	100m.pg151.cx7_c32r64_50kio
q1000.1
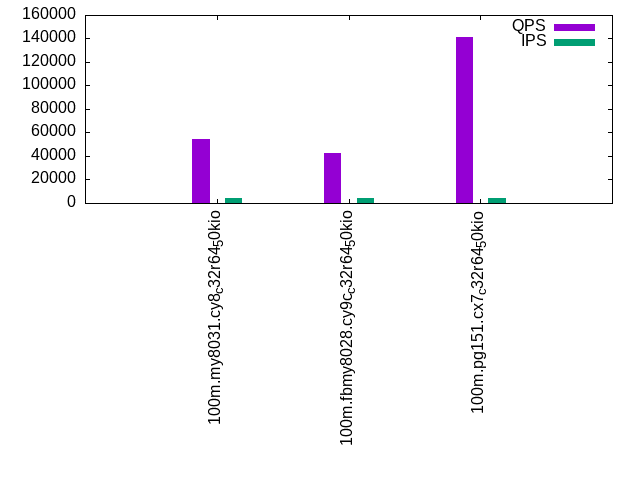
q1000.1: range queries with 1000 insert/s per client. Graphs for performance per 1-second interval are here.
Average throughput:
Query response time histogram: each cell has the percentage of responses that take <= the time in the header and max is the max response time in seconds. For max values in the top 25% of the range have a red background and in the bottom 25% of the range have a green background. The red background is not used when the min value is within 80% of the max value.
| dbms | 256us | 1ms | 4ms | 16ms | 64ms | 256ms | 1s | 4s | 16s | gt | max |
|---|---|---|---|---|---|---|---|---|---|---|---|
| my8031.cy8_c32r64_50kio | 99.985 | 0.014 | 0.001 | nonzero | 0.005 | ||||||
| fbmy8028.cy9c_c32r64_50kio | 99.958 | 0.041 | 0.001 | nonzero | nonzero | 0.035 | |||||
| pg151.cx7_c32r64_50kio | 99.995 | 0.004 | 0.001 | nonzero | 0.011 |
Insert response time histogram: each cell has the percentage of responses that take <= the time in the header and max is the max response time in seconds. For max values in the top 25% of the range have a red background and in the bottom 25% of the range have a green background. The red background is not used when the min value is within 80% of the max value.
| dbms | 256us | 1ms | 4ms | 16ms | 64ms | 256ms | 1s | 4s | 16s | gt | max |
|---|---|---|---|---|---|---|---|---|---|---|---|
| my8031.cy8_c32r64_50kio | 99.719 | 0.281 | 0.013 | ||||||||
| fbmy8028.cy9c_c32r64_50kio | 1.209 | 98.774 | 0.017 | 0.014 | |||||||
| pg151.cx7_c32r64_50kio | 0.002 | 94.165 | 5.832 | 0.001 | 0.019 |
Performance metrics for the DBMS listed above. Some are normalized by throughput, others are not. Legend for results is here.
ips	qps	rps	rmbps	wps	wmbps	rpq	rkbpq	wpi	wkbpi	csps	cpups	cspq	cpupq	dbgb1	dbgb2	rss	maxop	p50	p99	tag
7976	54107	0	0.0	294.7	12.4	0.000	0.000	0.037	1.595	211427	26.1	3.908	154	26.0	122.6	28.2	0.005	6761	6393	100m.my8031.cy8_c32r64_50kio
7978	41685	12	1.4	68.4	15.1	0.000	0.035	0.009	1.937	162463	26.5	3.897	203	10.4	12.2	44.9	0.035	5194	4763	100m.fbmy8028.cy9c_c32r64_50kio
7976	140864	0	0.0	1105.6	80.2	0.000	0.000	0.139	10.291	540992	25.4	3.841	58	27.8	53.4	0.0	0.011	17869	17038	100m.pg151.cx7_c32r64_50kio
l.i0
l.i0: load without secondary indexes
Performance metrics for all DBMS, not just the ones listed above. Some are normalized by throughput, others are not. Legend for results is here.
ips	qps	rps	rmbps	wps	wmbps	rpq	rkbpq	wpi	wkbpi	csps	cpups	cspq	cpupq	dbgb1	dbgb2	rss	maxop	p50	p99	tag
700934	0	0	0.0	1091.6	183.2	0.000	0.000	0.002	0.268	103558	32.5	0.148	15	5.0	101.6	9.4	0.069	104589	71523	100m.my8031.cy8_c32r64_50kio
500000	0	0	0.0	801.9	182.7	0.000	0.000	0.002	0.374	64213	30.5	0.128	20	2.5	3.2	1.4	0.055	69325	32066	100m.fbmy8028.cy9c_c32r64_50kio
882353	0	0	0.0	1643.8	377.9	0.000	0.000	0.002	0.439	108525	32.9	0.123	12	7.2	19.4	0.0	0.003	137653	67628	100m.pg151.cx7_c32r64_50kio
l.x
l.x: create secondary indexes
Performance metrics for all DBMS, not just the ones listed above. Some are normalized by throughput, others are not. Legend for results is here.
ips	qps	rps	rmbps	wps	wmbps	rpq	rkbpq	wpi	wkbpi	csps	cpups	cspq	cpupq	dbgb1	dbgb2	rss	maxop	p50	p99	tag
798936	0	4438	291.6	15781.5	783.9	0.006	0.374	0.020	1.005	76958	18.2	0.096	7	11.1	107.7	14.0	0.002	NA	NA	100m.my8031.cy8_c32r64_50kio
695370	0	2	0.1	580.3	132.0	0.000	0.000	0.001	0.194	4511	22.7	0.006	10	5.0	5.7	8.0	0.002	NA	NA	100m.fbmy8028.cy9c_c32r64_50kio
2422581	0	0	0.0	2507.7	612.0	0.000	0.000	0.001	0.259	30657	18.0	0.013	2	13.8	32.1	5.9	0.003	NA	NA	100m.pg151.cx7_c32r64_50kio
l.i1
l.i1: continue load after secondary indexes created
Performance metrics for all DBMS, not just the ones listed above. Some are normalized by throughput, others are not. Legend for results is here.
ips	qps	rps	rmbps	wps	wmbps	rpq	rkbpq	wpi	wkbpi	csps	cpups	cspq	cpupq	dbgb1	dbgb2	rss	maxop	p50	p99	tag
227273	0	3124	48.8	1863.4	209.8	0.014	0.220	0.008	0.945	96473	26.2	0.424	37	18.9	115.4	21.6	0.126	35412	400	100m.my8031.cy8_c32r64_50kio
211864	0	191	23.7	1106.8	251.1	0.001	0.115	0.005	1.214	69908	29.0	0.330	44	10.2	12.1	9.0	0.063	27671	699	100m.fbmy8028.cy9c_c32r64_50kio
320513	0	0	0.0	1952.8	445.2	0.000	0.000	0.006	1.422	84278	28.6	0.263	29	22.8	53.2	0.0	0.012	46900	23375	100m.pg151.cx7_c32r64_50kio
q100.1
q100.1: range queries with 100 insert/s per client
Performance metrics for all DBMS, not just the ones listed above. Some are normalized by throughput, others are not. Legend for results is here.
ips	qps	rps	rmbps	wps	wmbps	rpq	rkbpq	wpi	wkbpi	csps	cpups	cspq	cpupq	dbgb1	dbgb2	rss	maxop	p50	p99	tag
798	54686	0	0.0	276.0	7.7	0.000	0.000	0.346	9.934	210722	25.0	3.853	146	19.1	115.6	21.8	0.024	7033	6617	100m.my8031.cy8_c32r64_50kio
798	42392	1	0.0	15.1	2.9	0.000	0.000	0.019	3.707	162471	25.4	3.833	192	7.2	7.5	19.5	0.024	5242	4795	100m.fbmy8028.cy9c_c32r64_50kio
798	143022	0	0.0	1098.1	28.4	0.000	0.000	1.377	36.424	546584	25.0	3.822	56	23.1	49.1	0.0	0.009	18972	18412	100m.pg151.cx7_c32r64_50kio
q500.1
q500.1: range queries with 500 insert/s per client
Performance metrics for all DBMS, not just the ones listed above. Some are normalized by throughput, others are not. Legend for results is here.
ips	qps	rps	rmbps	wps	wmbps	rpq	rkbpq	wpi	wkbpi	csps	cpups	cspq	cpupq	dbgb1	dbgb2	rss	maxop	p50	p99	tag
3989	54251	0	0.0	39.8	2.3	0.000	0.000	0.010	0.597	209356	25.4	3.859	150	20.0	116.6	22.8	0.005	6793	6393	100m.my8031.cy8_c32r64_50kio
3988	42153	0	0.0	34.2	7.4	0.000	0.000	0.009	1.892	162646	26.1	3.858	198	8.2	10.3	34.8	0.013	5354	4923	100m.fbmy8028.cy9c_c32r64_50kio
3988	141187	0	0.0	1334.4	58.6	0.000	0.000	0.335	15.046	540896	25.2	3.831	57	24.5	43.2	0.0	0.010	17293	16079	100m.pg151.cx7_c32r64_50kio
q1000.1
q1000.1: range queries with 1000 insert/s per client
Performance metrics for all DBMS, not just the ones listed above. Some are normalized by throughput, others are not. Legend for results is here.
ips	qps	rps	rmbps	wps	wmbps	rpq	rkbpq	wpi	wkbpi	csps	cpups	cspq	cpupq	dbgb1	dbgb2	rss	maxop	p50	p99	tag
7976	54107	0	0.0	294.7	12.4	0.000	0.000	0.037	1.595	211427	26.1	3.908	154	26.0	122.6	28.2	0.005	6761	6393	100m.my8031.cy8_c32r64_50kio
7978	41685	12	1.4	68.4	15.1	0.000	0.035	0.009	1.937	162463	26.5	3.897	203	10.4	12.2	44.9	0.035	5194	4763	100m.fbmy8028.cy9c_c32r64_50kio
7976	140864	0	0.0	1105.6	80.2	0.000	0.000	0.139	10.291	540992	25.4	3.841	58	27.8	53.4	0.0	0.011	17869	17038	100m.pg151.cx7_c32r64_50kio
l.i0
- l.i0: load without secondary indexes
- Legend for results is here.
- Each entry lists the percentage of responses that fit in that bucket (slower than max time for previous bucket, faster than min time for next bucket).
Insert response time histogram
256us	1ms	4ms	16ms	64ms	256ms	1s	4s	16s	gt	max	tag
0.000	98.480	1.326	0.166	0.025	0.003	0.000	0.000	0.000	0.000	0.069	my8031.cy8_c32r64_50kio
0.000	15.813	84.156	0.004	0.027	0.000	0.000	0.000	0.000	0.000	0.055	fbmy8028.cy9c_c32r64_50kio
0.000	99.970	0.030	0.000	0.000	0.000	0.000	0.000	0.000	0.000	0.003	pg151.cx7_c32r64_50kio
l.x
- l.x: create secondary indexes
- Legend for results is here.
- Each entry lists the percentage of responses that fit in that bucket (slower than max time for previous bucket, faster than min time for next bucket).
TODO - determine whether there is data for create index response time
l.i1
- l.i1: continue load after secondary indexes created
- Legend for results is here.
- Each entry lists the percentage of responses that fit in that bucket (slower than max time for previous bucket, faster than min time for next bucket).
Insert response time histogram
256us	1ms	4ms	16ms	64ms	256ms	1s	4s	16s	gt	max	tag
0.000	0.000	99.075	0.497	0.303	0.124	0.000	0.000	0.000	0.000	0.126	my8031.cy8_c32r64_50kio
0.000	1.214	98.750	0.022	0.014	0.000	0.000	0.000	0.000	0.000	0.063	fbmy8028.cy9c_c32r64_50kio
0.000	9.535	90.458	0.006	0.000	0.000	0.000	0.000	0.000	0.000	0.012	pg151.cx7_c32r64_50kio
q100.1
- q100.1: range queries with 100 insert/s per client
- Legend for results is here.
- Each entry lists the percentage of responses that fit in that bucket (slower than max time for previous bucket, faster than min time for next bucket).
Query response time histogram
256us	1ms	4ms	16ms	64ms	256ms	1s	4s	16s	gt	max	tag
99.999	0.001	nonzero	0.000	nonzero	0.000	0.000	0.000	0.000	0.000	0.024	my8031.cy8_c32r64_50kio
99.988	0.012	nonzero	nonzero	nonzero	0.000	0.000	0.000	0.000	0.000	0.024	fbmy8028.cy9c_c32r64_50kio
99.999	0.001	nonzero	nonzero	0.000	0.000	0.000	0.000	0.000	0.000	0.009	pg151.cx7_c32r64_50kio
Insert response time histogram
256us	1ms	4ms	16ms	64ms	256ms	1s	4s	16s	gt	max	tag
0.000	0.000	99.903	0.097	0.000	0.000	0.000	0.000	0.000	0.000	0.011	my8031.cy8_c32r64_50kio
0.000	11.490	88.503	0.007	0.000	0.000	0.000	0.000	0.000	0.000	0.008	fbmy8028.cy9c_c32r64_50kio
0.000	0.000	99.658	0.328	0.014	0.000	0.000	0.000	0.000	0.000	0.019	pg151.cx7_c32r64_50kio
q500.1
- q500.1: range queries with 500 insert/s per client
- Legend for results is here.
- Each entry lists the percentage of responses that fit in that bucket (slower than max time for previous bucket, faster than min time for next bucket).
Query response time histogram
256us	1ms	4ms	16ms	64ms	256ms	1s	4s	16s	gt	max	tag
99.994	0.006	nonzero	nonzero	0.000	0.000	0.000	0.000	0.000	0.000	0.005	my8031.cy8_c32r64_50kio
99.981	0.019	nonzero	nonzero	0.000	0.000	0.000	0.000	0.000	0.000	0.013	fbmy8028.cy9c_c32r64_50kio
99.998	0.002	nonzero	nonzero	0.000	0.000	0.000	0.000	0.000	0.000	0.010	pg151.cx7_c32r64_50kio
Insert response time histogram
256us	1ms	4ms	16ms	64ms	256ms	1s	4s	16s	gt	max	tag
0.000	0.000	99.900	0.100	0.000	0.000	0.000	0.000	0.000	0.000	0.009	my8031.cy8_c32r64_50kio
0.000	4.937	95.044	0.019	0.000	0.000	0.000	0.000	0.000	0.000	0.014	fbmy8028.cy9c_c32r64_50kio
0.000	nonzero	95.204	4.793	0.003	0.000	0.000	0.000	0.000	0.000	0.019	pg151.cx7_c32r64_50kio
q1000.1
- q1000.1: range queries with 1000 insert/s per client
- Legend for results is here.
- Each entry lists the percentage of responses that fit in that bucket (slower than max time for previous bucket, faster than min time for next bucket).
Query response time histogram
256us	1ms	4ms	16ms	64ms	256ms	1s	4s	16s	gt	max	tag
99.985	0.014	0.001	nonzero	0.000	0.000	0.000	0.000	0.000	0.000	0.005	my8031.cy8_c32r64_50kio
99.958	0.041	0.001	nonzero	nonzero	0.000	0.000	0.000	0.000	0.000	0.035	fbmy8028.cy9c_c32r64_50kio
99.995	0.004	0.001	nonzero	0.000	0.000	0.000	0.000	0.000	0.000	0.011	pg151.cx7_c32r64_50kio
Insert response time histogram
256us	1ms	4ms	16ms	64ms	256ms	1s	4s	16s	gt	max	tag
0.000	0.000	99.719	0.281	0.000	0.000	0.000	0.000	0.000	0.000	0.013	my8031.cy8_c32r64_50kio
0.000	1.209	98.774	0.017	0.000	0.000	0.000	0.000	0.000	0.000	0.014	fbmy8028.cy9c_c32r64_50kio
0.000	0.002	94.165	5.832	0.001	0.000	0.000	0.000	0.000	0.000	0.019	pg151.cx7_c32r64_50kio