Introduction
This is a report for the insert benchmark with 100M docs and 16 client(s). It is generated by scripts (bash, awk, sed) and Tufte might not be impressed. An overview of the insert benchmark is here and a short update is here. Below, by DBMS, I mean DBMS+version.config. An example is my8020.c10b40 where my means MySQL, 8020 is version 8.0.20 and c10b40 is the name for the configuration file.
The test server is an c7g.8xl with 32 cores, 64G RAM and io2 storage (2T, 50K IOPs). The benchmark was run with 16 clients and there was 1 or 2 connections per client (1 for queries, 1 for inserts). The benchmark loads 75M rows without secondary indexes, creates secondary indexes, loads another 25M rows then does 3 read+write tests for one hour each that do queries as fast as possible with 100, 500 and then 1000 writes/second/client concurrent with the queries. The database is cached by the storage engine and the only IO is for writes. Clients and the DBMS share one server. The per-database configs are in the per-database subdirectories here.
The tested DBMS are:
- my8031.cy8_c32r64_50kio - MySQL 8.0.31 with InnoDB and the cy8_c32r64_50kio config
- fbmy8028.cy9c_c32r64_50kio - FB MySQL 8.0.28 with MyRocks and the cy9c_c32r64_50kio config
- pg151.cx7_c32r64_50kio - Postgres 15.1 and the cx7_c32r64_50kio config
Contents
- Summary
- l.i0: load without secondary indexes
- l.x: create secondary indexes
- l.i1: continue load after secondary indexes created
- q100.1: range queries with 100 insert/s per client
- q500.1: range queries with 500 insert/s per client
- q1000.1: range queries with 1000 insert/s per client
Summary
The numbers are inserts/s for l.i0 and l.i1, indexed docs (or rows) /s for l.x and queries/s for q*.2. The values are the average rate over the entire test for inserts (IPS) and queries (QPS). The range of values for IPS and QPS is split into 3 parts: bottom 25%, middle 50%, top 25%. Values in the bottom 25% have a red background, values in the top 25% have a green background and values in the middle have no color. A gray background is used for values that can be ignored because the DBMS did not sustain the target insert rate. Red backgrounds are not used when the minimum value is within 80% of the max value.
| dbms | l.i0 | l.x | l.i1 | q100.1 | q500.1 | q1000.1 |
|---|---|---|---|---|---|---|
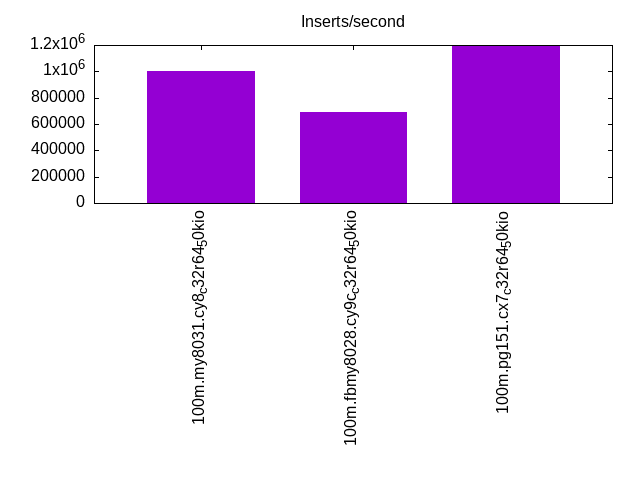
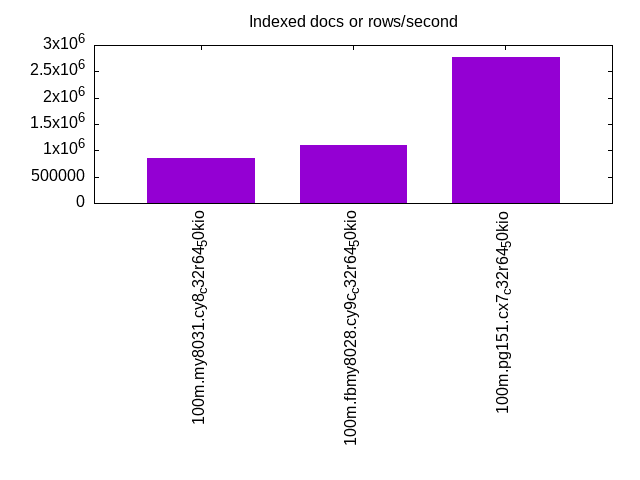
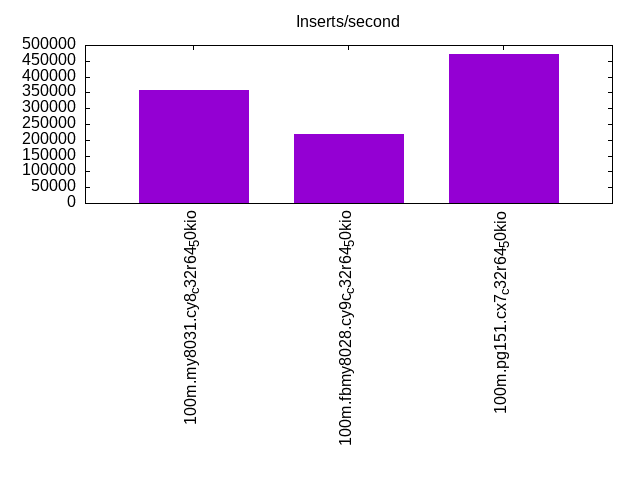
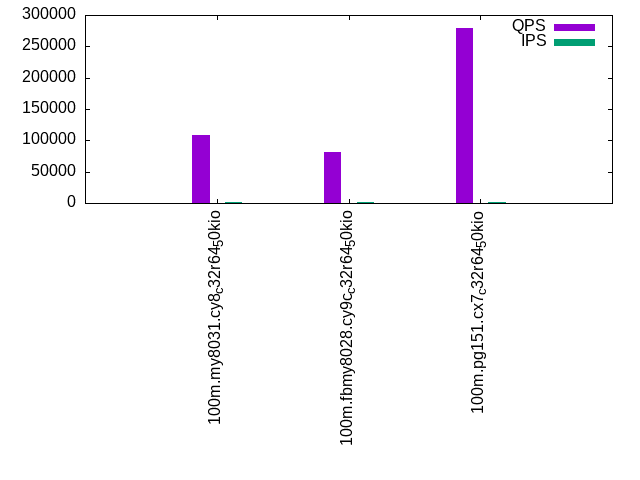
| 100m.my8031.cy8_c32r64_50kio | 1000000 | 863218 | 357143 | 108094 | 108081 | 104663 |
| 100m.fbmy8028.cy9c_c32r64_50kio | 694444 | 1104412 | 217391 | 80945 | 78663 | 75623 |
| 100m.pg151.cx7_c32r64_50kio | 1190476 | 2781481 | 471698 | 279838 | 267888 | 264360 |
This lists the average rate of inserts/s for the tests that do inserts concurrent with queries. For such tests the query rate is listed in the table above. The read+write tests are setup so that the insert rate should match the target rate every second. Cells that are not at least 95% of the target have a red background to indicate a failure to satisfy the target.
| dbms | q100.1 | q500.1 | q1000.1 |
|---|---|---|---|
| my8031.cy8_c32r64_50kio | 1592 | 7960 | 15916 |
| fbmy8028.cy9c_c32r64_50kio | 1592 | 7958 | 15916 |
| pg151.cx7_c32r64_50kio | 1592 | 7958 | 15916 |
| target | 1600 | 8000 | 16000 |
l.i0
l.i0: load without secondary indexes. Graphs for performance per 1-second interval are here.
Average throughput:
Insert response time histogram: each cell has the percentage of responses that take <= the time in the header and max is the max response time in seconds. For the max column values in the top 25% of the range have a red background and in the bottom 25% of the range have a green background. The red background is not used when the min value is within 80% of the max value.
| dbms | 256us | 1ms | 4ms | 16ms | 64ms | 256ms | 1s | 4s | 16s | gt | max |
|---|---|---|---|---|---|---|---|---|---|---|---|
| my8031.cy8_c32r64_50kio | 43.271 | 56.511 | 0.166 | 0.023 | 0.030 | 0.095 | |||||
| fbmy8028.cy9c_c32r64_50kio | 6.854 | 92.974 | 0.120 | 0.052 | 0.050 | ||||||
| pg151.cx7_c32r64_50kio | 97.576 | 2.363 | 0.059 | 0.002 | 0.016 |
Performance metrics for the DBMS listed above. Some are normalized by throughput, others are not. Legend for results is here.
ips	qps	rps	rmbps	wps	wmbps	rpq	rkbpq	wpi	wkbpi	csps	cpups	cspq	cpupq	dbgb1	dbgb2	rss	maxop	p50	p99	tag
1000000	0	0	0.0	1456.5	255.5	0.000	0.000	0.001	0.262	140367	50.5	0.140	16	5.1	101.6	9.4	0.095	92727	58537	100m.my8031.cy8_c32r64_50kio
694444	0	0	0.0	1036.0	236.9	0.000	0.000	0.001	0.349	96044	49.3	0.138	23	2.9	3.6	1.5	0.050	56876	47565	100m.fbmy8028.cy9c_c32r64_50kio
1190476	0	0	0.0	2232.4	518.2	0.000	0.000	0.002	0.446	135763	49.6	0.114	13	7.2	19.4	6.8	0.016	132857	114411	100m.pg151.cx7_c32r64_50kio
l.x
l.x: create secondary indexes.
Average throughput:
Performance metrics for the DBMS listed above. Some are normalized by throughput, others are not. Legend for results is here.
ips	qps	rps	rmbps	wps	wmbps	rpq	rkbpq	wpi	wkbpi	csps	cpups	cspq	cpupq	dbgb1	dbgb2	rss	maxop	p50	p99	tag
863218	0	4855	311.8	16848.3	797.7	0.006	0.370	0.020	0.946	91477	22.8	0.106	8	11.1	107.7	13.0	0.002	NA	NA	100m.my8031.cy8_c32r64_50kio
1104412	0	3	0.2	1032.6	234.3	0.000	0.000	0.001	0.217	8389	40.9	0.008	12	5.1	5.8	8.5	0.002	NA	NA	100m.fbmy8028.cy9c_c32r64_50kio
2781481	0	0	0.0	3089.1	749.2	0.000	0.000	0.001	0.276	40968	23.0	0.015	3	13.8	32.1	0.0	0.021	NA	NA	100m.pg151.cx7_c32r64_50kio
l.i1
l.i1: continue load after secondary indexes created. Graphs for performance per 1-second interval are here.
Average throughput:
Insert response time histogram: each cell has the percentage of responses that take <= the time in the header and max is the max response time in seconds. For the max column values in the top 25% of the range have a red background and in the bottom 25% of the range have a green background. The red background is not used when the min value is within 80% of the max value.
| dbms | 256us | 1ms | 4ms | 16ms | 64ms | 256ms | 1s | 4s | 16s | gt | max |
|---|---|---|---|---|---|---|---|---|---|---|---|
| my8031.cy8_c32r64_50kio | 99.049 | 0.509 | 0.290 | 0.152 | 0.168 | ||||||
| fbmy8028.cy9c_c32r64_50kio | 1.308 | 86.636 | 12.026 | 0.030 | 0.048 | ||||||
| pg151.cx7_c32r64_50kio | 13.240 | 86.575 | 0.182 | 0.003 | 0.018 |
Performance metrics for the DBMS listed above. Some are normalized by throughput, others are not. Legend for results is here.
ips	qps	rps	rmbps	wps	wmbps	rpq	rkbpq	wpi	wkbpi	csps	cpups	cspq	cpupq	dbgb1	dbgb2	rss	maxop	p50	p99	tag
357143	0	4871	76.1	2362.6	314.5	0.014	0.218	0.007	0.902	139690	44.1	0.391	40	19.0	115.5	21.7	0.168	32565	450	100m.my8031.cy8_c32r64_50kio
217391	0	147	18.2	982.4	227.8	0.001	0.086	0.005	1.073	82149	30.5	0.378	45	12.3	14.3	9.4	0.048	14484	6393	100m.fbmy8028.cy9c_c32r64_50kio
471698	0	0	0.0	2751.9	635.1	0.000	0.000	0.006	1.379	129994	45.8	0.276	31	22.8	53.1	0.0	0.018	41355	16082	100m.pg151.cx7_c32r64_50kio
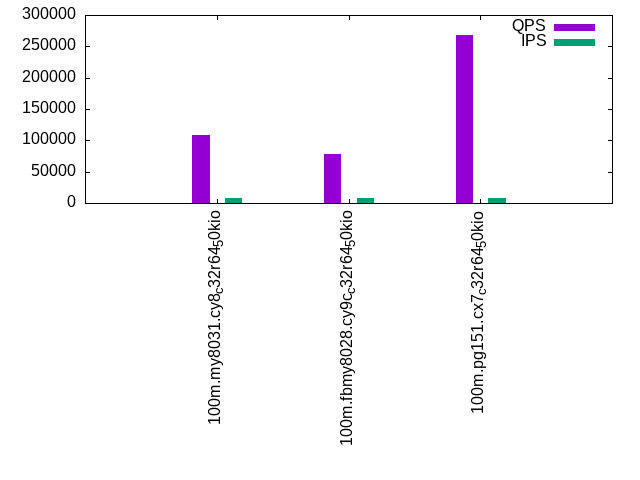
q100.1
q100.1: range queries with 100 insert/s per client. Graphs for performance per 1-second interval are here.
Average throughput:
Query response time histogram: each cell has the percentage of responses that take <= the time in the header and max is the max response time in seconds. For max values in the top 25% of the range have a red background and in the bottom 25% of the range have a green background. The red background is not used when the min value is within 80% of the max value.
| dbms | 256us | 1ms | 4ms | 16ms | 64ms | 256ms | 1s | 4s | 16s | gt | max |
|---|---|---|---|---|---|---|---|---|---|---|---|
| my8031.cy8_c32r64_50kio | 99.938 | 0.060 | 0.002 | nonzero | 0.010 | ||||||
| fbmy8028.cy9c_c32r64_50kio | 99.826 | 0.173 | 0.001 | nonzero | nonzero | 0.033 | |||||
| pg151.cx7_c32r64_50kio | 99.996 | 0.003 | 0.001 | nonzero | 0.014 |
Insert response time histogram: each cell has the percentage of responses that take <= the time in the header and max is the max response time in seconds. For max values in the top 25% of the range have a red background and in the bottom 25% of the range have a green background. The red background is not used when the min value is within 80% of the max value.
| dbms | 256us | 1ms | 4ms | 16ms | 64ms | 256ms | 1s | 4s | 16s | gt | max |
|---|---|---|---|---|---|---|---|---|---|---|---|
| my8031.cy8_c32r64_50kio | 99.840 | 0.160 | 0.009 | ||||||||
| fbmy8028.cy9c_c32r64_50kio | 2.520 | 97.438 | 0.042 | 0.008 | |||||||
| pg151.cx7_c32r64_50kio | 99.159 | 0.830 | 0.011 | 0.017 |
Performance metrics for the DBMS listed above. Some are normalized by throughput, others are not. Legend for results is here.
ips	qps	rps	rmbps	wps	wmbps	rpq	rkbpq	wpi	wkbpi	csps	cpups	cspq	cpupq	dbgb1	dbgb2	rss	maxop	p50	p99	tag
1592	108094	0	0.0	289.7	8.4	0.000	0.000	0.182	5.431	415157	51.3	3.841	152	19.3	115.9	22.0	0.010	6793	6553	100m.my8031.cy8_c32r64_50kio
1592	80945	22	0.2	22.7	4.9	0.000	0.002	0.014	3.123	310306	51.3	3.834	203	7.4	8.1	24.8	0.033	5166	4747	100m.fbmy8028.cy9c_c32r64_50kio
1592	279838	0	0.0	1318.1	41.9	0.000	0.000	0.828	26.938	1068784	50.4	3.819	58	23.4	52.0	0.0	0.014	17276	16606	100m.pg151.cx7_c32r64_50kio
q500.1
q500.1: range queries with 500 insert/s per client. Graphs for performance per 1-second interval are here.
Average throughput:
Query response time histogram: each cell has the percentage of responses that take <= the time in the header and max is the max response time in seconds. For max values in the top 25% of the range have a red background and in the bottom 25% of the range have a green background. The red background is not used when the min value is within 80% of the max value.
| dbms | 256us | 1ms | 4ms | 16ms | 64ms | 256ms | 1s | 4s | 16s | gt | max |
|---|---|---|---|---|---|---|---|---|---|---|---|
| my8031.cy8_c32r64_50kio | 99.786 | 0.199 | 0.015 | nonzero | 0.016 | ||||||
| fbmy8028.cy9c_c32r64_50kio | 99.098 | 0.888 | 0.013 | nonzero | nonzero | 0.033 | |||||
| pg151.cx7_c32r64_50kio | 99.977 | 0.015 | 0.008 | nonzero | 0.014 |
Insert response time histogram: each cell has the percentage of responses that take <= the time in the header and max is the max response time in seconds. For max values in the top 25% of the range have a red background and in the bottom 25% of the range have a green background. The red background is not used when the min value is within 80% of the max value.
| dbms | 256us | 1ms | 4ms | 16ms | 64ms | 256ms | 1s | 4s | 16s | gt | max |
|---|---|---|---|---|---|---|---|---|---|---|---|
| my8031.cy8_c32r64_50kio | 99.024 | 0.976 | 0.015 | ||||||||
| fbmy8028.cy9c_c32r64_50kio | 0.792 | 94.246 | 4.962 | nonzero | 0.016 | ||||||
| pg151.cx7_c32r64_50kio | 0.093 | 89.726 | 10.088 | 0.093 | 0.030 |
Performance metrics for the DBMS listed above. Some are normalized by throughput, others are not. Legend for results is here.
ips	qps	rps	rmbps	wps	wmbps	rpq	rkbpq	wpi	wkbpi	csps	cpups	cspq	cpupq	dbgb1	dbgb2	rss	maxop	p50	p99	tag
7960	108081	0	0.0	262.4	10.1	0.000	0.000	0.033	1.299	416048	51.7	3.849	153	21.4	118.0	24.1	0.016	6831	6587	100m.my8031.cy8_c32r64_50kio
7958	78663	0	0.0	66.6	15.2	0.000	0.000	0.008	1.958	303689	52.3	3.861	213	9.5	9.8	43.0	0.033	4923	4523	100m.fbmy8028.cy9c_c32r64_50kio
7958	267888	0	0.0	1048.2	75.7	0.000	0.000	0.132	9.742	1025813	51.1	3.829	61	26.3	49.5	0.0	0.014	16766	15359	100m.pg151.cx7_c32r64_50kio
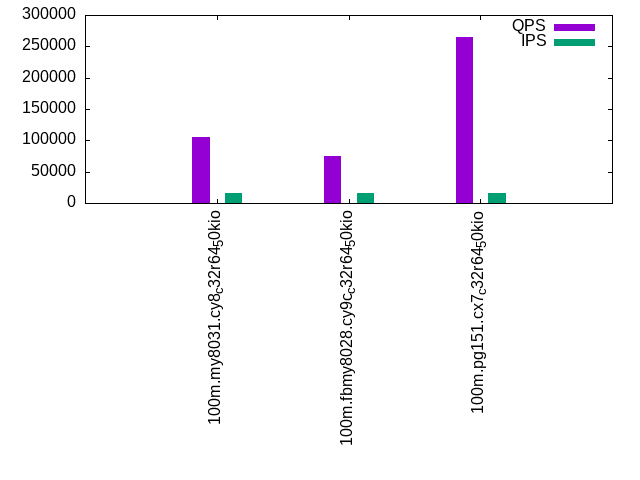
q1000.1
q1000.1: range queries with 1000 insert/s per client. Graphs for performance per 1-second interval are here.
Average throughput:
Query response time histogram: each cell has the percentage of responses that take <= the time in the header and max is the max response time in seconds. For max values in the top 25% of the range have a red background and in the bottom 25% of the range have a green background. The red background is not used when the min value is within 80% of the max value.
| dbms | 256us | 1ms | 4ms | 16ms | 64ms | 256ms | 1s | 4s | 16s | gt | max |
|---|---|---|---|---|---|---|---|---|---|---|---|
| my8031.cy8_c32r64_50kio | 99.552 | 0.428 | 0.020 | nonzero | nonzero | 0.023 | |||||
| fbmy8028.cy9c_c32r64_50kio | 97.489 | 2.479 | 0.032 | nonzero | nonzero | 0.035 | |||||
| pg151.cx7_c32r64_50kio | 99.936 | 0.047 | 0.017 | 0.001 | nonzero | 0.021 |
Insert response time histogram: each cell has the percentage of responses that take <= the time in the header and max is the max response time in seconds. For max values in the top 25% of the range have a red background and in the bottom 25% of the range have a green background. The red background is not used when the min value is within 80% of the max value.
| dbms | 256us | 1ms | 4ms | 16ms | 64ms | 256ms | 1s | 4s | 16s | gt | max |
|---|---|---|---|---|---|---|---|---|---|---|---|
| my8031.cy8_c32r64_50kio | 99.142 | 0.857 | 0.001 | 0.020 | |||||||
| fbmy8028.cy9c_c32r64_50kio | 0.277 | 64.877 | 34.831 | 0.014 | 0.022 | ||||||
| pg151.cx7_c32r64_50kio | 0.001 | 89.530 | 10.101 | 0.368 | 0.040 |
Performance metrics for the DBMS listed above. Some are normalized by throughput, others are not. Legend for results is here.
ips	qps	rps	rmbps	wps	wmbps	rpq	rkbpq	wpi	wkbpi	csps	cpups	cspq	cpupq	dbgb1	dbgb2	rss	maxop	p50	p99	tag
15916	104663	0	0.0	801.5	32.5	0.000	0.000	0.050	2.092	407211	52.7	3.891	161	37.6	134.1	38.5	0.023	6441	6201	100m.my8031.cy8_c32r64_50kio
15916	75623	11	1.3	137.5	31.3	0.000	0.018	0.009	2.012	294820	53.8	3.899	228	13.5	15.2	49.5	0.035	4779	4411	100m.fbmy8028.cy9c_c32r64_50kio
15916	264360	0	0.0	1197.9	118.1	0.000	0.000	0.075	7.595	1013507	51.7	3.834	63	44.4	77.8	0.0	0.021	16462	14752	100m.pg151.cx7_c32r64_50kio
l.i0
l.i0: load without secondary indexes
Performance metrics for all DBMS, not just the ones listed above. Some are normalized by throughput, others are not. Legend for results is here.
ips	qps	rps	rmbps	wps	wmbps	rpq	rkbpq	wpi	wkbpi	csps	cpups	cspq	cpupq	dbgb1	dbgb2	rss	maxop	p50	p99	tag
1000000	0	0	0.0	1456.5	255.5	0.000	0.000	0.001	0.262	140367	50.5	0.140	16	5.1	101.6	9.4	0.095	92727	58537	100m.my8031.cy8_c32r64_50kio
694444	0	0	0.0	1036.0	236.9	0.000	0.000	0.001	0.349	96044	49.3	0.138	23	2.9	3.6	1.5	0.050	56876	47565	100m.fbmy8028.cy9c_c32r64_50kio
1190476	0	0	0.0	2232.4	518.2	0.000	0.000	0.002	0.446	135763	49.6	0.114	13	7.2	19.4	6.8	0.016	132857	114411	100m.pg151.cx7_c32r64_50kio
l.x
l.x: create secondary indexes
Performance metrics for all DBMS, not just the ones listed above. Some are normalized by throughput, others are not. Legend for results is here.
ips	qps	rps	rmbps	wps	wmbps	rpq	rkbpq	wpi	wkbpi	csps	cpups	cspq	cpupq	dbgb1	dbgb2	rss	maxop	p50	p99	tag
863218	0	4855	311.8	16848.3	797.7	0.006	0.370	0.020	0.946	91477	22.8	0.106	8	11.1	107.7	13.0	0.002	NA	NA	100m.my8031.cy8_c32r64_50kio
1104412	0	3	0.2	1032.6	234.3	0.000	0.000	0.001	0.217	8389	40.9	0.008	12	5.1	5.8	8.5	0.002	NA	NA	100m.fbmy8028.cy9c_c32r64_50kio
2781481	0	0	0.0	3089.1	749.2	0.000	0.000	0.001	0.276	40968	23.0	0.015	3	13.8	32.1	0.0	0.021	NA	NA	100m.pg151.cx7_c32r64_50kio
l.i1
l.i1: continue load after secondary indexes created
Performance metrics for all DBMS, not just the ones listed above. Some are normalized by throughput, others are not. Legend for results is here.
ips	qps	rps	rmbps	wps	wmbps	rpq	rkbpq	wpi	wkbpi	csps	cpups	cspq	cpupq	dbgb1	dbgb2	rss	maxop	p50	p99	tag
357143	0	4871	76.1	2362.6	314.5	0.014	0.218	0.007	0.902	139690	44.1	0.391	40	19.0	115.5	21.7	0.168	32565	450	100m.my8031.cy8_c32r64_50kio
217391	0	147	18.2	982.4	227.8	0.001	0.086	0.005	1.073	82149	30.5	0.378	45	12.3	14.3	9.4	0.048	14484	6393	100m.fbmy8028.cy9c_c32r64_50kio
471698	0	0	0.0	2751.9	635.1	0.000	0.000	0.006	1.379	129994	45.8	0.276	31	22.8	53.1	0.0	0.018	41355	16082	100m.pg151.cx7_c32r64_50kio
q100.1
q100.1: range queries with 100 insert/s per client
Performance metrics for all DBMS, not just the ones listed above. Some are normalized by throughput, others are not. Legend for results is here.
ips	qps	rps	rmbps	wps	wmbps	rpq	rkbpq	wpi	wkbpi	csps	cpups	cspq	cpupq	dbgb1	dbgb2	rss	maxop	p50	p99	tag
1592	108094	0	0.0	289.7	8.4	0.000	0.000	0.182	5.431	415157	51.3	3.841	152	19.3	115.9	22.0	0.010	6793	6553	100m.my8031.cy8_c32r64_50kio
1592	80945	22	0.2	22.7	4.9	0.000	0.002	0.014	3.123	310306	51.3	3.834	203	7.4	8.1	24.8	0.033	5166	4747	100m.fbmy8028.cy9c_c32r64_50kio
1592	279838	0	0.0	1318.1	41.9	0.000	0.000	0.828	26.938	1068784	50.4	3.819	58	23.4	52.0	0.0	0.014	17276	16606	100m.pg151.cx7_c32r64_50kio
q500.1
q500.1: range queries with 500 insert/s per client
Performance metrics for all DBMS, not just the ones listed above. Some are normalized by throughput, others are not. Legend for results is here.
ips	qps	rps	rmbps	wps	wmbps	rpq	rkbpq	wpi	wkbpi	csps	cpups	cspq	cpupq	dbgb1	dbgb2	rss	maxop	p50	p99	tag
7960	108081	0	0.0	262.4	10.1	0.000	0.000	0.033	1.299	416048	51.7	3.849	153	21.4	118.0	24.1	0.016	6831	6587	100m.my8031.cy8_c32r64_50kio
7958	78663	0	0.0	66.6	15.2	0.000	0.000	0.008	1.958	303689	52.3	3.861	213	9.5	9.8	43.0	0.033	4923	4523	100m.fbmy8028.cy9c_c32r64_50kio
7958	267888	0	0.0	1048.2	75.7	0.000	0.000	0.132	9.742	1025813	51.1	3.829	61	26.3	49.5	0.0	0.014	16766	15359	100m.pg151.cx7_c32r64_50kio
q1000.1
q1000.1: range queries with 1000 insert/s per client
Performance metrics for all DBMS, not just the ones listed above. Some are normalized by throughput, others are not. Legend for results is here.
ips	qps	rps	rmbps	wps	wmbps	rpq	rkbpq	wpi	wkbpi	csps	cpups	cspq	cpupq	dbgb1	dbgb2	rss	maxop	p50	p99	tag
15916	104663	0	0.0	801.5	32.5	0.000	0.000	0.050	2.092	407211	52.7	3.891	161	37.6	134.1	38.5	0.023	6441	6201	100m.my8031.cy8_c32r64_50kio
15916	75623	11	1.3	137.5	31.3	0.000	0.018	0.009	2.012	294820	53.8	3.899	228	13.5	15.2	49.5	0.035	4779	4411	100m.fbmy8028.cy9c_c32r64_50kio
15916	264360	0	0.0	1197.9	118.1	0.000	0.000	0.075	7.595	1013507	51.7	3.834	63	44.4	77.8	0.0	0.021	16462	14752	100m.pg151.cx7_c32r64_50kio
l.i0
- l.i0: load without secondary indexes
- Legend for results is here.
- Each entry lists the percentage of responses that fit in that bucket (slower than max time for previous bucket, faster than min time for next bucket).
Insert response time histogram
256us	1ms	4ms	16ms	64ms	256ms	1s	4s	16s	gt	max	tag
0.000	43.271	56.511	0.166	0.023	0.030	0.000	0.000	0.000	0.000	0.095	my8031.cy8_c32r64_50kio
0.000	6.854	92.974	0.120	0.052	0.000	0.000	0.000	0.000	0.000	0.050	fbmy8028.cy9c_c32r64_50kio
0.000	97.576	2.363	0.059	0.002	0.000	0.000	0.000	0.000	0.000	0.016	pg151.cx7_c32r64_50kio
l.x
- l.x: create secondary indexes
- Legend for results is here.
- Each entry lists the percentage of responses that fit in that bucket (slower than max time for previous bucket, faster than min time for next bucket).
TODO - determine whether there is data for create index response time
l.i1
- l.i1: continue load after secondary indexes created
- Legend for results is here.
- Each entry lists the percentage of responses that fit in that bucket (slower than max time for previous bucket, faster than min time for next bucket).
Insert response time histogram
256us	1ms	4ms	16ms	64ms	256ms	1s	4s	16s	gt	max	tag
0.000	0.000	99.049	0.509	0.290	0.152	0.000	0.000	0.000	0.000	0.168	my8031.cy8_c32r64_50kio
0.000	1.308	86.636	12.026	0.030	0.000	0.000	0.000	0.000	0.000	0.048	fbmy8028.cy9c_c32r64_50kio
0.000	13.240	86.575	0.182	0.003	0.000	0.000	0.000	0.000	0.000	0.018	pg151.cx7_c32r64_50kio
q100.1
- q100.1: range queries with 100 insert/s per client
- Legend for results is here.
- Each entry lists the percentage of responses that fit in that bucket (slower than max time for previous bucket, faster than min time for next bucket).
Query response time histogram
256us	1ms	4ms	16ms	64ms	256ms	1s	4s	16s	gt	max	tag
99.938	0.060	0.002	nonzero	0.000	0.000	0.000	0.000	0.000	0.000	0.010	my8031.cy8_c32r64_50kio
99.826	0.173	0.001	nonzero	nonzero	0.000	0.000	0.000	0.000	0.000	0.033	fbmy8028.cy9c_c32r64_50kio
99.996	0.003	0.001	nonzero	0.000	0.000	0.000	0.000	0.000	0.000	0.014	pg151.cx7_c32r64_50kio
Insert response time histogram
256us	1ms	4ms	16ms	64ms	256ms	1s	4s	16s	gt	max	tag
0.000	0.000	99.840	0.160	0.000	0.000	0.000	0.000	0.000	0.000	0.009	my8031.cy8_c32r64_50kio
0.000	2.520	97.438	0.042	0.000	0.000	0.000	0.000	0.000	0.000	0.008	fbmy8028.cy9c_c32r64_50kio
0.000	0.000	99.159	0.830	0.011	0.000	0.000	0.000	0.000	0.000	0.017	pg151.cx7_c32r64_50kio
q500.1
- q500.1: range queries with 500 insert/s per client
- Legend for results is here.
- Each entry lists the percentage of responses that fit in that bucket (slower than max time for previous bucket, faster than min time for next bucket).
Query response time histogram
256us	1ms	4ms	16ms	64ms	256ms	1s	4s	16s	gt	max	tag
99.786	0.199	0.015	nonzero	0.000	0.000	0.000	0.000	0.000	0.000	0.016	my8031.cy8_c32r64_50kio
99.098	0.888	0.013	nonzero	nonzero	0.000	0.000	0.000	0.000	0.000	0.033	fbmy8028.cy9c_c32r64_50kio
99.977	0.015	0.008	nonzero	0.000	0.000	0.000	0.000	0.000	0.000	0.014	pg151.cx7_c32r64_50kio
Insert response time histogram
256us	1ms	4ms	16ms	64ms	256ms	1s	4s	16s	gt	max	tag
0.000	0.000	99.024	0.976	0.000	0.000	0.000	0.000	0.000	0.000	0.015	my8031.cy8_c32r64_50kio
0.000	0.792	94.246	4.962	nonzero	0.000	0.000	0.000	0.000	0.000	0.016	fbmy8028.cy9c_c32r64_50kio
0.000	0.093	89.726	10.088	0.093	0.000	0.000	0.000	0.000	0.000	0.030	pg151.cx7_c32r64_50kio
q1000.1
- q1000.1: range queries with 1000 insert/s per client
- Legend for results is here.
- Each entry lists the percentage of responses that fit in that bucket (slower than max time for previous bucket, faster than min time for next bucket).
Query response time histogram
256us	1ms	4ms	16ms	64ms	256ms	1s	4s	16s	gt	max	tag
99.552	0.428	0.020	nonzero	nonzero	0.000	0.000	0.000	0.000	0.000	0.023	my8031.cy8_c32r64_50kio
97.489	2.479	0.032	nonzero	nonzero	0.000	0.000	0.000	0.000	0.000	0.035	fbmy8028.cy9c_c32r64_50kio
99.936	0.047	0.017	0.001	nonzero	0.000	0.000	0.000	0.000	0.000	0.021	pg151.cx7_c32r64_50kio
Insert response time histogram
256us	1ms	4ms	16ms	64ms	256ms	1s	4s	16s	gt	max	tag
0.000	0.000	99.142	0.857	0.001	0.000	0.000	0.000	0.000	0.000	0.020	my8031.cy8_c32r64_50kio
0.000	0.277	64.877	34.831	0.014	0.000	0.000	0.000	0.000	0.000	0.022	fbmy8028.cy9c_c32r64_50kio
0.000	0.001	89.530	10.101	0.368	0.000	0.000	0.000	0.000	0.000	0.040	pg151.cx7_c32r64_50kio