Introduction
This is a report for the insert benchmark with 100M docs and 8 client(s). It is generated by scripts (bash, awk, sed) and Tufte might not be impressed. An overview of the insert benchmark is here and a short update is here. Below, by DBMS, I mean DBMS+version.config. An example is my8020.c10b40 where my means MySQL, 8020 is version 8.0.20 and c10b40 is the name for the configuration file.
The test server is an c6i.8xl with 16 cores, 16 HW threads (hyperthread disabled), 64G RAM and io2 storage (2T, 50K IOPs). The benchmark was run with 8 clients and there was 1 or 2 connections per client (1 for queries, 1 for inserts). The benchmark loads 75M rows without secondary indexes, creates secondary indexes, loads another 25M rows then does 3 read+write tests for one hour each that do queries as fast as possible with 100, 500 and then 1000 writes/second/client concurrent with the queries. The database is cached by the storage engine and the only IO is for writes. Clients and the DBMS share one server. The per-database configs are in the per-database subdirectories here.
The tested DBMS are:
- my8031.cy8_c32r64_50kio - MySQL 8.0.31 with InnoDB and the cy8_c32r64_50kio config
- fbmy8028.cy9c_c32r64_50kio - FB MySQL 8.0.28 with MyRocks and the cy9c_c32r64_50kio config
- pg151.cx7_c32r64_50kio - Postgres 15.1 and the cx7_c32r64_50kio config
Contents
- Summary
- l.i0: load without secondary indexes
- l.x: create secondary indexes
- l.i1: continue load after secondary indexes created
- q100.1: range queries with 100 insert/s per client
- q500.1: range queries with 500 insert/s per client
- q1000.1: range queries with 1000 insert/s per client
Summary
The numbers are inserts/s for l.i0 and l.i1, indexed docs (or rows) /s for l.x and queries/s for q*.2. The values are the average rate over the entire test for inserts (IPS) and queries (QPS). The range of values for IPS and QPS is split into 3 parts: bottom 25%, middle 50%, top 25%. Values in the bottom 25% have a red background, values in the top 25% have a green background and values in the middle have no color. A gray background is used for values that can be ignored because the DBMS did not sustain the target insert rate. Red backgrounds are not used when the minimum value is within 80% of the max value.
| dbms | l.i0 | l.x | l.i1 | q100.1 | q500.1 | q1000.1 |
|---|---|---|---|---|---|---|
| 100m.my8031.cy8_c32r64_50kio | 773196 | 517931 | 255102 | 71823 | 71357 | 70760 |
| 100m.fbmy8028.cy9c_c32r64_50kio | 555556 | 751000 | 210084 | 56779 | 55366 | 54356 |
| 100m.pg151.cx7_c32r64_50kio | 937500 | 2346875 | 328947 | 140106 | 136468 | 132486 |
This lists the average rate of inserts/s for the tests that do inserts concurrent with queries. For such tests the query rate is listed in the table above. The read+write tests are setup so that the insert rate should match the target rate every second. Cells that are not at least 95% of the target have a red background to indicate a failure to satisfy the target.
| dbms | q100.1 | q500.1 | q1000.1 |
|---|---|---|---|
| my8031.cy8_c32r64_50kio | 797 | 3987 | 7978 |
| fbmy8028.cy9c_c32r64_50kio | 797 | 3987 | 7978 |
| pg151.cx7_c32r64_50kio | 797 | 3987 | 7976 |
| target | 800 | 4000 | 8000 |
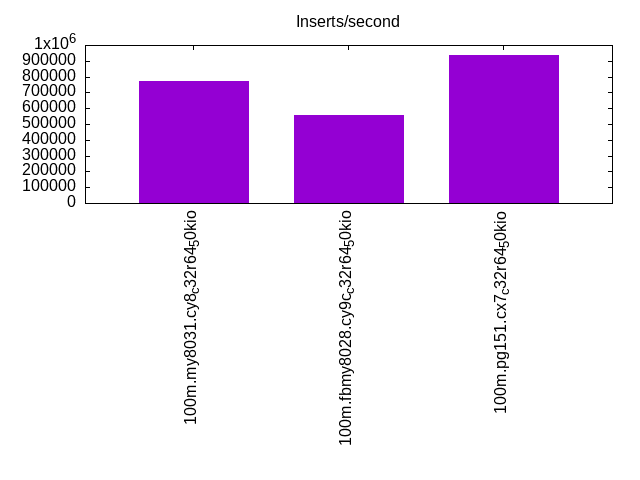
l.i0
l.i0: load without secondary indexes. Graphs for performance per 1-second interval are here.
Average throughput:
Insert response time histogram: each cell has the percentage of responses that take <= the time in the header and max is the max response time in seconds. For the max column values in the top 25% of the range have a red background and in the bottom 25% of the range have a green background. The red background is not used when the min value is within 80% of the max value.
| dbms | 256us | 1ms | 4ms | 16ms | 64ms | 256ms | 1s | 4s | 16s | gt | max |
|---|---|---|---|---|---|---|---|---|---|---|---|
| my8031.cy8_c32r64_50kio | 97.443 | 2.357 | 0.171 | 0.023 | 0.006 | 0.096 | |||||
| fbmy8028.cy9c_c32r64_50kio | 17.299 | 82.535 | 0.138 | 0.028 | nonzero | 0.065 | |||||
| pg151.cx7_c32r64_50kio | 97.179 | 2.810 | 0.011 | 0.010 |
Performance metrics for the DBMS listed above. Some are normalized by throughput, others are not. Legend for results is here.
ips	qps	rps	rmbps	wps	wmbps	rpq	rkbpq	wpi	wkbpi	csps	cpups	cspq	cpupq	dbgb1	dbgb2	rss	maxop	p50	p99	tag
773196	0	0	0.0	1171.3	201.2	0.000	0.000	0.002	0.266	109876	66.2	0.142	14	5.0	101.6	9.4	0.096	115976	75219	100m.my8031.cy8_c32r64_50kio
555556	0	0	0.0	879.3	199.5	0.000	0.000	0.002	0.368	61254	59.6	0.110	17	2.6	3.3	1.3	0.065	78117	9992	100m.fbmy8028.cy9c_c32r64_50kio
937500	0	0	0.0	1651.9	379.2	0.000	0.000	0.002	0.414	93756	62.2	0.100	11	7.2	19.4	0.0	0.010	146782	75739	100m.pg151.cx7_c32r64_50kio
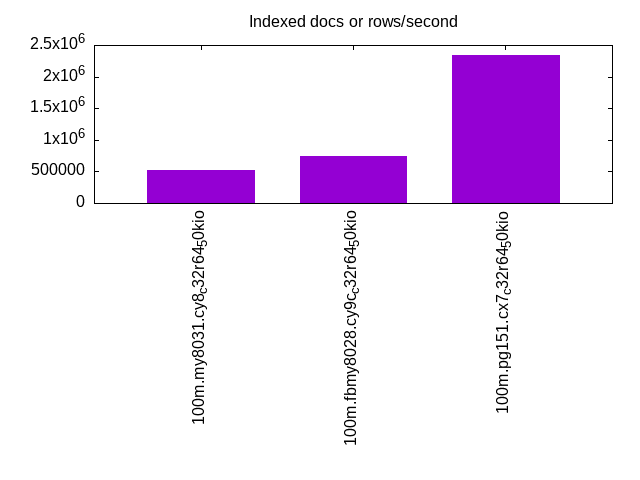
l.x
l.x: create secondary indexes.
Average throughput:
Performance metrics for the DBMS listed above. Some are normalized by throughput, others are not. Legend for results is here.
ips	qps	rps	rmbps	wps	wmbps	rpq	rkbpq	wpi	wkbpi	csps	cpups	cspq	cpupq	dbgb1	dbgb2	rss	maxop	p50	p99	tag
517931	0	2762	181.1	10131.8	493.1	0.005	0.358	0.020	0.975	61310	30.6	0.118	9	11.1	107.7	14.0	0.009	NA	NA	100m.my8031.cy8_c32r64_50kio
751000	0	2	0.1	584.7	132.0	0.000	0.000	0.001	0.180	2251	46.1	0.003	10	5.1	5.8	7.5	0.003	NA	NA	100m.fbmy8028.cy9c_c32r64_50kio
2346875	0	0	0.0	2646.1	644.5	0.000	0.000	0.001	0.281	14804	32.1	0.006	2	13.8	32.1	0.0	0.011	NA	NA	100m.pg151.cx7_c32r64_50kio
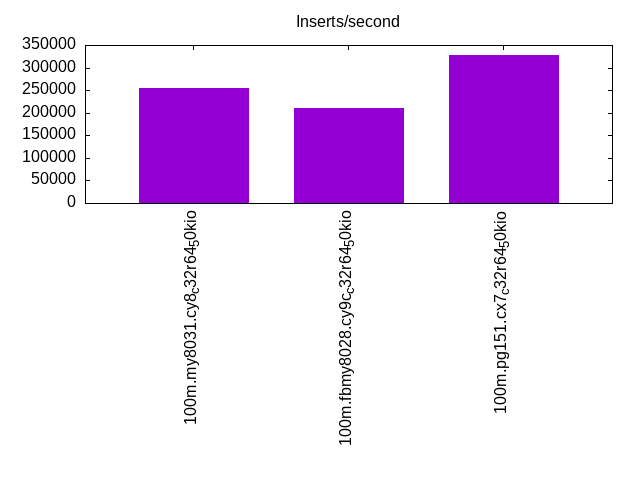
l.i1
l.i1: continue load after secondary indexes created. Graphs for performance per 1-second interval are here.
Average throughput:
Insert response time histogram: each cell has the percentage of responses that take <= the time in the header and max is the max response time in seconds. For the max column values in the top 25% of the range have a red background and in the bottom 25% of the range have a green background. The red background is not used when the min value is within 80% of the max value.
| dbms | 256us | 1ms | 4ms | 16ms | 64ms | 256ms | 1s | 4s | 16s | gt | max |
|---|---|---|---|---|---|---|---|---|---|---|---|
| my8031.cy8_c32r64_50kio | 99.113 | 0.484 | 0.344 | 0.056 | 0.004 | 0.367 | |||||
| fbmy8028.cy9c_c32r64_50kio | 3.625 | 96.039 | 0.319 | 0.017 | 0.062 | ||||||
| pg151.cx7_c32r64_50kio | 35.963 | 63.912 | 0.083 | 0.042 | 0.036 |
Performance metrics for the DBMS listed above. Some are normalized by throughput, others are not. Legend for results is here.
ips	qps	rps	rmbps	wps	wmbps	rpq	rkbpq	wpi	wkbpi	csps	cpups	cspq	cpupq	dbgb1	dbgb2	rss	maxop	p50	p99	tag
255102	0	3617	56.5	1955.1	236.8	0.014	0.227	0.008	0.950	93020	54.6	0.365	34	18.9	115.4	21.6	0.367	41106	649	100m.my8031.cy8_c32r64_50kio
210084	0	192	23.8	1171.7	265.2	0.001	0.116	0.006	1.293	57669	52.4	0.275	40	8.0	9.9	8.4	0.062	27920	1099	100m.fbmy8028.cy9c_c32r64_50kio
328947	0	0	0.0	1947.7	446.7	0.000	0.000	0.006	1.391	75980	55.8	0.231	27	22.8	53.2	0.0	0.036	47849	28619	100m.pg151.cx7_c32r64_50kio
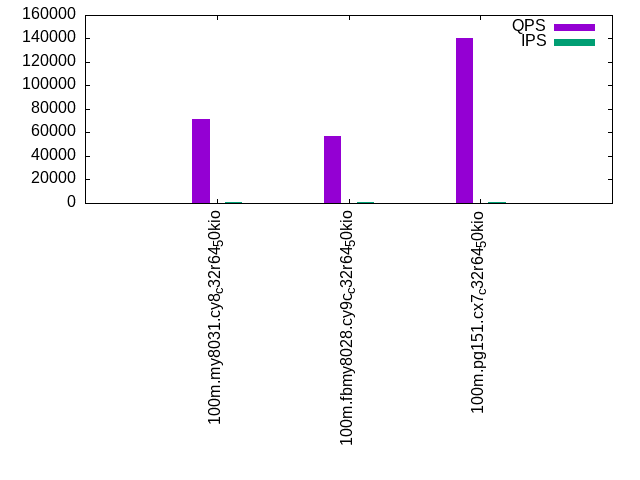
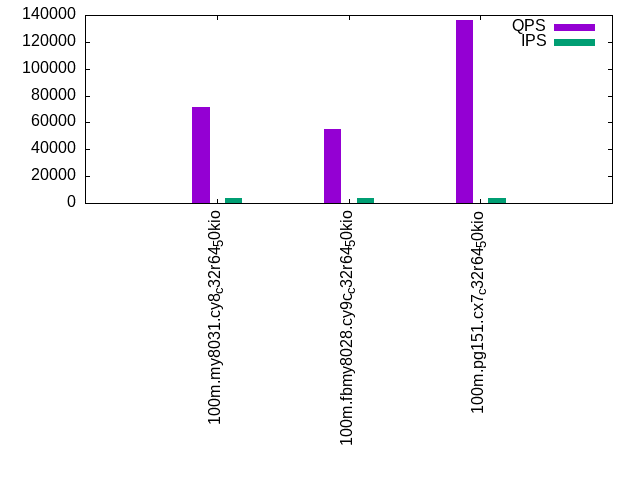
q100.1
q100.1: range queries with 100 insert/s per client. Graphs for performance per 1-second interval are here.
Average throughput:
Query response time histogram: each cell has the percentage of responses that take <= the time in the header and max is the max response time in seconds. For max values in the top 25% of the range have a red background and in the bottom 25% of the range have a green background. The red background is not used when the min value is within 80% of the max value.
| dbms | 256us | 1ms | 4ms | 16ms | 64ms | 256ms | 1s | 4s | 16s | gt | max |
|---|---|---|---|---|---|---|---|---|---|---|---|
| my8031.cy8_c32r64_50kio | 99.989 | 0.010 | 0.001 | nonzero | nonzero | 0.025 | |||||
| fbmy8028.cy9c_c32r64_50kio | 99.984 | 0.015 | 0.001 | nonzero | 0.007 | ||||||
| pg151.cx7_c32r64_50kio | 99.997 | 0.002 | 0.001 | nonzero | 0.012 |
Insert response time histogram: each cell has the percentage of responses that take <= the time in the header and max is the max response time in seconds. For max values in the top 25% of the range have a red background and in the bottom 25% of the range have a green background. The red background is not used when the min value is within 80% of the max value.
| dbms | 256us | 1ms | 4ms | 16ms | 64ms | 256ms | 1s | 4s | 16s | gt | max |
|---|---|---|---|---|---|---|---|---|---|---|---|
| my8031.cy8_c32r64_50kio | 99.898 | 0.102 | 0.016 | ||||||||
| fbmy8028.cy9c_c32r64_50kio | 14.149 | 85.839 | 0.012 | 0.009 | |||||||
| pg151.cx7_c32r64_50kio | 99.977 | 0.023 | 0.007 |
Performance metrics for the DBMS listed above. Some are normalized by throughput, others are not. Legend for results is here.
ips	qps	rps	rmbps	wps	wmbps	rpq	rkbpq	wpi	wkbpi	csps	cpups	cspq	cpupq	dbgb1	dbgb2	rss	maxop	p50	p99	tag
797	71823	0	0.0	278.5	7.8	0.000	0.000	0.349	10.025	275942	48.6	3.842	108	19.1	115.6	21.8	0.025	9015	8886	100m.my8031.cy8_c32r64_50kio
797	56779	0	0.0	13.8	2.6	0.000	0.000	0.017	3.300	217376	49.5	3.828	139	7.2	7.4	17.8	0.007	7001	6585	100m.fbmy8028.cy9c_c32r64_50kio
797	140106	0	0.0	1096.4	28.3	0.000	0.000	1.375	36.368	535428	46.8	3.822	53	23.1	49.1	0.0	0.012	17618	17357	100m.pg151.cx7_c32r64_50kio
q500.1
q500.1: range queries with 500 insert/s per client. Graphs for performance per 1-second interval are here.
Average throughput:
Query response time histogram: each cell has the percentage of responses that take <= the time in the header and max is the max response time in seconds. For max values in the top 25% of the range have a red background and in the bottom 25% of the range have a green background. The red background is not used when the min value is within 80% of the max value.
| dbms | 256us | 1ms | 4ms | 16ms | 64ms | 256ms | 1s | 4s | 16s | gt | max |
|---|---|---|---|---|---|---|---|---|---|---|---|
| my8031.cy8_c32r64_50kio | 99.970 | 0.022 | 0.008 | nonzero | 0.015 | ||||||
| fbmy8028.cy9c_c32r64_50kio | 99.935 | 0.061 | 0.003 | nonzero | nonzero | 0.024 | |||||
| pg151.cx7_c32r64_50kio | 99.984 | 0.008 | 0.008 | nonzero | 0.012 |
Insert response time histogram: each cell has the percentage of responses that take <= the time in the header and max is the max response time in seconds. For max values in the top 25% of the range have a red background and in the bottom 25% of the range have a green background. The red background is not used when the min value is within 80% of the max value.
| dbms | 256us | 1ms | 4ms | 16ms | 64ms | 256ms | 1s | 4s | 16s | gt | max |
|---|---|---|---|---|---|---|---|---|---|---|---|
| my8031.cy8_c32r64_50kio | 99.334 | 0.665 | nonzero | 0.017 | |||||||
| fbmy8028.cy9c_c32r64_50kio | 20.909 | 79.032 | 0.053 | 0.005 | 0.026 | ||||||
| pg151.cx7_c32r64_50kio | 0.012 | 97.477 | 2.495 | 0.015 | 0.023 |
Performance metrics for the DBMS listed above. Some are normalized by throughput, others are not. Legend for results is here.
ips	qps	rps	rmbps	wps	wmbps	rpq	rkbpq	wpi	wkbpi	csps	cpups	cspq	cpupq	dbgb1	dbgb2	rss	maxop	p50	p99	tag
3987	71357	0	0.0	41.7	2.4	0.000	0.000	0.010	0.610	273517	48.8	3.833	109	20.0	116.6	22.7	0.015	8887	8761	100m.my8031.cy8_c32r64_50kio
3987	55366	0	0.0	33.3	7.2	0.000	0.000	0.008	1.845	212491	50.3	3.838	145	8.2	10.3	32.8	0.024	6952	6473	100m.fbmy8028.cy9c_c32r64_50kio
3987	136468	0	0.0	1335.2	58.7	0.000	0.000	0.335	15.067	521895	47.2	3.824	55	24.5	43.2	0.0	0.012	17310	16895	100m.pg151.cx7_c32r64_50kio
q1000.1
q1000.1: range queries with 1000 insert/s per client. Graphs for performance per 1-second interval are here.
Average throughput:

Query response time histogram: each cell has the percentage of responses that take <= the time in the header and max is the max response time in seconds. For max values in the top 25% of the range have a red background and in the bottom 25% of the range have a green background. The red background is not used when the min value is within 80% of the max value.
| dbms | 256us | 1ms | 4ms | 16ms | 64ms | 256ms | 1s | 4s | 16s | gt | max |
|---|---|---|---|---|---|---|---|---|---|---|---|
| my8031.cy8_c32r64_50kio | 99.939 | 0.049 | 0.012 | nonzero | nonzero | 0.027 | |||||
| fbmy8028.cy9c_c32r64_50kio | 99.874 | 0.120 | 0.006 | nonzero | nonzero | 0.033 | |||||
| pg151.cx7_c32r64_50kio | 99.959 | 0.023 | 0.018 | nonzero | nonzero | 0.024 |
Insert response time histogram: each cell has the percentage of responses that take <= the time in the header and max is the max response time in seconds. For max values in the top 25% of the range have a red background and in the bottom 25% of the range have a green background. The red background is not used when the min value is within 80% of the max value.
| dbms | 256us | 1ms | 4ms | 16ms | 64ms | 256ms | 1s | 4s | 16s | gt | max |
|---|---|---|---|---|---|---|---|---|---|---|---|
| my8031.cy8_c32r64_50kio | 98.882 | 1.116 | 0.002 | 0.026 | |||||||
| fbmy8028.cy9c_c32r64_50kio | 19.780 | 80.094 | 0.123 | 0.003 | 0.025 | ||||||
| pg151.cx7_c32r64_50kio | 0.558 | 94.528 | 4.866 | 0.048 | 0.032 |
Performance metrics for the DBMS listed above. Some are normalized by throughput, others are not. Legend for results is here.
ips	qps	rps	rmbps	wps	wmbps	rpq	rkbpq	wpi	wkbpi	csps	cpups	cspq	cpupq	dbgb1	dbgb2	rss	maxop	p50	p99	tag
7978	70760	0	0.0	295.8	12.4	0.000	0.000	0.037	1.596	271755	49.7	3.841	112	26.0	122.6	28.2	0.027	8839	8647	100m.my8031.cy8_c32r64_50kio
7978	54356	9	1.1	67.3	14.8	0.000	0.020	0.008	1.903	209106	51.6	3.847	152	10.2	12.0	41.8	0.033	6825	6329	100m.fbmy8028.cy9c_c32r64_50kio
7976	132486	0	0.0	1104.1	80.2	0.000	0.000	0.138	10.295	506395	47.9	3.822	58	27.8	53.3	0.0	0.024	16594	15759	100m.pg151.cx7_c32r64_50kio
l.i0
l.i0: load without secondary indexes
Performance metrics for all DBMS, not just the ones listed above. Some are normalized by throughput, others are not. Legend for results is here.
ips	qps	rps	rmbps	wps	wmbps	rpq	rkbpq	wpi	wkbpi	csps	cpups	cspq	cpupq	dbgb1	dbgb2	rss	maxop	p50	p99	tag
773196	0	0	0.0	1171.3	201.2	0.000	0.000	0.002	0.266	109876	66.2	0.142	14	5.0	101.6	9.4	0.096	115976	75219	100m.my8031.cy8_c32r64_50kio
555556	0	0	0.0	879.3	199.5	0.000	0.000	0.002	0.368	61254	59.6	0.110	17	2.6	3.3	1.3	0.065	78117	9992	100m.fbmy8028.cy9c_c32r64_50kio
937500	0	0	0.0	1651.9	379.2	0.000	0.000	0.002	0.414	93756	62.2	0.100	11	7.2	19.4	0.0	0.010	146782	75739	100m.pg151.cx7_c32r64_50kio
l.x
l.x: create secondary indexes
Performance metrics for all DBMS, not just the ones listed above. Some are normalized by throughput, others are not. Legend for results is here.
ips	qps	rps	rmbps	wps	wmbps	rpq	rkbpq	wpi	wkbpi	csps	cpups	cspq	cpupq	dbgb1	dbgb2	rss	maxop	p50	p99	tag
517931	0	2762	181.1	10131.8	493.1	0.005	0.358	0.020	0.975	61310	30.6	0.118	9	11.1	107.7	14.0	0.009	NA	NA	100m.my8031.cy8_c32r64_50kio
751000	0	2	0.1	584.7	132.0	0.000	0.000	0.001	0.180	2251	46.1	0.003	10	5.1	5.8	7.5	0.003	NA	NA	100m.fbmy8028.cy9c_c32r64_50kio
2346875	0	0	0.0	2646.1	644.5	0.000	0.000	0.001	0.281	14804	32.1	0.006	2	13.8	32.1	0.0	0.011	NA	NA	100m.pg151.cx7_c32r64_50kio
l.i1
l.i1: continue load after secondary indexes created
Performance metrics for all DBMS, not just the ones listed above. Some are normalized by throughput, others are not. Legend for results is here.
ips	qps	rps	rmbps	wps	wmbps	rpq	rkbpq	wpi	wkbpi	csps	cpups	cspq	cpupq	dbgb1	dbgb2	rss	maxop	p50	p99	tag
255102	0	3617	56.5	1955.1	236.8	0.014	0.227	0.008	0.950	93020	54.6	0.365	34	18.9	115.4	21.6	0.367	41106	649	100m.my8031.cy8_c32r64_50kio
210084	0	192	23.8	1171.7	265.2	0.001	0.116	0.006	1.293	57669	52.4	0.275	40	8.0	9.9	8.4	0.062	27920	1099	100m.fbmy8028.cy9c_c32r64_50kio
328947	0	0	0.0	1947.7	446.7	0.000	0.000	0.006	1.391	75980	55.8	0.231	27	22.8	53.2	0.0	0.036	47849	28619	100m.pg151.cx7_c32r64_50kio
q100.1
q100.1: range queries with 100 insert/s per client
Performance metrics for all DBMS, not just the ones listed above. Some are normalized by throughput, others are not. Legend for results is here.
ips	qps	rps	rmbps	wps	wmbps	rpq	rkbpq	wpi	wkbpi	csps	cpups	cspq	cpupq	dbgb1	dbgb2	rss	maxop	p50	p99	tag
797	71823	0	0.0	278.5	7.8	0.000	0.000	0.349	10.025	275942	48.6	3.842	108	19.1	115.6	21.8	0.025	9015	8886	100m.my8031.cy8_c32r64_50kio
797	56779	0	0.0	13.8	2.6	0.000	0.000	0.017	3.300	217376	49.5	3.828	139	7.2	7.4	17.8	0.007	7001	6585	100m.fbmy8028.cy9c_c32r64_50kio
797	140106	0	0.0	1096.4	28.3	0.000	0.000	1.375	36.368	535428	46.8	3.822	53	23.1	49.1	0.0	0.012	17618	17357	100m.pg151.cx7_c32r64_50kio
q500.1
q500.1: range queries with 500 insert/s per client
Performance metrics for all DBMS, not just the ones listed above. Some are normalized by throughput, others are not. Legend for results is here.
ips	qps	rps	rmbps	wps	wmbps	rpq	rkbpq	wpi	wkbpi	csps	cpups	cspq	cpupq	dbgb1	dbgb2	rss	maxop	p50	p99	tag
3987	71357	0	0.0	41.7	2.4	0.000	0.000	0.010	0.610	273517	48.8	3.833	109	20.0	116.6	22.7	0.015	8887	8761	100m.my8031.cy8_c32r64_50kio
3987	55366	0	0.0	33.3	7.2	0.000	0.000	0.008	1.845	212491	50.3	3.838	145	8.2	10.3	32.8	0.024	6952	6473	100m.fbmy8028.cy9c_c32r64_50kio
3987	136468	0	0.0	1335.2	58.7	0.000	0.000	0.335	15.067	521895	47.2	3.824	55	24.5	43.2	0.0	0.012	17310	16895	100m.pg151.cx7_c32r64_50kio
q1000.1
q1000.1: range queries with 1000 insert/s per client
Performance metrics for all DBMS, not just the ones listed above. Some are normalized by throughput, others are not. Legend for results is here.
ips	qps	rps	rmbps	wps	wmbps	rpq	rkbpq	wpi	wkbpi	csps	cpups	cspq	cpupq	dbgb1	dbgb2	rss	maxop	p50	p99	tag
7978	70760	0	0.0	295.8	12.4	0.000	0.000	0.037	1.596	271755	49.7	3.841	112	26.0	122.6	28.2	0.027	8839	8647	100m.my8031.cy8_c32r64_50kio
7978	54356	9	1.1	67.3	14.8	0.000	0.020	0.008	1.903	209106	51.6	3.847	152	10.2	12.0	41.8	0.033	6825	6329	100m.fbmy8028.cy9c_c32r64_50kio
7976	132486	0	0.0	1104.1	80.2	0.000	0.000	0.138	10.295	506395	47.9	3.822	58	27.8	53.3	0.0	0.024	16594	15759	100m.pg151.cx7_c32r64_50kio
l.i0
- l.i0: load without secondary indexes
- Legend for results is here.
- Each entry lists the percentage of responses that fit in that bucket (slower than max time for previous bucket, faster than min time for next bucket).
Insert response time histogram
256us	1ms	4ms	16ms	64ms	256ms	1s	4s	16s	gt	max	tag
0.000	97.443	2.357	0.171	0.023	0.006	0.000	0.000	0.000	0.000	0.096	my8031.cy8_c32r64_50kio
0.000	17.299	82.535	0.138	0.028	nonzero	0.000	0.000	0.000	0.000	0.065	fbmy8028.cy9c_c32r64_50kio
0.000	97.179	2.810	0.011	0.000	0.000	0.000	0.000	0.000	0.000	0.010	pg151.cx7_c32r64_50kio
l.x
- l.x: create secondary indexes
- Legend for results is here.
- Each entry lists the percentage of responses that fit in that bucket (slower than max time for previous bucket, faster than min time for next bucket).
TODO - determine whether there is data for create index response time
l.i1
- l.i1: continue load after secondary indexes created
- Legend for results is here.
- Each entry lists the percentage of responses that fit in that bucket (slower than max time for previous bucket, faster than min time for next bucket).
Insert response time histogram
256us	1ms	4ms	16ms	64ms	256ms	1s	4s	16s	gt	max	tag
0.000	0.000	99.113	0.484	0.344	0.056	0.004	0.000	0.000	0.000	0.367	my8031.cy8_c32r64_50kio
0.000	3.625	96.039	0.319	0.017	0.000	0.000	0.000	0.000	0.000	0.062	fbmy8028.cy9c_c32r64_50kio
0.000	35.963	63.912	0.083	0.042	0.000	0.000	0.000	0.000	0.000	0.036	pg151.cx7_c32r64_50kio
q100.1
- q100.1: range queries with 100 insert/s per client
- Legend for results is here.
- Each entry lists the percentage of responses that fit in that bucket (slower than max time for previous bucket, faster than min time for next bucket).
Query response time histogram
256us	1ms	4ms	16ms	64ms	256ms	1s	4s	16s	gt	max	tag
99.989	0.010	0.001	nonzero	nonzero	0.000	0.000	0.000	0.000	0.000	0.025	my8031.cy8_c32r64_50kio
99.984	0.015	0.001	nonzero	0.000	0.000	0.000	0.000	0.000	0.000	0.007	fbmy8028.cy9c_c32r64_50kio
99.997	0.002	0.001	nonzero	0.000	0.000	0.000	0.000	0.000	0.000	0.012	pg151.cx7_c32r64_50kio
Insert response time histogram
256us	1ms	4ms	16ms	64ms	256ms	1s	4s	16s	gt	max	tag
0.000	0.000	99.898	0.102	0.000	0.000	0.000	0.000	0.000	0.000	0.016	my8031.cy8_c32r64_50kio
0.000	14.149	85.839	0.012	0.000	0.000	0.000	0.000	0.000	0.000	0.009	fbmy8028.cy9c_c32r64_50kio
0.000	0.000	99.977	0.023	0.000	0.000	0.000	0.000	0.000	0.000	0.007	pg151.cx7_c32r64_50kio
q500.1
- q500.1: range queries with 500 insert/s per client
- Legend for results is here.
- Each entry lists the percentage of responses that fit in that bucket (slower than max time for previous bucket, faster than min time for next bucket).
Query response time histogram
256us	1ms	4ms	16ms	64ms	256ms	1s	4s	16s	gt	max	tag
99.970	0.022	0.008	nonzero	0.000	0.000	0.000	0.000	0.000	0.000	0.015	my8031.cy8_c32r64_50kio
99.935	0.061	0.003	nonzero	nonzero	0.000	0.000	0.000	0.000	0.000	0.024	fbmy8028.cy9c_c32r64_50kio
99.984	0.008	0.008	nonzero	0.000	0.000	0.000	0.000	0.000	0.000	0.012	pg151.cx7_c32r64_50kio
Insert response time histogram
256us	1ms	4ms	16ms	64ms	256ms	1s	4s	16s	gt	max	tag
0.000	0.000	99.334	0.665	nonzero	0.000	0.000	0.000	0.000	0.000	0.017	my8031.cy8_c32r64_50kio
0.000	20.909	79.032	0.053	0.005	0.000	0.000	0.000	0.000	0.000	0.026	fbmy8028.cy9c_c32r64_50kio
0.000	0.012	97.477	2.495	0.015	0.000	0.000	0.000	0.000	0.000	0.023	pg151.cx7_c32r64_50kio
q1000.1
- q1000.1: range queries with 1000 insert/s per client
- Legend for results is here.
- Each entry lists the percentage of responses that fit in that bucket (slower than max time for previous bucket, faster than min time for next bucket).
Query response time histogram
256us	1ms	4ms	16ms	64ms	256ms	1s	4s	16s	gt	max	tag
99.939	0.049	0.012	nonzero	nonzero	0.000	0.000	0.000	0.000	0.000	0.027	my8031.cy8_c32r64_50kio
99.874	0.120	0.006	nonzero	nonzero	0.000	0.000	0.000	0.000	0.000	0.033	fbmy8028.cy9c_c32r64_50kio
99.959	0.023	0.018	nonzero	nonzero	0.000	0.000	0.000	0.000	0.000	0.024	pg151.cx7_c32r64_50kio
Insert response time histogram
256us	1ms	4ms	16ms	64ms	256ms	1s	4s	16s	gt	max	tag
0.000	0.000	98.882	1.116	0.002	0.000	0.000	0.000	0.000	0.000	0.026	my8031.cy8_c32r64_50kio
0.000	19.780	80.094	0.123	0.003	0.000	0.000	0.000	0.000	0.000	0.025	fbmy8028.cy9c_c32r64_50kio
0.000	0.558	94.528	4.866	0.048	0.000	0.000	0.000	0.000	0.000	0.032	pg151.cx7_c32r64_50kio