Introduction
This is a report for the insert benchmark with 100M docs and 16 client(s). It is generated by scripts (bash, awk, sed) and Tufte might not be impressed. An overview of the insert benchmark is here and a short update is here. Below, by DBMS, I mean DBMS+version.config. An example is my8020.c10b40 where my means MySQL, 8020 is version 8.0.20 and c10b40 is the name for the configuration file.
The test server is an c6i.8xl with 16 cores, 16 HW threads (hyperthread disabled), 64G RAM and io2 storage (2T, 50K IOPs). The benchmark was run with 16 clients and there was 1 or 2 connections per client (1 for queries, 1 for inserts). The benchmark loads 75M rows without secondary indexes, creates secondary indexes, loads another 25M rows then does 3 read+write tests for one hour each that do queries as fast as possible with 100, 500 and then 1000 writes/second/client concurrent with the queries. The database is cached by the storage engine and the only IO is for writes. Clients and the DBMS share one server. The per-database configs are in the per-database subdirectories here.
The tested DBMS are:
- my8031.cy8_c32r64_50kio - MySQL 8.0.31 with InnoDB and the cy8_c32r64_50kio config
- fbmy8028.cy9c_c32r64_50kio - FB MySQL 8.0.28 with MyRocks and the cy9c_c32r64_50kio config
- pg151.cx7_c32r64_50kio - Postgres 15.1 and the cx7_c32r64_50kio config
Contents
- Summary
- l.i0: load without secondary indexes
- l.x: create secondary indexes
- l.i1: continue load after secondary indexes created
- q100.1: range queries with 100 insert/s per client
- q500.1: range queries with 500 insert/s per client
- q1000.1: range queries with 1000 insert/s per client
Summary
The numbers are inserts/s for l.i0 and l.i1, indexed docs (or rows) /s for l.x and queries/s for q*.2. The values are the average rate over the entire test for inserts (IPS) and queries (QPS). The range of values for IPS and QPS is split into 3 parts: bottom 25%, middle 50%, top 25%. Values in the bottom 25% have a red background, values in the top 25% have a green background and values in the middle have no color. A gray background is used for values that can be ignored because the DBMS did not sustain the target insert rate. Red backgrounds are not used when the minimum value is within 80% of the max value.
| dbms | l.i0 | l.x | l.i1 | q100.1 | q500.1 | q1000.1 |
|---|---|---|---|---|---|---|
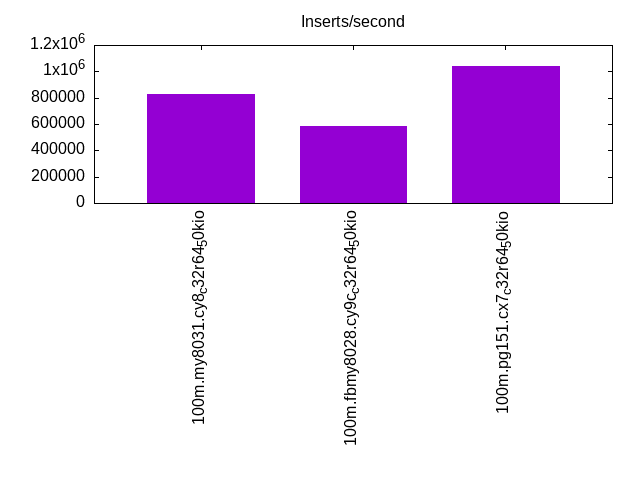
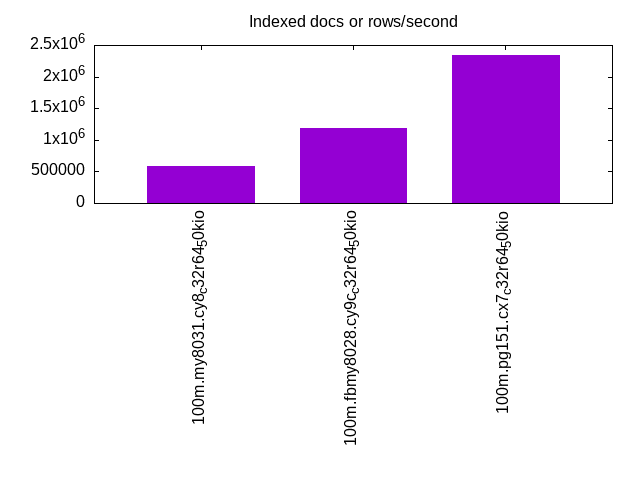
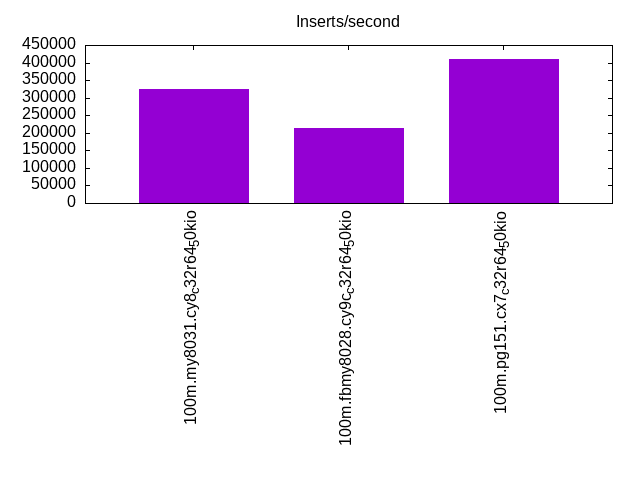
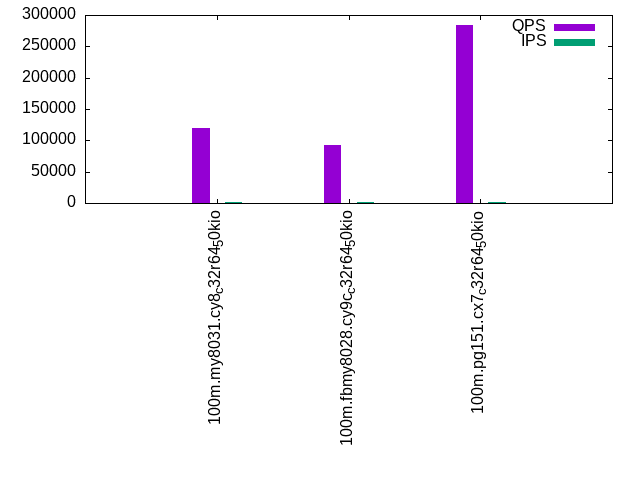
| 100m.my8031.cy8_c32r64_50kio | 824176 | 577692 | 324675 | 119519 | 117577 | 113873 |
| 100m.fbmy8028.cy9c_c32r64_50kio | 581395 | 1192063 | 213675 | 92779 | 89606 | 85140 |
| 100m.pg151.cx7_c32r64_50kio | 1041667 | 2346875 | 409836 | 284261 | 274475 | 264614 |
This lists the average rate of inserts/s for the tests that do inserts concurrent with queries. For such tests the query rate is listed in the table above. The read+write tests are setup so that the insert rate should match the target rate every second. Cells that are not at least 95% of the target have a red background to indicate a failure to satisfy the target.
| dbms | q100.1 | q500.1 | q1000.1 |
|---|---|---|---|
| my8031.cy8_c32r64_50kio | 1592 | 7958 | 15916 |
| fbmy8028.cy9c_c32r64_50kio | 1592 | 7956 | 15916 |
| pg151.cx7_c32r64_50kio | 1592 | 7958 | 15916 |
| target | 1600 | 8000 | 16000 |
l.i0
l.i0: load without secondary indexes. Graphs for performance per 1-second interval are here.
Average throughput:
Insert response time histogram: each cell has the percentage of responses that take <= the time in the header and max is the max response time in seconds. For the max column values in the top 25% of the range have a red background and in the bottom 25% of the range have a green background. The red background is not used when the min value is within 80% of the max value.
| dbms | 256us | 1ms | 4ms | 16ms | 64ms | 256ms | 1s | 4s | 16s | gt | max |
|---|---|---|---|---|---|---|---|---|---|---|---|
| my8031.cy8_c32r64_50kio | 26.575 | 72.961 | 0.411 | 0.036 | 0.017 | 0.113 | |||||
| fbmy8028.cy9c_c32r64_50kio | 7.278 | 88.931 | 3.729 | 0.060 | 0.002 | 0.120 | |||||
| pg151.cx7_c32r64_50kio | 35.926 | 63.814 | 0.176 | 0.084 | 0.039 |
Performance metrics for the DBMS listed above. Some are normalized by throughput, others are not. Legend for results is here.
ips	qps	rps	rmbps	wps	wmbps	rpq	rkbpq	wpi	wkbpi	csps	cpups	cspq	cpupq	dbgb1	dbgb2	rss	maxop	p50	p99	tag
824176	0	0	0.0	1229.5	213.4	0.000	0.000	0.001	0.265	176068	71.9	0.214	14	5.1	101.6	9.4	0.113	62433	15182	100m.my8031.cy8_c32r64_50kio
581395	0	0	0.0	911.4	207.0	0.000	0.000	0.002	0.365	77965	69.2	0.134	19	3.0	3.6	1.4	0.120	40987	21171	100m.fbmy8028.cy9c_c32r64_50kio
1041667	0	0	0.0	1839.1	425.2	0.000	0.000	0.002	0.418	75919	72.5	0.073	11	7.2	19.4	7.3	0.039	113380	28968	100m.pg151.cx7_c32r64_50kio
l.x
l.x: create secondary indexes.
Average throughput:
Performance metrics for the DBMS listed above. Some are normalized by throughput, others are not. Legend for results is here.
ips	qps	rps	rmbps	wps	wmbps	rpq	rkbpq	wpi	wkbpi	csps	cpups	cspq	cpupq	dbgb1	dbgb2	rss	maxop	p50	p99	tag
577692	0	3200	204.5	11169.6	523.3	0.006	0.363	0.019	0.928	90865	38.2	0.157	11	11.1	107.7	13.1	0.005	NA	NA	100m.my8031.cy8_c32r64_50kio
1192063	0	3	0.2	1003.4	226.1	0.000	0.000	0.001	0.194	3786	76.4	0.003	10	5.1	5.8	8.0	0.017	NA	NA	100m.fbmy8028.cy9c_c32r64_50kio
2346875	0	0	0.0	2702.5	655.7	0.000	0.000	0.001	0.286	27328	35.6	0.012	2	13.8	32.1	0.0	0.127	NA	NA	100m.pg151.cx7_c32r64_50kio
l.i1
l.i1: continue load after secondary indexes created. Graphs for performance per 1-second interval are here.
Average throughput:
Insert response time histogram: each cell has the percentage of responses that take <= the time in the header and max is the max response time in seconds. For the max column values in the top 25% of the range have a red background and in the bottom 25% of the range have a green background. The red background is not used when the min value is within 80% of the max value.
| dbms | 256us | 1ms | 4ms | 16ms | 64ms | 256ms | 1s | 4s | 16s | gt | max |
|---|---|---|---|---|---|---|---|---|---|---|---|
| my8031.cy8_c32r64_50kio | nonzero | 98.285 | 1.285 | 0.344 | 0.073 | 0.013 | 0.542 | ||||
| fbmy8028.cy9c_c32r64_50kio | 2.436 | 78.563 | 18.954 | 0.048 | 0.058 | ||||||
| pg151.cx7_c32r64_50kio | 24.201 | 74.859 | 0.602 | 0.338 | 0.055 |
Performance metrics for the DBMS listed above. Some are normalized by throughput, others are not. Legend for results is here.
ips	qps	rps	rmbps	wps	wmbps	rpq	rkbpq	wpi	wkbpi	csps	cpups	cspq	cpupq	dbgb1	dbgb2	rss	maxop	p50	p99	tag
324675	0	4549	71.1	2214.3	293.1	0.014	0.224	0.007	0.924	123077	69.2	0.379	34	19.0	115.5	21.6	0.542	25323	600	100m.my8031.cy8_c32r64_50kio
213675	0	168	20.8	1027.5	235.2	0.001	0.099	0.005	1.127	58670	53.1	0.275	40	11.3	13.2	8.7	0.058	14139	1848	100m.fbmy8028.cy9c_c32r64_50kio
409836	0	0	0.0	2389.0	552.4	0.000	0.000	0.006	1.380	79203	70.0	0.193	27	22.8	53.1	0.0	0.055	33861	9638	100m.pg151.cx7_c32r64_50kio
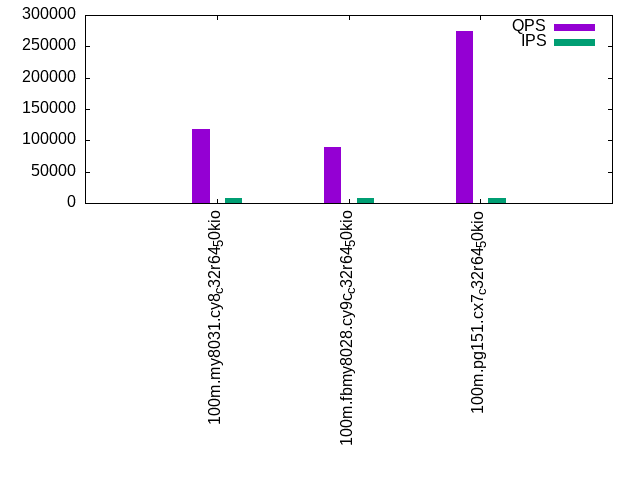
q100.1
q100.1: range queries with 100 insert/s per client. Graphs for performance per 1-second interval are here.
Average throughput:
Query response time histogram: each cell has the percentage of responses that take <= the time in the header and max is the max response time in seconds. For max values in the top 25% of the range have a red background and in the bottom 25% of the range have a green background. The red background is not used when the min value is within 80% of the max value.
| dbms | 256us | 1ms | 4ms | 16ms | 64ms | 256ms | 1s | 4s | 16s | gt | max |
|---|---|---|---|---|---|---|---|---|---|---|---|
| my8031.cy8_c32r64_50kio | 99.951 | 0.032 | 0.017 | 0.001 | nonzero | 0.032 | |||||
| fbmy8028.cy9c_c32r64_50kio | 99.563 | 0.411 | 0.023 | 0.003 | nonzero | 0.028 | |||||
| pg151.cx7_c32r64_50kio | 99.970 | 0.024 | 0.006 | 0.001 | nonzero | 0.026 |
Insert response time histogram: each cell has the percentage of responses that take <= the time in the header and max is the max response time in seconds. For max values in the top 25% of the range have a red background and in the bottom 25% of the range have a green background. The red background is not used when the min value is within 80% of the max value.
| dbms | 256us | 1ms | 4ms | 16ms | 64ms | 256ms | 1s | 4s | 16s | gt | max |
|---|---|---|---|---|---|---|---|---|---|---|---|
| my8031.cy8_c32r64_50kio | 99.715 | 0.284 | 0.001 | 0.016 | |||||||
| fbmy8028.cy9c_c32r64_50kio | 26.871 | 72.799 | 0.330 | 0.016 | |||||||
| pg151.cx7_c32r64_50kio | 99.882 | 0.116 | 0.002 | 0.021 |
Performance metrics for the DBMS listed above. Some are normalized by throughput, others are not. Legend for results is here.
ips	qps	rps	rmbps	wps	wmbps	rpq	rkbpq	wpi	wkbpi	csps	cpups	cspq	cpupq	dbgb1	dbgb2	rss	maxop	p50	p99	tag
1592	119519	0	0.0	287.2	8.4	0.000	0.000	0.180	5.379	230485	95.1	1.928	127	19.4	115.9	22.0	0.032	7528	7224	100m.my8031.cy8_c32r64_50kio
1592	92779	13	0.1	20.9	4.4	0.000	0.001	0.013	2.835	178466	95.0	1.924	164	7.5	8.1	22.2	0.028	5836	4939	100m.fbmy8028.cy9c_c32r64_50kio
1592	284261	0	0.0	1327.4	41.8	0.000	0.000	0.834	26.874	544540	95.1	1.916	54	23.4	52.0	0.0	0.026	17996	17294	100m.pg151.cx7_c32r64_50kio
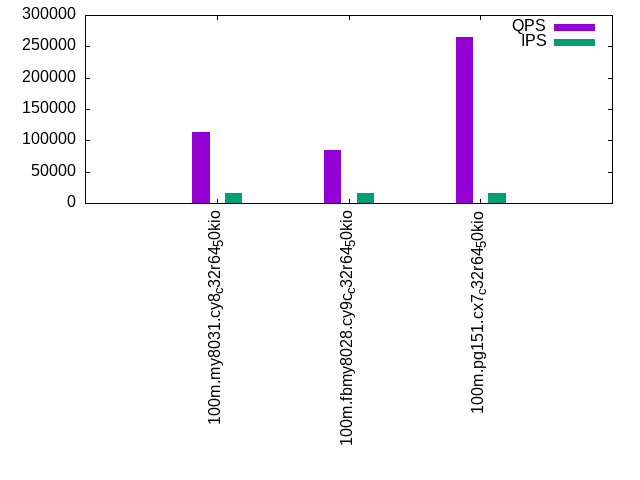
q500.1
q500.1: range queries with 500 insert/s per client. Graphs for performance per 1-second interval are here.
Average throughput:
Query response time histogram: each cell has the percentage of responses that take <= the time in the header and max is the max response time in seconds. For max values in the top 25% of the range have a red background and in the bottom 25% of the range have a green background. The red background is not used when the min value is within 80% of the max value.
| dbms | 256us | 1ms | 4ms | 16ms | 64ms | 256ms | 1s | 4s | 16s | gt | max |
|---|---|---|---|---|---|---|---|---|---|---|---|
| my8031.cy8_c32r64_50kio | 99.752 | 0.176 | 0.059 | 0.013 | nonzero | nonzero | 0.127 | ||||
| fbmy8028.cy9c_c32r64_50kio | 98.520 | 1.403 | 0.058 | 0.018 | 0.001 | nonzero | 0.076 | ||||
| pg151.cx7_c32r64_50kio | 99.969 | 0.017 | 0.008 | 0.006 | 0.001 | nonzero | 0.070 |
Insert response time histogram: each cell has the percentage of responses that take <= the time in the header and max is the max response time in seconds. For max values in the top 25% of the range have a red background and in the bottom 25% of the range have a green background. The red background is not used when the min value is within 80% of the max value.
| dbms | 256us | 1ms | 4ms | 16ms | 64ms | 256ms | 1s | 4s | 16s | gt | max |
|---|---|---|---|---|---|---|---|---|---|---|---|
| my8031.cy8_c32r64_50kio | 82.094 | 17.601 | 0.305 | nonzero | 0.065 | ||||||
| fbmy8028.cy9c_c32r64_50kio | 22.780 | 68.631 | 8.180 | 0.410 | 0.055 | ||||||
| pg151.cx7_c32r64_50kio | 6.703 | 85.989 | 5.303 | 1.957 | 0.047 | 0.150 |
Performance metrics for the DBMS listed above. Some are normalized by throughput, others are not. Legend for results is here.
ips	qps	rps	rmbps	wps	wmbps	rpq	rkbpq	wpi	wkbpi	csps	cpups	cspq	cpupq	dbgb1	dbgb2	rss	maxop	p50	p99	tag
7958	117577	0	0.0	262.8	10.1	0.000	0.000	0.033	1.297	227810	95.1	1.938	129	21.4	118.0	24.0	0.127	7419	6891	100m.my8031.cy8_c32r64_50kio
7956	89606	0	0.0	67.2	15.3	0.000	0.000	0.008	1.970	173437	94.6	1.936	169	9.5	9.8	41.7	0.076	5660	3869	100m.fbmy8028.cy9c_c32r64_50kio
7958	274475	0	0.0	1049.1	75.6	0.000	0.000	0.132	9.733	526465	95.0	1.918	55	26.3	49.7	0.0	0.070	17197	15892	100m.pg151.cx7_c32r64_50kio
q1000.1
q1000.1: range queries with 1000 insert/s per client. Graphs for performance per 1-second interval are here.
Average throughput:
Query response time histogram: each cell has the percentage of responses that take <= the time in the header and max is the max response time in seconds. For max values in the top 25% of the range have a red background and in the bottom 25% of the range have a green background. The red background is not used when the min value is within 80% of the max value.
| dbms | 256us | 1ms | 4ms | 16ms | 64ms | 256ms | 1s | 4s | 16s | gt | max |
|---|---|---|---|---|---|---|---|---|---|---|---|
| my8031.cy8_c32r64_50kio | 99.116 | 0.730 | 0.136 | 0.018 | 0.001 | 0.043 | |||||
| fbmy8028.cy9c_c32r64_50kio | 96.595 | 3.214 | 0.166 | 0.023 | 0.002 | 0.061 | |||||
| pg151.cx7_c32r64_50kio | 99.903 | 0.034 | 0.053 | 0.006 | 0.004 | nonzero | 0.089 |
Insert response time histogram: each cell has the percentage of responses that take <= the time in the header and max is the max response time in seconds. For max values in the top 25% of the range have a red background and in the bottom 25% of the range have a green background. The red background is not used when the min value is within 80% of the max value.
| dbms | 256us | 1ms | 4ms | 16ms | 64ms | 256ms | 1s | 4s | 16s | gt | max |
|---|---|---|---|---|---|---|---|---|---|---|---|
| my8031.cy8_c32r64_50kio | 71.833 | 27.773 | 0.394 | 0.063 | |||||||
| fbmy8028.cy9c_c32r64_50kio | 9.483 | 73.386 | 16.659 | 0.473 | 0.059 | ||||||
| pg151.cx7_c32r64_50kio | 0.107 | 83.934 | 13.375 | 2.473 | 0.111 | 0.205 |
Performance metrics for the DBMS listed above. Some are normalized by throughput, others are not. Legend for results is here.
ips	qps	rps	rmbps	wps	wmbps	rpq	rkbpq	wpi	wkbpi	csps	cpups	cspq	cpupq	dbgb1	dbgb2	rss	maxop	p50	p99	tag
15916	113873	0	0.0	807.9	32.7	0.000	0.000	0.051	2.101	223838	95.1	1.966	134	37.6	134.1	38.5	0.043	7115	6315	100m.my8031.cy8_c32r64_50kio
15916	85140	0	0.0	138.5	31.4	0.000	0.000	0.009	2.021	166566	94.5	1.956	178	13.5	15.2	41.9	0.061	5450	3197	100m.fbmy8028.cy9c_c32r64_50kio
15916	264614	0	0.0	1207.0	117.8	0.000	0.000	0.076	7.579	509368	94.7	1.925	57	44.4	77.8	0.0	0.089	16526	13825	100m.pg151.cx7_c32r64_50kio
l.i0
l.i0: load without secondary indexes
Performance metrics for all DBMS, not just the ones listed above. Some are normalized by throughput, others are not. Legend for results is here.
ips	qps	rps	rmbps	wps	wmbps	rpq	rkbpq	wpi	wkbpi	csps	cpups	cspq	cpupq	dbgb1	dbgb2	rss	maxop	p50	p99	tag
824176	0	0	0.0	1229.5	213.4	0.000	0.000	0.001	0.265	176068	71.9	0.214	14	5.1	101.6	9.4	0.113	62433	15182	100m.my8031.cy8_c32r64_50kio
581395	0	0	0.0	911.4	207.0	0.000	0.000	0.002	0.365	77965	69.2	0.134	19	3.0	3.6	1.4	0.120	40987	21171	100m.fbmy8028.cy9c_c32r64_50kio
1041667	0	0	0.0	1839.1	425.2	0.000	0.000	0.002	0.418	75919	72.5	0.073	11	7.2	19.4	7.3	0.039	113380	28968	100m.pg151.cx7_c32r64_50kio
l.x
l.x: create secondary indexes
Performance metrics for all DBMS, not just the ones listed above. Some are normalized by throughput, others are not. Legend for results is here.
ips	qps	rps	rmbps	wps	wmbps	rpq	rkbpq	wpi	wkbpi	csps	cpups	cspq	cpupq	dbgb1	dbgb2	rss	maxop	p50	p99	tag
577692	0	3200	204.5	11169.6	523.3	0.006	0.363	0.019	0.928	90865	38.2	0.157	11	11.1	107.7	13.1	0.005	NA	NA	100m.my8031.cy8_c32r64_50kio
1192063	0	3	0.2	1003.4	226.1	0.000	0.000	0.001	0.194	3786	76.4	0.003	10	5.1	5.8	8.0	0.017	NA	NA	100m.fbmy8028.cy9c_c32r64_50kio
2346875	0	0	0.0	2702.5	655.7	0.000	0.000	0.001	0.286	27328	35.6	0.012	2	13.8	32.1	0.0	0.127	NA	NA	100m.pg151.cx7_c32r64_50kio
l.i1
l.i1: continue load after secondary indexes created
Performance metrics for all DBMS, not just the ones listed above. Some are normalized by throughput, others are not. Legend for results is here.
ips	qps	rps	rmbps	wps	wmbps	rpq	rkbpq	wpi	wkbpi	csps	cpups	cspq	cpupq	dbgb1	dbgb2	rss	maxop	p50	p99	tag
324675	0	4549	71.1	2214.3	293.1	0.014	0.224	0.007	0.924	123077	69.2	0.379	34	19.0	115.5	21.6	0.542	25323	600	100m.my8031.cy8_c32r64_50kio
213675	0	168	20.8	1027.5	235.2	0.001	0.099	0.005	1.127	58670	53.1	0.275	40	11.3	13.2	8.7	0.058	14139	1848	100m.fbmy8028.cy9c_c32r64_50kio
409836	0	0	0.0	2389.0	552.4	0.000	0.000	0.006	1.380	79203	70.0	0.193	27	22.8	53.1	0.0	0.055	33861	9638	100m.pg151.cx7_c32r64_50kio
q100.1
q100.1: range queries with 100 insert/s per client
Performance metrics for all DBMS, not just the ones listed above. Some are normalized by throughput, others are not. Legend for results is here.
ips	qps	rps	rmbps	wps	wmbps	rpq	rkbpq	wpi	wkbpi	csps	cpups	cspq	cpupq	dbgb1	dbgb2	rss	maxop	p50	p99	tag
1592	119519	0	0.0	287.2	8.4	0.000	0.000	0.180	5.379	230485	95.1	1.928	127	19.4	115.9	22.0	0.032	7528	7224	100m.my8031.cy8_c32r64_50kio
1592	92779	13	0.1	20.9	4.4	0.000	0.001	0.013	2.835	178466	95.0	1.924	164	7.5	8.1	22.2	0.028	5836	4939	100m.fbmy8028.cy9c_c32r64_50kio
1592	284261	0	0.0	1327.4	41.8	0.000	0.000	0.834	26.874	544540	95.1	1.916	54	23.4	52.0	0.0	0.026	17996	17294	100m.pg151.cx7_c32r64_50kio
q500.1
q500.1: range queries with 500 insert/s per client
Performance metrics for all DBMS, not just the ones listed above. Some are normalized by throughput, others are not. Legend for results is here.
ips	qps	rps	rmbps	wps	wmbps	rpq	rkbpq	wpi	wkbpi	csps	cpups	cspq	cpupq	dbgb1	dbgb2	rss	maxop	p50	p99	tag
7958	117577	0	0.0	262.8	10.1	0.000	0.000	0.033	1.297	227810	95.1	1.938	129	21.4	118.0	24.0	0.127	7419	6891	100m.my8031.cy8_c32r64_50kio
7956	89606	0	0.0	67.2	15.3	0.000	0.000	0.008	1.970	173437	94.6	1.936	169	9.5	9.8	41.7	0.076	5660	3869	100m.fbmy8028.cy9c_c32r64_50kio
7958	274475	0	0.0	1049.1	75.6	0.000	0.000	0.132	9.733	526465	95.0	1.918	55	26.3	49.7	0.0	0.070	17197	15892	100m.pg151.cx7_c32r64_50kio
q1000.1
q1000.1: range queries with 1000 insert/s per client
Performance metrics for all DBMS, not just the ones listed above. Some are normalized by throughput, others are not. Legend for results is here.
ips	qps	rps	rmbps	wps	wmbps	rpq	rkbpq	wpi	wkbpi	csps	cpups	cspq	cpupq	dbgb1	dbgb2	rss	maxop	p50	p99	tag
15916	113873	0	0.0	807.9	32.7	0.000	0.000	0.051	2.101	223838	95.1	1.966	134	37.6	134.1	38.5	0.043	7115	6315	100m.my8031.cy8_c32r64_50kio
15916	85140	0	0.0	138.5	31.4	0.000	0.000	0.009	2.021	166566	94.5	1.956	178	13.5	15.2	41.9	0.061	5450	3197	100m.fbmy8028.cy9c_c32r64_50kio
15916	264614	0	0.0	1207.0	117.8	0.000	0.000	0.076	7.579	509368	94.7	1.925	57	44.4	77.8	0.0	0.089	16526	13825	100m.pg151.cx7_c32r64_50kio
l.i0
- l.i0: load without secondary indexes
- Legend for results is here.
- Each entry lists the percentage of responses that fit in that bucket (slower than max time for previous bucket, faster than min time for next bucket).
Insert response time histogram
256us	1ms	4ms	16ms	64ms	256ms	1s	4s	16s	gt	max	tag
0.000	26.575	72.961	0.411	0.036	0.017	0.000	0.000	0.000	0.000	0.113	my8031.cy8_c32r64_50kio
0.000	7.278	88.931	3.729	0.060	0.002	0.000	0.000	0.000	0.000	0.120	fbmy8028.cy9c_c32r64_50kio
0.000	35.926	63.814	0.176	0.084	0.000	0.000	0.000	0.000	0.000	0.039	pg151.cx7_c32r64_50kio
l.x
- l.x: create secondary indexes
- Legend for results is here.
- Each entry lists the percentage of responses that fit in that bucket (slower than max time for previous bucket, faster than min time for next bucket).
TODO - determine whether there is data for create index response time
l.i1
- l.i1: continue load after secondary indexes created
- Legend for results is here.
- Each entry lists the percentage of responses that fit in that bucket (slower than max time for previous bucket, faster than min time for next bucket).
Insert response time histogram
256us	1ms	4ms	16ms	64ms	256ms	1s	4s	16s	gt	max	tag
0.000	nonzero	98.285	1.285	0.344	0.073	0.013	0.000	0.000	0.000	0.542	my8031.cy8_c32r64_50kio
0.000	2.436	78.563	18.954	0.048	0.000	0.000	0.000	0.000	0.000	0.058	fbmy8028.cy9c_c32r64_50kio
0.000	24.201	74.859	0.602	0.338	0.000	0.000	0.000	0.000	0.000	0.055	pg151.cx7_c32r64_50kio
q100.1
- q100.1: range queries with 100 insert/s per client
- Legend for results is here.
- Each entry lists the percentage of responses that fit in that bucket (slower than max time for previous bucket, faster than min time for next bucket).
Query response time histogram
256us	1ms	4ms	16ms	64ms	256ms	1s	4s	16s	gt	max	tag
99.951	0.032	0.017	0.001	nonzero	0.000	0.000	0.000	0.000	0.000	0.032	my8031.cy8_c32r64_50kio
99.563	0.411	0.023	0.003	nonzero	0.000	0.000	0.000	0.000	0.000	0.028	fbmy8028.cy9c_c32r64_50kio
99.970	0.024	0.006	0.001	nonzero	0.000	0.000	0.000	0.000	0.000	0.026	pg151.cx7_c32r64_50kio
Insert response time histogram
256us	1ms	4ms	16ms	64ms	256ms	1s	4s	16s	gt	max	tag
0.000	0.000	99.715	0.284	0.001	0.000	0.000	0.000	0.000	0.000	0.016	my8031.cy8_c32r64_50kio
0.000	26.871	72.799	0.330	0.000	0.000	0.000	0.000	0.000	0.000	0.016	fbmy8028.cy9c_c32r64_50kio
0.000	0.000	99.882	0.116	0.002	0.000	0.000	0.000	0.000	0.000	0.021	pg151.cx7_c32r64_50kio
q500.1
- q500.1: range queries with 500 insert/s per client
- Legend for results is here.
- Each entry lists the percentage of responses that fit in that bucket (slower than max time for previous bucket, faster than min time for next bucket).
Query response time histogram
256us	1ms	4ms	16ms	64ms	256ms	1s	4s	16s	gt	max	tag
99.752	0.176	0.059	0.013	nonzero	nonzero	0.000	0.000	0.000	0.000	0.127	my8031.cy8_c32r64_50kio
98.520	1.403	0.058	0.018	0.001	nonzero	0.000	0.000	0.000	0.000	0.076	fbmy8028.cy9c_c32r64_50kio
99.969	0.017	0.008	0.006	0.001	nonzero	0.000	0.000	0.000	0.000	0.070	pg151.cx7_c32r64_50kio
Insert response time histogram
256us	1ms	4ms	16ms	64ms	256ms	1s	4s	16s	gt	max	tag
0.000	0.000	82.094	17.601	0.305	nonzero	0.000	0.000	0.000	0.000	0.065	my8031.cy8_c32r64_50kio
0.000	22.780	68.631	8.180	0.410	0.000	0.000	0.000	0.000	0.000	0.055	fbmy8028.cy9c_c32r64_50kio
0.000	6.703	85.989	5.303	1.957	0.047	0.000	0.000	0.000	0.000	0.150	pg151.cx7_c32r64_50kio
q1000.1
- q1000.1: range queries with 1000 insert/s per client
- Legend for results is here.
- Each entry lists the percentage of responses that fit in that bucket (slower than max time for previous bucket, faster than min time for next bucket).
Query response time histogram
256us	1ms	4ms	16ms	64ms	256ms	1s	4s	16s	gt	max	tag
99.116	0.730	0.136	0.018	0.001	0.000	0.000	0.000	0.000	0.000	0.043	my8031.cy8_c32r64_50kio
96.595	3.214	0.166	0.023	0.002	0.000	0.000	0.000	0.000	0.000	0.061	fbmy8028.cy9c_c32r64_50kio
99.903	0.034	0.053	0.006	0.004	nonzero	0.000	0.000	0.000	0.000	0.089	pg151.cx7_c32r64_50kio
Insert response time histogram
256us	1ms	4ms	16ms	64ms	256ms	1s	4s	16s	gt	max	tag
0.000	0.000	71.833	27.773	0.394	0.000	0.000	0.000	0.000	0.000	0.063	my8031.cy8_c32r64_50kio
0.000	9.483	73.386	16.659	0.473	0.000	0.000	0.000	0.000	0.000	0.059	fbmy8028.cy9c_c32r64_50kio
0.000	0.107	83.934	13.375	2.473	0.111	0.000	0.000	0.000	0.000	0.205	pg151.cx7_c32r64_50kio