Introduction
This is a report for the insert benchmark with 500M docs and 1 client(s). It is generated by scripts (bash, awk, sed) and Tufte might not be impressed. An overview of the insert benchmark is here and a short update is here. Below, by DBMS, I mean DBMS+version.config. An example is my8020.c10b40 where my means MySQL, 8020 is version 8.0.20 and c10b40 is the name for the configuration file.
The test server is an Intel NUC with 4 cores, 16G RAM and a Samsung 970 EVO. More details are here. Clients and the DBMS share one server. The per-database configs are in the per-database subdirectories here.
The tested DBMS are:
- fbmy5635.cy9c - FB MySQL 5.6.35 with MyRocks and the cy9c config
- fbmy8028.cy9c - FB MySQL 8.0.28 with MyRocks and the cy9c config
Contents
- Summary
- l.i0: load without secondary indexes
- l.x: create secondary indexes
- l.i1: continue load after secondary indexes created
- q100.1: range queries with 100 insert/s per client
- q500.1: range queries with 500 insert/s per client
- q1000.1: range queries with 1000 insert/s per client
Summary
The numbers are inserts/s for l.i0 and l.i1, indexed docs (or rows) /s for l.x and queries/s for q*.2. The values are the average rate over the entire test for inserts (IPS) and queries (QPS). The range of values for IPS and QPS is split into 3 parts: bottom 25%, middle 50%, top 25%. Values in the bottom 25% have a red background, values in the top 25% have a green background and values in the middle have no color. A gray background is used for values that can be ignored because the DBMS did not sustain the target insert rate. Red backgrounds are not used when the minimum value is within 80% of the max value.
| dbms | l.i0 | l.x | l.i1 | q100.1 | q500.1 | q1000.1 |
|---|---|---|---|---|---|---|
| 500m.fbmy5635.cy9c | 106519 | 102040 | 42194 | 4668 | 4718 | 4680 |
| 500m.fbmy8028.cy9c | 73271 | 87141 | 34130 | 4357 | 4349 | 4277 |
This lists the average rate of inserts/s for the tests that do inserts concurrent with queries. For such tests the query rate is listed in the table above. The read+write tests are setup so that the insert rate should match the target rate every second. Cells that are not at least 95% of the target have a red background to indicate a failure to satisfy the target.
| dbms | q100.1 | q500.1 | q1000.1 |
|---|---|---|---|
| fbmy5635.cy9c | 100 | 499 | 999 |
| fbmy8028.cy9c | 100 | 499 | 999 |
| target | 100 | 500 | 1000 |
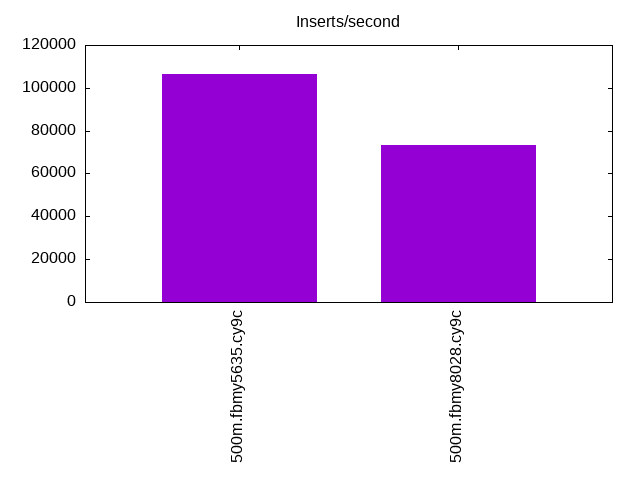
l.i0
l.i0: load without secondary indexes. Graphs for performance per 1-second interval are here.
Average throughput:
Insert response time histogram: each cell has the percentage of responses that take <= the time in the header and max is the max response time in seconds. For the max column values in the top 25% of the range have a red background and in the bottom 25% of the range have a green background. The red background is not used when the min value is within 80% of the max value.
| dbms | 256us | 1ms | 4ms | 16ms | 64ms | 256ms | 1s | 4s | 16s | gt | max |
|---|---|---|---|---|---|---|---|---|---|---|---|
| fbmy5635.cy9c | 98.252 | 1.703 | 0.042 | nonzero | 0.004 | 0.135 | |||||
| fbmy8028.cy9c | 99.824 | 0.172 | 0.004 | 0.059 |
Performance metrics for the DBMS listed above. Some are normalized by throughput, others are not. Legend for results is here.
ips	qps	rps	rmbps	wps	wmbps	rpq	rkbpq	wpi	wkbpi	csps	cpups	cspq	cpupq	dbgb1	dbgb2	rss	maxop	p50	p99	tag
106519	0	0	0.0	50.9	19.1	0.000	0.000	0.000	0.184	10629	42.9	0.100	16	15.7	16.1	1.1	0.135	107083	95494	500m.fbmy5635.cy9c
73271	0	0	0.0	50.9	16.8	0.000	0.000	0.001	0.235	7689	38.9	0.105	21	15.7	16.3	1.5	0.059	73552	68025	500m.fbmy8028.cy9c
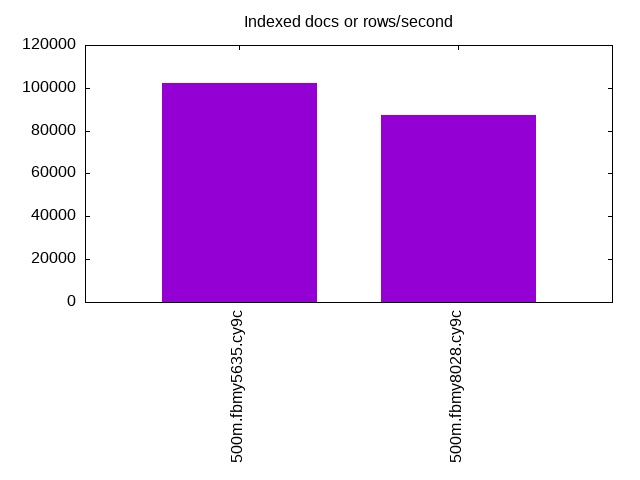
l.x
l.x: create secondary indexes.
Average throughput:
Performance metrics for the DBMS listed above. Some are normalized by throughput, others are not. Legend for results is here.
ips	qps	rps	rmbps	wps	wmbps	rpq	rkbpq	wpi	wkbpi	csps	cpups	cspq	cpupq	dbgb1	dbgb2	rss	maxop	p50	p99	tag
102040	0	65	21.7	34.5	15.0	0.001	0.218	0.000	0.150	545	24.7	0.005	10	32.3	32.7	9.7	0.008	NA	NA	500m.fbmy5635.cy9c
87141	0	56	18.7	29.9	12.8	0.001	0.220	0.000	0.150	643	24.8	0.007	11	32.2	32.8	11.0	0.004	NA	NA	500m.fbmy8028.cy9c
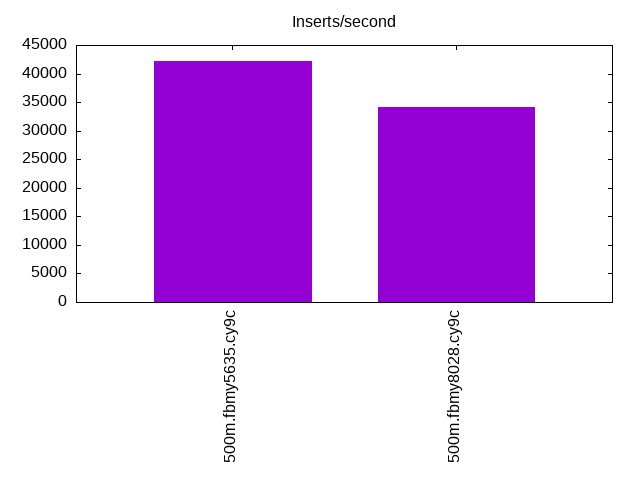
l.i1
l.i1: continue load after secondary indexes created. Graphs for performance per 1-second interval are here.
Average throughput:
Insert response time histogram: each cell has the percentage of responses that take <= the time in the header and max is the max response time in seconds. For the max column values in the top 25% of the range have a red background and in the bottom 25% of the range have a green background. The red background is not used when the min value is within 80% of the max value.
| dbms | 256us | 1ms | 4ms | 16ms | 64ms | 256ms | 1s | 4s | 16s | gt | max |
|---|---|---|---|---|---|---|---|---|---|---|---|
| fbmy5635.cy9c | 6.696 | 93.181 | 0.115 | 0.009 | 0.049 | ||||||
| fbmy8028.cy9c | 99.834 | 0.141 | 0.026 | 0.001 | 0.074 |
Performance metrics for the DBMS listed above. Some are normalized by throughput, others are not. Legend for results is here.
ips	qps	rps	rmbps	wps	wmbps	rpq	rkbpq	wpi	wkbpi	csps	cpups	cspq	cpupq	dbgb1	dbgb2	rss	maxop	p50	p99	tag
42194	0	26	3.1	125.6	74.3	0.001	0.075	0.003	1.804	10323	53.7	0.245	51	33.5	35.2	9.8	0.049	42455	36760	500m.fbmy5635.cy9c
34130	0	0	0.0	78.6	28.6	0.000	0.000	0.002	0.859	7746	39.7	0.227	47	33.5	35.3	9.8	0.074	34512	28319	500m.fbmy8028.cy9c
q100.1
q100.1: range queries with 100 insert/s per client. Graphs for performance per 1-second interval are here.
Average throughput:
Query response time histogram: each cell has the percentage of responses that take <= the time in the header and max is the max response time in seconds. For max values in the top 25% of the range have a red background and in the bottom 25% of the range have a green background. The red background is not used when the min value is within 80% of the max value.
| dbms | 256us | 1ms | 4ms | 16ms | 64ms | 256ms | 1s | 4s | 16s | gt | max |
|---|---|---|---|---|---|---|---|---|---|---|---|
| fbmy5635.cy9c | 97.297 | 2.692 | 0.007 | 0.004 | nonzero | 0.017 | |||||
| fbmy8028.cy9c | 96.404 | 3.589 | 0.001 | 0.005 | nonzero | 0.017 |
Insert response time histogram: each cell has the percentage of responses that take <= the time in the header and max is the max response time in seconds. For max values in the top 25% of the range have a red background and in the bottom 25% of the range have a green background. The red background is not used when the min value is within 80% of the max value.
| dbms | 256us | 1ms | 4ms | 16ms | 64ms | 256ms | 1s | 4s | 16s | gt | max |
|---|---|---|---|---|---|---|---|---|---|---|---|
| fbmy5635.cy9c | 0.319 | 99.667 | 0.014 | 0.007 | |||||||
| fbmy8028.cy9c | 99.875 | 0.097 | 0.028 | 0.019 |
Performance metrics for the DBMS listed above. Some are normalized by throughput, others are not. Legend for results is here.
ips	qps	rps	rmbps	wps	wmbps	rpq	rkbpq	wpi	wkbpi	csps	cpups	cspq	cpupq	dbgb1	dbgb2	rss	maxop	p50	p99	tag
100	4668	58	0.5	4.1	0.4	0.012	0.102	0.041	4.160	18070	25.2	3.871	216	33.5	35.2	9.8	0.017	4715	3628	500m.fbmy5635.cy9c
100	4357	58	0.5	3.5	0.3	0.013	0.109	0.036	2.881	17012	25.3	3.905	232	33.5	35.4	9.8	0.017	4459	3324	500m.fbmy8028.cy9c
q500.1
q500.1: range queries with 500 insert/s per client. Graphs for performance per 1-second interval are here.
Average throughput:
Query response time histogram: each cell has the percentage of responses that take <= the time in the header and max is the max response time in seconds. For max values in the top 25% of the range have a red background and in the bottom 25% of the range have a green background. The red background is not used when the min value is within 80% of the max value.
| dbms | 256us | 1ms | 4ms | 16ms | 64ms | 256ms | 1s | 4s | 16s | gt | max |
|---|---|---|---|---|---|---|---|---|---|---|---|
| fbmy5635.cy9c | 98.214 | 1.784 | 0.002 | nonzero | 0.015 | ||||||
| fbmy8028.cy9c | 96.792 | 3.205 | 0.002 | nonzero | 0.015 |
Insert response time histogram: each cell has the percentage of responses that take <= the time in the header and max is the max response time in seconds. For max values in the top 25% of the range have a red background and in the bottom 25% of the range have a green background. The red background is not used when the min value is within 80% of the max value.
| dbms | 256us | 1ms | 4ms | 16ms | 64ms | 256ms | 1s | 4s | 16s | gt | max |
|---|---|---|---|---|---|---|---|---|---|---|---|
| fbmy5635.cy9c | 2.653 | 97.303 | 0.042 | 0.003 | 0.028 | ||||||
| fbmy8028.cy9c | 99.886 | 0.075 | 0.039 | 0.019 |
Performance metrics for the DBMS listed above. Some are normalized by throughput, others are not. Legend for results is here.
ips	qps	rps	rmbps	wps	wmbps	rpq	rkbpq	wpi	wkbpi	csps	cpups	cspq	cpupq	dbgb1	dbgb2	rss	maxop	p50	p99	tag
499	4718	0	0.0	5.1	1.1	0.000	0.000	0.010	2.349	18218	26.1	3.862	221	33.7	35.6	9.8	0.015	4716	4555	500m.fbmy5635.cy9c
499	4349	0	0.0	4.3	0.6	0.000	0.007	0.009	1.261	16967	25.9	3.901	238	33.7	35.8	9.8	0.015	4349	4091	500m.fbmy8028.cy9c
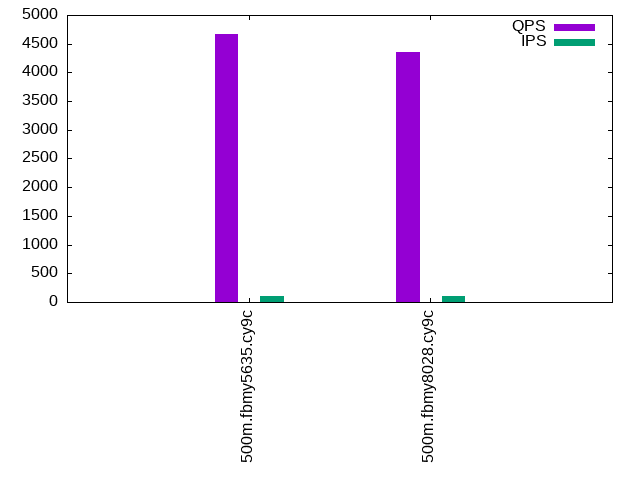
q1000.1
q1000.1: range queries with 1000 insert/s per client. Graphs for performance per 1-second interval are here.
Average throughput:
Query response time histogram: each cell has the percentage of responses that take <= the time in the header and max is the max response time in seconds. For max values in the top 25% of the range have a red background and in the bottom 25% of the range have a green background. The red background is not used when the min value is within 80% of the max value.
| dbms | 256us | 1ms | 4ms | 16ms | 64ms | 256ms | 1s | 4s | 16s | gt | max |
|---|---|---|---|---|---|---|---|---|---|---|---|
| fbmy5635.cy9c | 97.576 | 2.421 | 0.003 | nonzero | 0.015 | ||||||
| fbmy8028.cy9c | 95.504 | 4.489 | 0.007 | nonzero | 0.015 |
Insert response time histogram: each cell has the percentage of responses that take <= the time in the header and max is the max response time in seconds. For max values in the top 25% of the range have a red background and in the bottom 25% of the range have a green background. The red background is not used when the min value is within 80% of the max value.
| dbms | 256us | 1ms | 4ms | 16ms | 64ms | 256ms | 1s | 4s | 16s | gt | max |
|---|---|---|---|---|---|---|---|---|---|---|---|
| fbmy5635.cy9c | 1.846 | 98.133 | 0.019 | 0.001 | 0.032 | ||||||
| fbmy8028.cy9c | 99.896 | 0.058 | 0.046 | 0.038 |
Performance metrics for the DBMS listed above. Some are normalized by throughput, others are not. Legend for results is here.
ips	qps	rps	rmbps	wps	wmbps	rpq	rkbpq	wpi	wkbpi	csps	cpups	cspq	cpupq	dbgb1	dbgb2	rss	maxop	p50	p99	tag
999	4680	0	0.0	7.1	2.3	0.000	0.001	0.007	2.370	18189	26.7	3.887	228	34.1	34.5	10.4	0.015	4684	4491	500m.fbmy5635.cy9c
999	4277	0	0.0	5.6	1.2	0.000	0.003	0.006	1.214	16774	26.3	3.922	246	34.1	34.7	9.9	0.015	4203	4029	500m.fbmy8028.cy9c
l.i0
l.i0: load without secondary indexes
Performance metrics for all DBMS, not just the ones listed above. Some are normalized by throughput, others are not. Legend for results is here.
ips	qps	rps	rmbps	wps	wmbps	rpq	rkbpq	wpi	wkbpi	csps	cpups	cspq	cpupq	dbgb1	dbgb2	rss	maxop	p50	p99	tag
106519	0	0	0.0	50.9	19.1	0.000	0.000	0.000	0.184	10629	42.9	0.100	16	15.7	16.1	1.1	0.135	107083	95494	500m.fbmy5635.cy9c
73271	0	0	0.0	50.9	16.8	0.000	0.000	0.001	0.235	7689	38.9	0.105	21	15.7	16.3	1.5	0.059	73552	68025	500m.fbmy8028.cy9c
l.x
l.x: create secondary indexes
Performance metrics for all DBMS, not just the ones listed above. Some are normalized by throughput, others are not. Legend for results is here.
ips	qps	rps	rmbps	wps	wmbps	rpq	rkbpq	wpi	wkbpi	csps	cpups	cspq	cpupq	dbgb1	dbgb2	rss	maxop	p50	p99	tag
102040	0	65	21.7	34.5	15.0	0.001	0.218	0.000	0.150	545	24.7	0.005	10	32.3	32.7	9.7	0.008	NA	NA	500m.fbmy5635.cy9c
87141	0	56	18.7	29.9	12.8	0.001	0.220	0.000	0.150	643	24.8	0.007	11	32.2	32.8	11.0	0.004	NA	NA	500m.fbmy8028.cy9c
l.i1
l.i1: continue load after secondary indexes created
Performance metrics for all DBMS, not just the ones listed above. Some are normalized by throughput, others are not. Legend for results is here.
ips	qps	rps	rmbps	wps	wmbps	rpq	rkbpq	wpi	wkbpi	csps	cpups	cspq	cpupq	dbgb1	dbgb2	rss	maxop	p50	p99	tag
42194	0	26	3.1	125.6	74.3	0.001	0.075	0.003	1.804	10323	53.7	0.245	51	33.5	35.2	9.8	0.049	42455	36760	500m.fbmy5635.cy9c
34130	0	0	0.0	78.6	28.6	0.000	0.000	0.002	0.859	7746	39.7	0.227	47	33.5	35.3	9.8	0.074	34512	28319	500m.fbmy8028.cy9c
q100.1
q100.1: range queries with 100 insert/s per client
Performance metrics for all DBMS, not just the ones listed above. Some are normalized by throughput, others are not. Legend for results is here.
ips	qps	rps	rmbps	wps	wmbps	rpq	rkbpq	wpi	wkbpi	csps	cpups	cspq	cpupq	dbgb1	dbgb2	rss	maxop	p50	p99	tag
100	4668	58	0.5	4.1	0.4	0.012	0.102	0.041	4.160	18070	25.2	3.871	216	33.5	35.2	9.8	0.017	4715	3628	500m.fbmy5635.cy9c
100	4357	58	0.5	3.5	0.3	0.013	0.109	0.036	2.881	17012	25.3	3.905	232	33.5	35.4	9.8	0.017	4459	3324	500m.fbmy8028.cy9c
q500.1
q500.1: range queries with 500 insert/s per client
Performance metrics for all DBMS, not just the ones listed above. Some are normalized by throughput, others are not. Legend for results is here.
ips	qps	rps	rmbps	wps	wmbps	rpq	rkbpq	wpi	wkbpi	csps	cpups	cspq	cpupq	dbgb1	dbgb2	rss	maxop	p50	p99	tag
499	4718	0	0.0	5.1	1.1	0.000	0.000	0.010	2.349	18218	26.1	3.862	221	33.7	35.6	9.8	0.015	4716	4555	500m.fbmy5635.cy9c
499	4349	0	0.0	4.3	0.6	0.000	0.007	0.009	1.261	16967	25.9	3.901	238	33.7	35.8	9.8	0.015	4349	4091	500m.fbmy8028.cy9c
q1000.1
q1000.1: range queries with 1000 insert/s per client
Performance metrics for all DBMS, not just the ones listed above. Some are normalized by throughput, others are not. Legend for results is here.
ips	qps	rps	rmbps	wps	wmbps	rpq	rkbpq	wpi	wkbpi	csps	cpups	cspq	cpupq	dbgb1	dbgb2	rss	maxop	p50	p99	tag
999	4680	0	0.0	7.1	2.3	0.000	0.001	0.007	2.370	18189	26.7	3.887	228	34.1	34.5	10.4	0.015	4684	4491	500m.fbmy5635.cy9c
999	4277	0	0.0	5.6	1.2	0.000	0.003	0.006	1.214	16774	26.3	3.922	246	34.1	34.7	9.9	0.015	4203	4029	500m.fbmy8028.cy9c
l.i0
- l.i0: load without secondary indexes
- Legend for results is here.
- Each entry lists the percentage of responses that fit in that bucket (slower than max time for previous bucket, faster than min time for next bucket).
Insert response time histogram
256us	1ms	4ms	16ms	64ms	256ms	1s	4s	16s	gt	max	tag
0.000	98.252	1.703	0.042	nonzero	0.004	0.000	0.000	0.000	0.000	0.135	fbmy5635.cy9c
0.000	0.000	99.824	0.172	0.004	0.000	0.000	0.000	0.000	0.000	0.059	fbmy8028.cy9c
l.x
- l.x: create secondary indexes
- Legend for results is here.
- Each entry lists the percentage of responses that fit in that bucket (slower than max time for previous bucket, faster than min time for next bucket).
TODO - determine whether there is data for create index response time
l.i1
- l.i1: continue load after secondary indexes created
- Legend for results is here.
- Each entry lists the percentage of responses that fit in that bucket (slower than max time for previous bucket, faster than min time for next bucket).
Insert response time histogram
256us	1ms	4ms	16ms	64ms	256ms	1s	4s	16s	gt	max	tag
0.000	6.696	93.181	0.115	0.009	0.000	0.000	0.000	0.000	0.000	0.049	fbmy5635.cy9c
0.000	0.000	99.834	0.141	0.026	0.001	0.000	0.000	0.000	0.000	0.074	fbmy8028.cy9c
q100.1
- q100.1: range queries with 100 insert/s per client
- Legend for results is here.
- Each entry lists the percentage of responses that fit in that bucket (slower than max time for previous bucket, faster than min time for next bucket).
Query response time histogram
256us	1ms	4ms	16ms	64ms	256ms	1s	4s	16s	gt	max	tag
97.297	2.692	0.007	0.004	nonzero	0.000	0.000	0.000	0.000	0.000	0.017	fbmy5635.cy9c
96.404	3.589	0.001	0.005	nonzero	0.000	0.000	0.000	0.000	0.000	0.017	fbmy8028.cy9c
Insert response time histogram
256us	1ms	4ms	16ms	64ms	256ms	1s	4s	16s	gt	max	tag
0.000	0.319	99.667	0.014	0.000	0.000	0.000	0.000	0.000	0.000	0.007	fbmy5635.cy9c
0.000	0.000	99.875	0.097	0.028	0.000	0.000	0.000	0.000	0.000	0.019	fbmy8028.cy9c
q500.1
- q500.1: range queries with 500 insert/s per client
- Legend for results is here.
- Each entry lists the percentage of responses that fit in that bucket (slower than max time for previous bucket, faster than min time for next bucket).
Query response time histogram
256us	1ms	4ms	16ms	64ms	256ms	1s	4s	16s	gt	max	tag
98.214	1.784	0.002	nonzero	0.000	0.000	0.000	0.000	0.000	0.000	0.015	fbmy5635.cy9c
96.792	3.205	0.002	nonzero	0.000	0.000	0.000	0.000	0.000	0.000	0.015	fbmy8028.cy9c
Insert response time histogram
256us	1ms	4ms	16ms	64ms	256ms	1s	4s	16s	gt	max	tag
0.000	2.653	97.303	0.042	0.003	0.000	0.000	0.000	0.000	0.000	0.028	fbmy5635.cy9c
0.000	0.000	99.886	0.075	0.039	0.000	0.000	0.000	0.000	0.000	0.019	fbmy8028.cy9c
q1000.1
- q1000.1: range queries with 1000 insert/s per client
- Legend for results is here.
- Each entry lists the percentage of responses that fit in that bucket (slower than max time for previous bucket, faster than min time for next bucket).
Query response time histogram
256us	1ms	4ms	16ms	64ms	256ms	1s	4s	16s	gt	max	tag
97.576	2.421	0.003	nonzero	0.000	0.000	0.000	0.000	0.000	0.000	0.015	fbmy5635.cy9c
95.504	4.489	0.007	nonzero	0.000	0.000	0.000	0.000	0.000	0.000	0.015	fbmy8028.cy9c
Insert response time histogram
256us	1ms	4ms	16ms	64ms	256ms	1s	4s	16s	gt	max	tag
0.000	1.846	98.133	0.019	0.001	0.000	0.000	0.000	0.000	0.000	0.032	fbmy5635.cy9c
0.000	0.000	99.896	0.058	0.046	0.000	0.000	0.000	0.000	0.000	0.038	fbmy8028.cy9c