Introduction
This is a report for the insert benchmark with 500M docs and 1 client(s). It is generated by scripts (bash, awk, sed) and Tufte might not be impressed. An overview of the insert benchmark is here and a short update is here. Below, by DBMS, I mean DBMS+version.config. An example is my8020.c10b40 where my means MySQL, 8020 is version 8.0.20 and c10b40 is the name for the configuration file.
The test server is an Intel NUC with 4 cores, 16G RAM and a Samsung 970 EVO. More details are here. Clients and the DBMS share one server. The per-database configs are in the per-database subdirectories here.
The tested DBMS are:
- pg1211.cx7 - Postgres 12.11 with the cx7 config
- pg137.cx7 - Postgres 13.7 with the cx7 config
- pg146.cx7 - Postgres 14.6 with the cx7 config
- pg151.cx7 - Postgres 15.1 with the cx7 config
Contents
- Summary
- l.i0: load without secondary indexes
- l.x: create secondary indexes
- l.i1: continue load after secondary indexes created
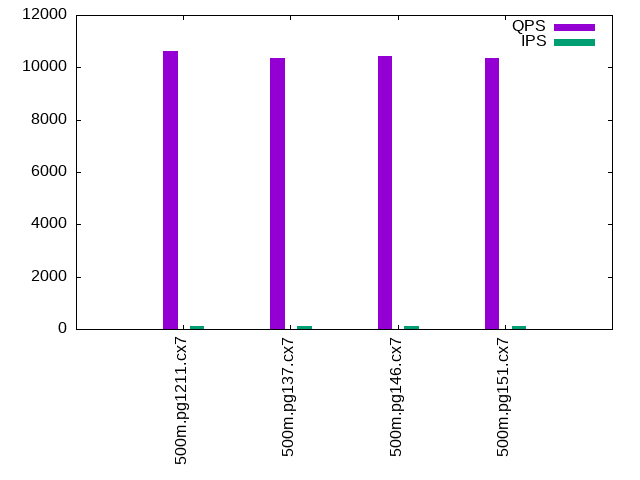
- q100.1: range queries with 100 insert/s per client
- q500.1: range queries with 500 insert/s per client
- q1000.1: range queries with 1000 insert/s per client
Summary
The numbers are inserts/s for l.i0 and l.i1, indexed docs (or rows) /s for l.x and queries/s for q*.2. The values are the average rate over the entire test for inserts (IPS) and queries (QPS). The range of values for IPS and QPS is split into 3 parts: bottom 25%, middle 50%, top 25%. Values in the bottom 25% have a red background, values in the top 25% have a green background and values in the middle have no color. A gray background is used for values that can be ignored because the DBMS did not sustain the target insert rate. Red backgrounds are not used when the minimum value is within 80% of the max value.
| dbms | l.i0 | l.x | l.i1 | q100.1 | q500.1 | q1000.1 |
|---|---|---|---|---|---|---|
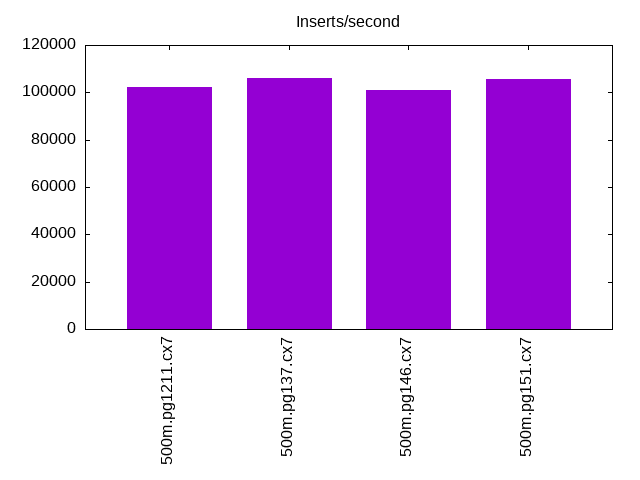
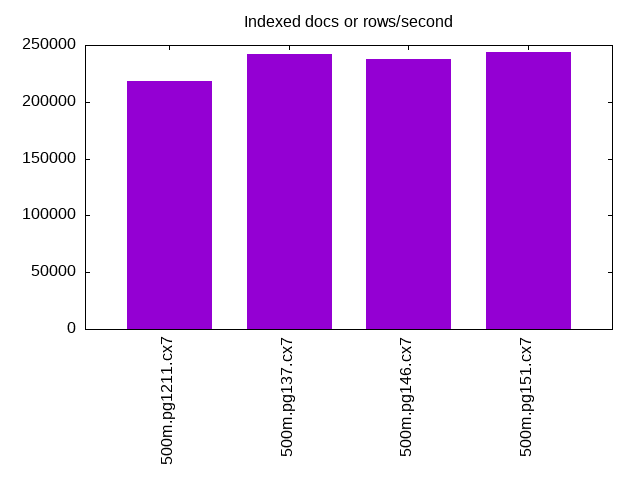
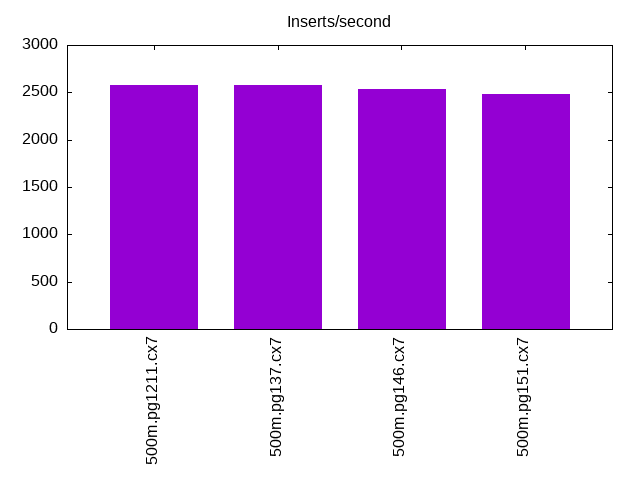
| 500m.pg1211.cx7 | 102438 | 218289 | 2573 | 10625 | 10559 | 10466 |
| 500m.pg137.cx7 | 105910 | 242179 | 2573 | 10338 | 10757 | 10669 |
| 500m.pg146.cx7 | 101071 | 238030 | 2533 | 10447 | 10548 | 10469 |
| 500m.pg151.cx7 | 105552 | 243595 | 2484 | 10339 | 10628 | 10509 |
This lists the average rate of inserts/s for the tests that do inserts concurrent with queries. For such tests the query rate is listed in the table above. The read+write tests are setup so that the insert rate should match the target rate every second. Cells that are not at least 95% of the target have a red background to indicate a failure to satisfy the target.
| dbms | q100.1 | q500.1 | q1000.1 |
|---|---|---|---|
| pg1211.cx7 | 100 | 499 | 999 |
| pg137.cx7 | 100 | 499 | 999 |
| pg146.cx7 | 100 | 499 | 999 |
| pg151.cx7 | 100 | 500 | 999 |
| target | 100 | 500 | 1000 |
l.i0
l.i0: load without secondary indexes. Graphs for performance per 1-second interval are here.
Average throughput:
Insert response time histogram: each cell has the percentage of responses that take <= the time in the header and max is the max response time in seconds. For the max column values in the top 25% of the range have a red background and in the bottom 25% of the range have a green background. The red background is not used when the min value is within 80% of the max value.
| dbms | 256us | 1ms | 4ms | 16ms | 64ms | 256ms | 1s | 4s | 16s | gt | max |
|---|---|---|---|---|---|---|---|---|---|---|---|
| pg1211.cx7 | 90.350 | 9.648 | 0.002 | 0.001 | 0.053 | ||||||
| pg137.cx7 | 95.853 | 4.144 | 0.003 | 0.001 | nonzero | nonzero | 0.351 | ||||
| pg146.cx7 | 86.668 | 13.329 | 0.002 | 0.001 | nonzero | 0.198 | |||||
| pg151.cx7 | 96.145 | 3.852 | 0.002 | nonzero | nonzero | 0.148 |
Performance metrics for the DBMS listed above. Some are normalized by throughput, others are not. Legend for results is here.
ips	qps	rps	rmbps	wps	wmbps	rpq	rkbpq	wpi	wkbpi	csps	cpups	cspq	cpupq	dbgb1	dbgb2	rss	maxop	p50	p99	tag
102438	0	44	0.4	193.5	39.5	0.000	0.004	0.002	0.395	12254	40.5	0.120	16	47.8	55.8	0.0	0.053	102587	97491	500m.pg1211.cx7
105910	0	38	0.3	155.7	50.4	0.000	0.003	0.001	0.487	12725	42.1	0.120	16	47.8	62.7	0.0	0.351	106482	97893	500m.pg137.cx7
101071	0	41	0.3	140.6	47.2	0.000	0.003	0.001	0.478	12109	39.9	0.120	16	47.8	62.9	0.0	0.198	101392	96133	500m.pg146.cx7
105552	0	40	0.3	142.0	48.4	0.000	0.003	0.001	0.469	12566	41.8	0.119	16	47.8	64.2	0.0	0.148	105985	97394	500m.pg151.cx7
l.x
l.x: create secondary indexes.
Average throughput:
Performance metrics for the DBMS listed above. Some are normalized by throughput, others are not. Legend for results is here.
ips	qps	rps	rmbps	wps	wmbps	rpq	rkbpq	wpi	wkbpi	csps	cpups	cspq	cpupq	dbgb1	dbgb2	rss	maxop	p50	p99	tag
218289	0	566	68.3	468.6	101.3	0.003	0.320	0.002	0.475	702	22.8	0.003	4	91.9	113.7	0.0	0.003	NA	NA	500m.pg1211.cx7
242179	0	600	73.9	202.8	79.4	0.002	0.312	0.001	0.336	571	23.6	0.002	4	91.9	109.1	0.0	0.003	NA	NA	500m.pg137.cx7
238030	0	586	72.2	194.0	75.4	0.002	0.311	0.001	0.324	554	23.0	0.002	4	91.9	109.3	0.0	0.003	NA	NA	500m.pg146.cx7
243595	0	673	83.3	213.7	88.2	0.003	0.350	0.001	0.371	622	23.1	0.003	4	91.9	109.1	0.0	0.003	NA	NA	500m.pg151.cx7
l.i1
l.i1: continue load after secondary indexes created. Graphs for performance per 1-second interval are here.
Average throughput:
Insert response time histogram: each cell has the percentage of responses that take <= the time in the header and max is the max response time in seconds. For the max column values in the top 25% of the range have a red background and in the bottom 25% of the range have a green background. The red background is not used when the min value is within 80% of the max value.
| dbms | 256us | 1ms | 4ms | 16ms | 64ms | 256ms | 1s | 4s | 16s | gt | max |
|---|---|---|---|---|---|---|---|---|---|---|---|
| pg1211.cx7 | 34.474 | 65.486 | 0.041 | 0.172 | |||||||
| pg137.cx7 | 34.464 | 65.372 | 0.165 | 0.161 | |||||||
| pg146.cx7 | 32.553 | 67.358 | 0.090 | 0.135 | |||||||
| pg151.cx7 | 31.594 | 68.210 | 0.196 | 0.147 |
Performance metrics for the DBMS listed above. Some are normalized by throughput, others are not. Legend for results is here.
ips	qps	rps	rmbps	wps	wmbps	rpq	rkbpq	wpi	wkbpi	csps	cpups	cspq	cpupq	dbgb1	dbgb2	rss	maxop	p50	p99	tag
2573	0	3438	27.5	4314.6	68.3	1.336	10.944	1.677	27.197	8005	22.0	3.112	342	93.6	113.2	0.0	0.172	2597	1548	500m.pg1211.cx7
2573	0	3480	27.8	4402.5	70.6	1.353	11.078	1.711	28.103	8129	22.1	3.160	344	93.6	114.4	0.0	0.161	2597	1548	500m.pg137.cx7
2533	0	3405	27.2	4300.4	69.0	1.344	11.012	1.698	27.901	7908	22.0	3.122	347	93.6	119.6	0.0	0.135	2549	1348	500m.pg146.cx7
2484	0	3346	26.8	4244.7	68.2	1.347	11.042	1.709	28.105	7785	22.1	3.134	356	93.6	119.4	0.0	0.147	2547	1248	500m.pg151.cx7
q100.1
q100.1: range queries with 100 insert/s per client. Graphs for performance per 1-second interval are here.
Average throughput:
Query response time histogram: each cell has the percentage of responses that take <= the time in the header and max is the max response time in seconds. For max values in the top 25% of the range have a red background and in the bottom 25% of the range have a green background. The red background is not used when the min value is within 80% of the max value.
| dbms | 256us | 1ms | 4ms | 16ms | 64ms | 256ms | 1s | 4s | 16s | gt | max |
|---|---|---|---|---|---|---|---|---|---|---|---|
| pg1211.cx7 | 99.827 | 0.172 | 0.002 | nonzero | 0.015 | ||||||
| pg137.cx7 | 99.136 | 0.847 | 0.013 | 0.005 | nonzero | 0.050 | |||||
| pg146.cx7 | 99.547 | 0.438 | 0.013 | 0.002 | 0.015 | ||||||
| pg151.cx7 | 99.317 | 0.674 | 0.007 | 0.002 | nonzero | 0.050 |
Insert response time histogram: each cell has the percentage of responses that take <= the time in the header and max is the max response time in seconds. For max values in the top 25% of the range have a red background and in the bottom 25% of the range have a green background. The red background is not used when the min value is within 80% of the max value.
| dbms | 256us | 1ms | 4ms | 16ms | 64ms | 256ms | 1s | 4s | 16s | gt | max |
|---|---|---|---|---|---|---|---|---|---|---|---|
| pg1211.cx7 | 77.417 | 22.583 | 0.027 | ||||||||
| pg137.cx7 | 73.653 | 26.333 | 0.014 | 0.072 | |||||||
| pg146.cx7 | 92.444 | 7.556 | 0.054 | ||||||||
| pg151.cx7 | 92.472 | 7.514 | 0.014 | 0.068 |
Performance metrics for the DBMS listed above. Some are normalized by throughput, others are not. Legend for results is here.
ips	qps	rps	rmbps	wps	wmbps	rpq	rkbpq	wpi	wkbpi	csps	cpups	cspq	cpupq	dbgb1	dbgb2	rss	maxop	p50	p99	tag
100	10625	147	1.2	267.1	4.2	0.014	0.113	2.677	43.037	41109	25.6	3.869	96	93.7	103.3	0.0	0.015	10729	6920	500m.pg1211.cx7
100	10338	151	1.2	352.3	5.0	0.015	0.121	3.526	51.011	40011	25.7	3.870	99	93.7	106.4	0.0	0.050	10788	1790	500m.pg137.cx7
100	10447	151	1.2	393.8	5.3	0.014	0.120	3.946	54.760	40391	25.7	3.866	98	93.7	111.7	0.0	0.015	10724	2765	500m.pg146.cx7
100	10339	151	1.2	270.8	4.2	0.015	0.120	2.714	43.375	39947	25.6	3.864	99	93.7	111.1	0.0	0.050	10665	1982	500m.pg151.cx7
q500.1
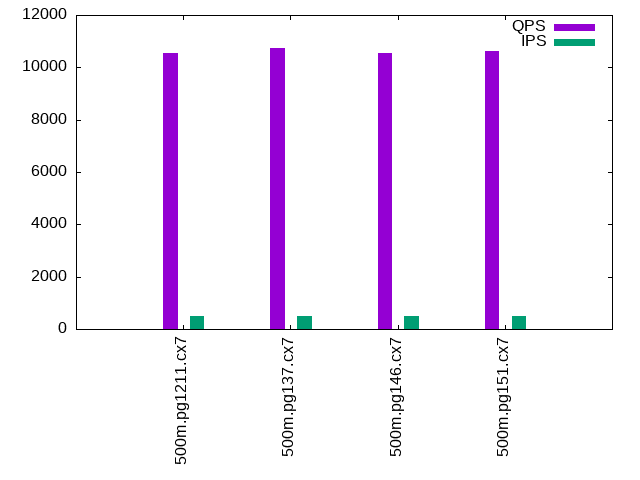
q500.1: range queries with 500 insert/s per client. Graphs for performance per 1-second interval are here.
Average throughput:
Query response time histogram: each cell has the percentage of responses that take <= the time in the header and max is the max response time in seconds. For max values in the top 25% of the range have a red background and in the bottom 25% of the range have a green background. The red background is not used when the min value is within 80% of the max value.
| dbms | 256us | 1ms | 4ms | 16ms | 64ms | 256ms | 1s | 4s | 16s | gt | max |
|---|---|---|---|---|---|---|---|---|---|---|---|
| pg1211.cx7 | 99.970 | 0.029 | 0.001 | nonzero | 0.004 | ||||||
| pg137.cx7 | 99.971 | 0.028 | 0.001 | nonzero | 0.014 | ||||||
| pg146.cx7 | 99.967 | 0.031 | 0.001 | nonzero | 0.006 | ||||||
| pg151.cx7 | 99.968 | 0.031 | 0.001 | nonzero | 0.007 |
Insert response time histogram: each cell has the percentage of responses that take <= the time in the header and max is the max response time in seconds. For max values in the top 25% of the range have a red background and in the bottom 25% of the range have a green background. The red background is not used when the min value is within 80% of the max value.
| dbms | 256us | 1ms | 4ms | 16ms | 64ms | 256ms | 1s | 4s | 16s | gt | max |
|---|---|---|---|---|---|---|---|---|---|---|---|
| pg1211.cx7 | 94.633 | 5.367 | 0.064 | ||||||||
| pg137.cx7 | 93.892 | 6.108 | 0.062 | ||||||||
| pg146.cx7 | 95.583 | 4.411 | 0.006 | 0.079 | |||||||
| pg151.cx7 | 96.236 | 3.761 | 0.003 | 0.079 |
Performance metrics for the DBMS listed above. Some are normalized by throughput, others are not. Legend for results is here.
ips	qps	rps	rmbps	wps	wmbps	rpq	rkbpq	wpi	wkbpi	csps	cpups	cspq	cpupq	dbgb1	dbgb2	rss	maxop	p50	p99	tag
499	10559	643	5.1	1054.3	17.9	0.061	0.494	2.111	36.735	41961	26.8	3.974	102	93.9	98.7	0.0	0.004	10564	10436	500m.pg1211.cx7
499	10757	644	5.1	1039.8	17.7	0.060	0.486	2.082	36.395	42705	26.8	3.970	100	93.9	99.0	0.0	0.014	10760	10617	500m.pg137.cx7
499	10548	644	5.1	985.1	17.2	0.061	0.496	1.972	35.216	41859	26.9	3.968	102	93.9	100.2	0.0	0.006	10549	10421	500m.pg146.cx7
500	10628	644	5.1	987.3	17.2	0.061	0.493	1.977	35.246	42138	26.8	3.965	101	93.9	100.2	0.0	0.007	10628	10501	500m.pg151.cx7
q1000.1
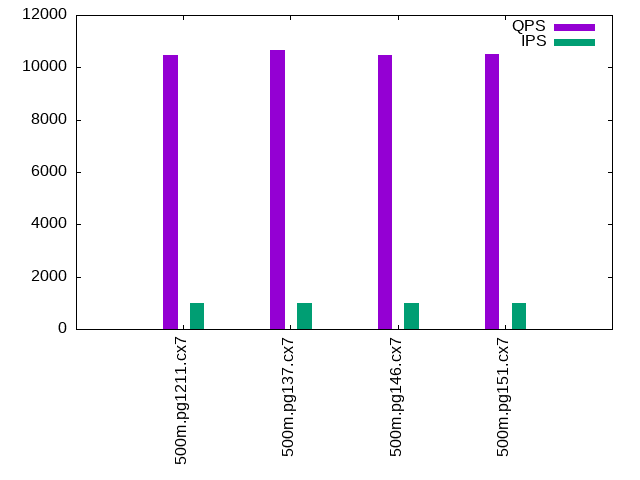
q1000.1: range queries with 1000 insert/s per client. Graphs for performance per 1-second interval are here.
Average throughput:
Query response time histogram: each cell has the percentage of responses that take <= the time in the header and max is the max response time in seconds. For max values in the top 25% of the range have a red background and in the bottom 25% of the range have a green background. The red background is not used when the min value is within 80% of the max value.
| dbms | 256us | 1ms | 4ms | 16ms | 64ms | 256ms | 1s | 4s | 16s | gt | max |
|---|---|---|---|---|---|---|---|---|---|---|---|
| pg1211.cx7 | 99.916 | 0.082 | 0.002 | nonzero | 0.015 | ||||||
| pg137.cx7 | 99.921 | 0.077 | 0.002 | nonzero | 0.015 | ||||||
| pg146.cx7 | 99.915 | 0.083 | 0.002 | nonzero | 0.009 | ||||||
| pg151.cx7 | 99.915 | 0.082 | 0.002 | nonzero | 0.009 |
Insert response time histogram: each cell has the percentage of responses that take <= the time in the header and max is the max response time in seconds. For max values in the top 25% of the range have a red background and in the bottom 25% of the range have a green background. The red background is not used when the min value is within 80% of the max value.
| dbms | 256us | 1ms | 4ms | 16ms | 64ms | 256ms | 1s | 4s | 16s | gt | max |
|---|---|---|---|---|---|---|---|---|---|---|---|
| pg1211.cx7 | 89.487 | 10.475 | 0.037 | 0.099 | |||||||
| pg137.cx7 | 89.231 | 10.746 | 0.024 | 0.095 | |||||||
| pg146.cx7 | 87.097 | 12.885 | 0.018 | 0.100 | |||||||
| pg151.cx7 | 88.372 | 11.626 | 0.001 | 0.065 |
Performance metrics for the DBMS listed above. Some are normalized by throughput, others are not. Legend for results is here.
ips	qps	rps	rmbps	wps	wmbps	rpq	rkbpq	wpi	wkbpi	csps	cpups	cspq	cpupq	dbgb1	dbgb2	rss	maxop	p50	p99	tag
999	10466	1329	10.6	1805.3	33.3	0.127	1.035	1.807	34.126	43087	28.1	4.117	107	94.9	102.3	0.0	0.015	10472	10313	500m.pg1211.cx7
999	10669	1331	10.6	1815.2	33.1	0.125	1.016	1.817	33.947	43862	28.2	4.111	106	94.9	102.3	0.0	0.015	10677	10516	500m.pg137.cx7
999	10469	1331	10.6	1795.0	32.4	0.127	1.038	1.797	33.214	43106	28.2	4.117	108	94.9	104.0	0.0	0.009	10469	10325	500m.pg146.cx7
999	10509	1339	10.7	1802.5	32.4	0.127	1.040	1.805	33.253	43219	28.1	4.113	107	94.9	104.0	0.0	0.009	10516	10373	500m.pg151.cx7
l.i0
l.i0: load without secondary indexes
Performance metrics for all DBMS, not just the ones listed above. Some are normalized by throughput, others are not. Legend for results is here.
ips	qps	rps	rmbps	wps	wmbps	rpq	rkbpq	wpi	wkbpi	csps	cpups	cspq	cpupq	dbgb1	dbgb2	rss	maxop	p50	p99	tag
102438	0	44	0.4	193.5	39.5	0.000	0.004	0.002	0.395	12254	40.5	0.120	16	47.8	55.8	0.0	0.053	102587	97491	500m.pg1211.cx7
105910	0	38	0.3	155.7	50.4	0.000	0.003	0.001	0.487	12725	42.1	0.120	16	47.8	62.7	0.0	0.351	106482	97893	500m.pg137.cx7
101071	0	41	0.3	140.6	47.2	0.000	0.003	0.001	0.478	12109	39.9	0.120	16	47.8	62.9	0.0	0.198	101392	96133	500m.pg146.cx7
105552	0	40	0.3	142.0	48.4	0.000	0.003	0.001	0.469	12566	41.8	0.119	16	47.8	64.2	0.0	0.148	105985	97394	500m.pg151.cx7
l.x
l.x: create secondary indexes
Performance metrics for all DBMS, not just the ones listed above. Some are normalized by throughput, others are not. Legend for results is here.
ips	qps	rps	rmbps	wps	wmbps	rpq	rkbpq	wpi	wkbpi	csps	cpups	cspq	cpupq	dbgb1	dbgb2	rss	maxop	p50	p99	tag
218289	0	566	68.3	468.6	101.3	0.003	0.320	0.002	0.475	702	22.8	0.003	4	91.9	113.7	0.0	0.003	NA	NA	500m.pg1211.cx7
242179	0	600	73.9	202.8	79.4	0.002	0.312	0.001	0.336	571	23.6	0.002	4	91.9	109.1	0.0	0.003	NA	NA	500m.pg137.cx7
238030	0	586	72.2	194.0	75.4	0.002	0.311	0.001	0.324	554	23.0	0.002	4	91.9	109.3	0.0	0.003	NA	NA	500m.pg146.cx7
243595	0	673	83.3	213.7	88.2	0.003	0.350	0.001	0.371	622	23.1	0.003	4	91.9	109.1	0.0	0.003	NA	NA	500m.pg151.cx7
l.i1
l.i1: continue load after secondary indexes created
Performance metrics for all DBMS, not just the ones listed above. Some are normalized by throughput, others are not. Legend for results is here.
ips	qps	rps	rmbps	wps	wmbps	rpq	rkbpq	wpi	wkbpi	csps	cpups	cspq	cpupq	dbgb1	dbgb2	rss	maxop	p50	p99	tag
2573	0	3438	27.5	4314.6	68.3	1.336	10.944	1.677	27.197	8005	22.0	3.112	342	93.6	113.2	0.0	0.172	2597	1548	500m.pg1211.cx7
2573	0	3480	27.8	4402.5	70.6	1.353	11.078	1.711	28.103	8129	22.1	3.160	344	93.6	114.4	0.0	0.161	2597	1548	500m.pg137.cx7
2533	0	3405	27.2	4300.4	69.0	1.344	11.012	1.698	27.901	7908	22.0	3.122	347	93.6	119.6	0.0	0.135	2549	1348	500m.pg146.cx7
2484	0	3346	26.8	4244.7	68.2	1.347	11.042	1.709	28.105	7785	22.1	3.134	356	93.6	119.4	0.0	0.147	2547	1248	500m.pg151.cx7
q100.1
q100.1: range queries with 100 insert/s per client
Performance metrics for all DBMS, not just the ones listed above. Some are normalized by throughput, others are not. Legend for results is here.
ips	qps	rps	rmbps	wps	wmbps	rpq	rkbpq	wpi	wkbpi	csps	cpups	cspq	cpupq	dbgb1	dbgb2	rss	maxop	p50	p99	tag
100	10625	147	1.2	267.1	4.2	0.014	0.113	2.677	43.037	41109	25.6	3.869	96	93.7	103.3	0.0	0.015	10729	6920	500m.pg1211.cx7
100	10338	151	1.2	352.3	5.0	0.015	0.121	3.526	51.011	40011	25.7	3.870	99	93.7	106.4	0.0	0.050	10788	1790	500m.pg137.cx7
100	10447	151	1.2	393.8	5.3	0.014	0.120	3.946	54.760	40391	25.7	3.866	98	93.7	111.7	0.0	0.015	10724	2765	500m.pg146.cx7
100	10339	151	1.2	270.8	4.2	0.015	0.120	2.714	43.375	39947	25.6	3.864	99	93.7	111.1	0.0	0.050	10665	1982	500m.pg151.cx7
q500.1
q500.1: range queries with 500 insert/s per client
Performance metrics for all DBMS, not just the ones listed above. Some are normalized by throughput, others are not. Legend for results is here.
ips	qps	rps	rmbps	wps	wmbps	rpq	rkbpq	wpi	wkbpi	csps	cpups	cspq	cpupq	dbgb1	dbgb2	rss	maxop	p50	p99	tag
499	10559	643	5.1	1054.3	17.9	0.061	0.494	2.111	36.735	41961	26.8	3.974	102	93.9	98.7	0.0	0.004	10564	10436	500m.pg1211.cx7
499	10757	644	5.1	1039.8	17.7	0.060	0.486	2.082	36.395	42705	26.8	3.970	100	93.9	99.0	0.0	0.014	10760	10617	500m.pg137.cx7
499	10548	644	5.1	985.1	17.2	0.061	0.496	1.972	35.216	41859	26.9	3.968	102	93.9	100.2	0.0	0.006	10549	10421	500m.pg146.cx7
500	10628	644	5.1	987.3	17.2	0.061	0.493	1.977	35.246	42138	26.8	3.965	101	93.9	100.2	0.0	0.007	10628	10501	500m.pg151.cx7
q1000.1
q1000.1: range queries with 1000 insert/s per client
Performance metrics for all DBMS, not just the ones listed above. Some are normalized by throughput, others are not. Legend for results is here.
ips	qps	rps	rmbps	wps	wmbps	rpq	rkbpq	wpi	wkbpi	csps	cpups	cspq	cpupq	dbgb1	dbgb2	rss	maxop	p50	p99	tag
999	10466	1329	10.6	1805.3	33.3	0.127	1.035	1.807	34.126	43087	28.1	4.117	107	94.9	102.3	0.0	0.015	10472	10313	500m.pg1211.cx7
999	10669	1331	10.6	1815.2	33.1	0.125	1.016	1.817	33.947	43862	28.2	4.111	106	94.9	102.3	0.0	0.015	10677	10516	500m.pg137.cx7
999	10469	1331	10.6	1795.0	32.4	0.127	1.038	1.797	33.214	43106	28.2	4.117	108	94.9	104.0	0.0	0.009	10469	10325	500m.pg146.cx7
999	10509	1339	10.7	1802.5	32.4	0.127	1.040	1.805	33.253	43219	28.1	4.113	107	94.9	104.0	0.0	0.009	10516	10373	500m.pg151.cx7
l.i0
- l.i0: load without secondary indexes
- Legend for results is here.
- Each entry lists the percentage of responses that fit in that bucket (slower than max time for previous bucket, faster than min time for next bucket).
Insert response time histogram
256us	1ms	4ms	16ms	64ms	256ms	1s	4s	16s	gt	max	tag
0.000	90.350	9.648	0.002	0.001	0.000	0.000	0.000	0.000	0.000	0.053	pg1211.cx7
0.000	95.853	4.144	0.003	0.001	nonzero	nonzero	0.000	0.000	0.000	0.351	pg137.cx7
0.000	86.668	13.329	0.002	0.001	nonzero	0.000	0.000	0.000	0.000	0.198	pg146.cx7
0.000	96.145	3.852	0.002	nonzero	nonzero	0.000	0.000	0.000	0.000	0.148	pg151.cx7
l.x
- l.x: create secondary indexes
- Legend for results is here.
- Each entry lists the percentage of responses that fit in that bucket (slower than max time for previous bucket, faster than min time for next bucket).
TODO - determine whether there is data for create index response time
l.i1
- l.i1: continue load after secondary indexes created
- Legend for results is here.
- Each entry lists the percentage of responses that fit in that bucket (slower than max time for previous bucket, faster than min time for next bucket).
Insert response time histogram
256us	1ms	4ms	16ms	64ms	256ms	1s	4s	16s	gt	max	tag
0.000	0.000	0.000	34.474	65.486	0.041	0.000	0.000	0.000	0.000	0.172	pg1211.cx7
0.000	0.000	0.000	34.464	65.372	0.165	0.000	0.000	0.000	0.000	0.161	pg137.cx7
0.000	0.000	0.000	32.553	67.358	0.090	0.000	0.000	0.000	0.000	0.135	pg146.cx7
0.000	0.000	0.000	31.594	68.210	0.196	0.000	0.000	0.000	0.000	0.147	pg151.cx7
q100.1
- q100.1: range queries with 100 insert/s per client
- Legend for results is here.
- Each entry lists the percentage of responses that fit in that bucket (slower than max time for previous bucket, faster than min time for next bucket).
Query response time histogram
256us	1ms	4ms	16ms	64ms	256ms	1s	4s	16s	gt	max	tag
99.827	0.172	0.002	nonzero	0.000	0.000	0.000	0.000	0.000	0.000	0.015	pg1211.cx7
99.136	0.847	0.013	0.005	nonzero	0.000	0.000	0.000	0.000	0.000	0.050	pg137.cx7
99.547	0.438	0.013	0.002	0.000	0.000	0.000	0.000	0.000	0.000	0.015	pg146.cx7
99.317	0.674	0.007	0.002	nonzero	0.000	0.000	0.000	0.000	0.000	0.050	pg151.cx7
Insert response time histogram
256us	1ms	4ms	16ms	64ms	256ms	1s	4s	16s	gt	max	tag
0.000	0.000	0.000	77.417	22.583	0.000	0.000	0.000	0.000	0.000	0.027	pg1211.cx7
0.000	0.000	0.000	73.653	26.333	0.014	0.000	0.000	0.000	0.000	0.072	pg137.cx7
0.000	0.000	0.000	92.444	7.556	0.000	0.000	0.000	0.000	0.000	0.054	pg146.cx7
0.000	0.000	0.000	92.472	7.514	0.014	0.000	0.000	0.000	0.000	0.068	pg151.cx7
q500.1
- q500.1: range queries with 500 insert/s per client
- Legend for results is here.
- Each entry lists the percentage of responses that fit in that bucket (slower than max time for previous bucket, faster than min time for next bucket).
Query response time histogram
256us	1ms	4ms	16ms	64ms	256ms	1s	4s	16s	gt	max	tag
99.970	0.029	0.001	nonzero	0.000	0.000	0.000	0.000	0.000	0.000	0.004	pg1211.cx7
99.971	0.028	0.001	nonzero	0.000	0.000	0.000	0.000	0.000	0.000	0.014	pg137.cx7
99.967	0.031	0.001	nonzero	0.000	0.000	0.000	0.000	0.000	0.000	0.006	pg146.cx7
99.968	0.031	0.001	nonzero	0.000	0.000	0.000	0.000	0.000	0.000	0.007	pg151.cx7
Insert response time histogram
256us	1ms	4ms	16ms	64ms	256ms	1s	4s	16s	gt	max	tag
0.000	0.000	0.000	94.633	5.367	0.000	0.000	0.000	0.000	0.000	0.064	pg1211.cx7
0.000	0.000	0.000	93.892	6.108	0.000	0.000	0.000	0.000	0.000	0.062	pg137.cx7
0.000	0.000	0.000	95.583	4.411	0.006	0.000	0.000	0.000	0.000	0.079	pg146.cx7
0.000	0.000	0.000	96.236	3.761	0.003	0.000	0.000	0.000	0.000	0.079	pg151.cx7
q1000.1
- q1000.1: range queries with 1000 insert/s per client
- Legend for results is here.
- Each entry lists the percentage of responses that fit in that bucket (slower than max time for previous bucket, faster than min time for next bucket).
Query response time histogram
256us	1ms	4ms	16ms	64ms	256ms	1s	4s	16s	gt	max	tag
99.916	0.082	0.002	nonzero	0.000	0.000	0.000	0.000	0.000	0.000	0.015	pg1211.cx7
99.921	0.077	0.002	nonzero	0.000	0.000	0.000	0.000	0.000	0.000	0.015	pg137.cx7
99.915	0.083	0.002	nonzero	0.000	0.000	0.000	0.000	0.000	0.000	0.009	pg146.cx7
99.915	0.082	0.002	nonzero	0.000	0.000	0.000	0.000	0.000	0.000	0.009	pg151.cx7
Insert response time histogram
256us	1ms	4ms	16ms	64ms	256ms	1s	4s	16s	gt	max	tag
0.000	0.000	0.000	89.487	10.475	0.037	0.000	0.000	0.000	0.000	0.099	pg1211.cx7
0.000	0.000	0.000	89.231	10.746	0.024	0.000	0.000	0.000	0.000	0.095	pg137.cx7
0.000	0.000	0.000	87.097	12.885	0.018	0.000	0.000	0.000	0.000	0.100	pg146.cx7
0.000	0.000	0.000	88.372	11.626	0.001	0.000	0.000	0.000	0.000	0.065	pg151.cx7