Introduction
This is a report for the insert benchmark with 500M docs and 1 client(s). It is generated by scripts (bash, awk, sed) and Tufte might not be impressed. An overview of the insert benchmark is here and a short update is here. Below, by DBMS, I mean DBMS+version.config. An example is my8020.c10b40 where my means MySQL, 8020 is version 8.0.20 and c10b40 is the name for the configuration file.
The test server is an Intel NUC with 4 cores, 16G RAM and a Samsung 970 EVO. More details are here. Clients and the DBMS share one server. The per-database configs are in the per-database subdirectories here.
The tested DBMS are:
- my5649.cy8 - MySQL 5.6.49 with InnoDB and the cy8 config
- my5735.cy8 - MySQL 5.7.35 with InnoDB and the cy8 config
- my8021.cy8 - MySQL 8.0.21 with InnoDB and the cy8 config
- my8031.cy8 - MySQL 8.0.31 with InnoDB and the cy8 config
Contents
- Summary
- l.i0: load without secondary indexes
- l.x: create secondary indexes
- l.i1: continue load after secondary indexes created
- q100.1: range queries with 100 insert/s per client
- q500.1: range queries with 500 insert/s per client
- q1000.1: range queries with 1000 insert/s per client
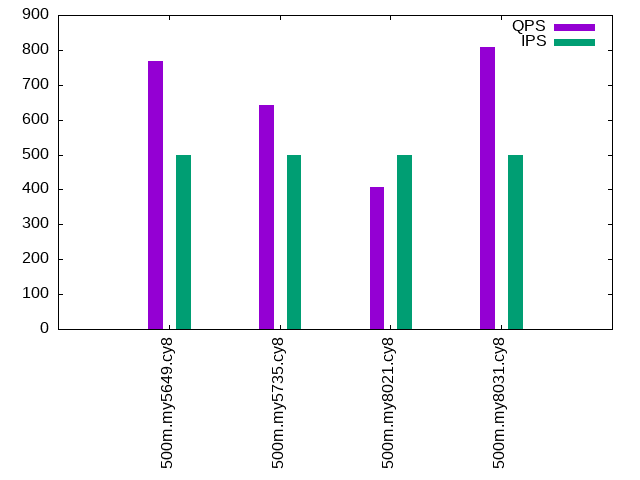
Summary
The numbers are inserts/s for l.i0 and l.i1, indexed docs (or rows) /s for l.x and queries/s for q*.2. The values are the average rate over the entire test for inserts (IPS) and queries (QPS). The range of values for IPS and QPS is split into 3 parts: bottom 25%, middle 50%, top 25%. Values in the bottom 25% have a red background, values in the top 25% have a green background and values in the middle have no color. A gray background is used for values that can be ignored because the DBMS did not sustain the target insert rate. Red backgrounds are not used when the minimum value is within 80% of the max value.
| dbms | l.i0 | l.x | l.i1 | q100.1 | q500.1 | q1000.1 |
|---|---|---|---|---|---|---|
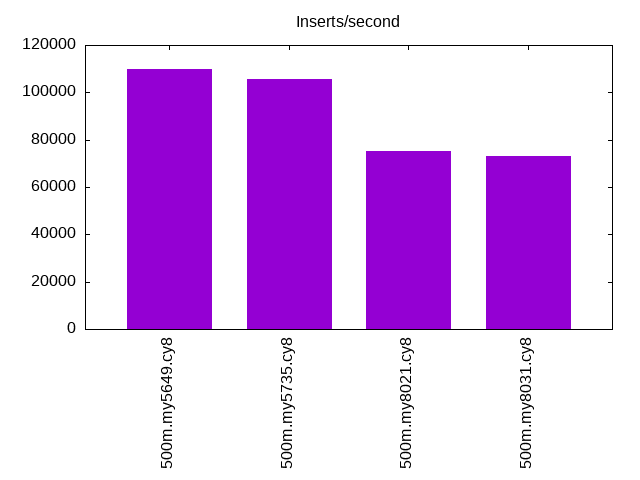
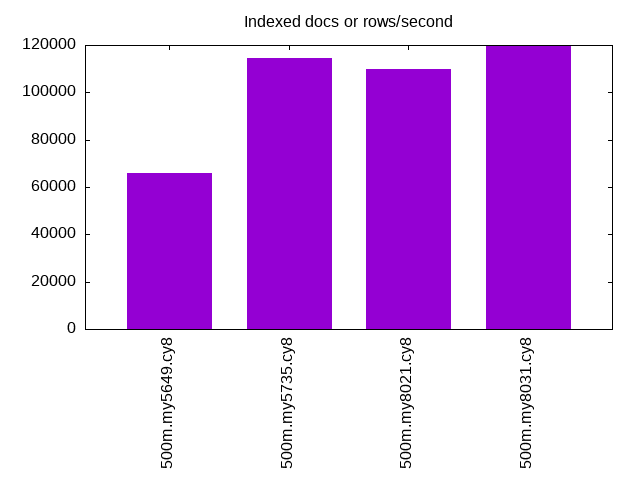
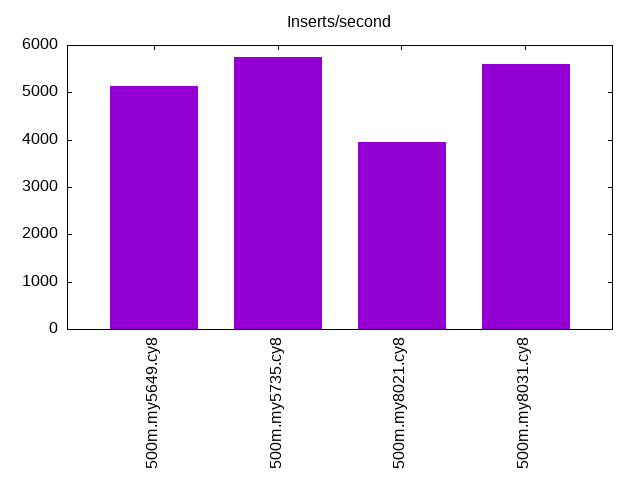
| 500m.my5649.cy8 | 109963 | 66081 | 5131 | 672 | 768 | 769 |
| 500m.my5735.cy8 | 105664 | 114466 | 5737 | 157 | 643 | 788 |
| 500m.my8021.cy8 | 75312 | 109791 | 3954 | 315 | 408 | 700 |
| 500m.my8031.cy8 | 73271 | 119784 | 5605 | 757 | 807 | 810 |
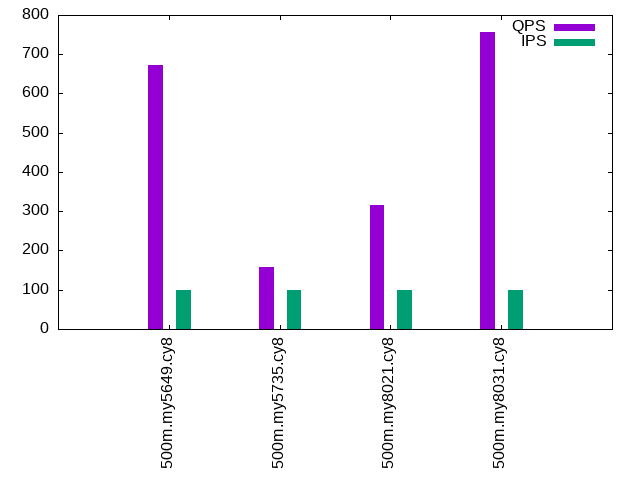
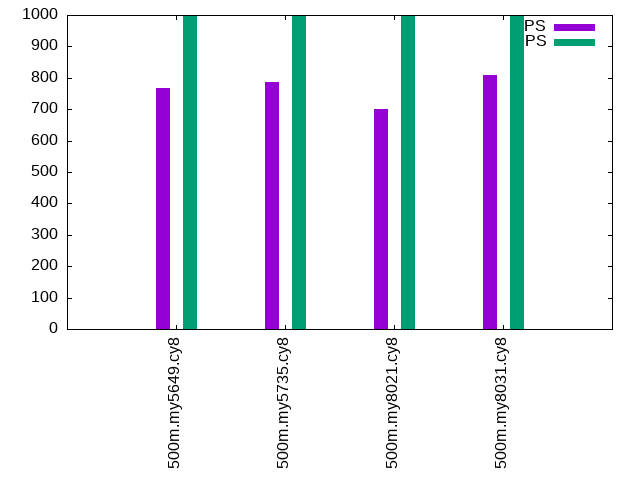
This lists the average rate of inserts/s for the tests that do inserts concurrent with queries. For such tests the query rate is listed in the table above. The read+write tests are setup so that the insert rate should match the target rate every second. Cells that are not at least 95% of the target have a red background to indicate a failure to satisfy the target.
| dbms | q100.1 | q500.1 | q1000.1 |
|---|---|---|---|
| my5649.cy8 | 100 | 499 | 999 |
| my5735.cy8 | 100 | 499 | 999 |
| my8021.cy8 | 100 | 499 | 999 |
| my8031.cy8 | 100 | 499 | 999 |
| target | 100 | 500 | 1000 |
l.i0
l.i0: load without secondary indexes. Graphs for performance per 1-second interval are here.
Average throughput:
Insert response time histogram: each cell has the percentage of responses that take <= the time in the header and max is the max response time in seconds. For the max column values in the top 25% of the range have a red background and in the bottom 25% of the range have a green background. The red background is not used when the min value is within 80% of the max value.
| dbms | 256us | 1ms | 4ms | 16ms | 64ms | 256ms | 1s | 4s | 16s | gt | max |
|---|---|---|---|---|---|---|---|---|---|---|---|
| my5649.cy8 | 96.840 | 2.765 | 0.309 | 0.083 | 0.001 | 0.003 | 0.382 | ||||
| my5735.cy8 | 98.437 | 1.327 | 0.164 | 0.069 | 0.004 | 0.138 | |||||
| my8021.cy8 | 99.569 | 0.345 | 0.086 | nonzero | 0.112 | ||||||
| my8031.cy8 | 99.627 | 0.279 | 0.093 | nonzero | 0.085 |
Performance metrics for the DBMS listed above. Some are normalized by throughput, others are not. Legend for results is here.
ips	qps	rps	rmbps	wps	wmbps	rpq	rkbpq	wpi	wkbpi	csps	cpups	cspq	cpupq	dbgb1	dbgb2	rss	maxop	p50	p99	tag
109963	0	963	3.8	438.6	36.9	0.009	0.035	0.004	0.343	13883	38.4	0.126	14	32.9	73.4	10.6	0.382	110782	76615	500m.my5649.cy8
105664	0	0	0.0	453.6	36.0	0.000	0.000	0.004	0.349	11672	40.3	0.110	15	32.9	73.4	10.9	0.138	105787	94596	500m.my5735.cy8
75312	0	0	0.0	402.9	26.9	0.000	0.000	0.005	0.366	19218	38.2	0.255	20	32.8	73.3	11.1	0.112	75232	70468	500m.my8021.cy8
73271	0	0	0.0	444.4	27.9	0.000	0.000	0.006	0.389	8531	34.2	0.116	19	32.8	35.2	11.1	0.085	73120	69025	500m.my8031.cy8
l.x
l.x: create secondary indexes.
Average throughput:
Performance metrics for the DBMS listed above. Some are normalized by throughput, others are not. Legend for results is here.
ips	qps	rps	rmbps	wps	wmbps	rpq	rkbpq	wpi	wkbpi	csps	cpups	cspq	cpupq	dbgb1	dbgb2	rss	maxop	p50	p99	tag
66081	0	406	59.1	720.2	80.7	0.006	0.916	0.011	1.251	2436	18.0	0.037	11	67.8	108.3	10.3	0.027	NA	NA	500m.my5649.cy8
114466	0	624	98.8	1107.0	126.0	0.005	0.884	0.010	1.127	6841	21.6	0.060	8	73.6	114.1	10.2	0.016	NA	NA	500m.my5735.cy8
109791	0	588	94.7	1167.0	120.8	0.005	0.883	0.011	1.127	7013	22.0	0.064	8	73.3	113.8	10.2	0.015	NA	NA	500m.my8021.cy8
119784	0	2025	173.0	2402.7	154.2	0.017	1.479	0.020	1.318	9419	69.4	0.079	23	73.3	75.7	10.4	0.015	NA	NA	500m.my8031.cy8
l.i1
l.i1: continue load after secondary indexes created. Graphs for performance per 1-second interval are here.
Average throughput:
Insert response time histogram: each cell has the percentage of responses that take <= the time in the header and max is the max response time in seconds. For the max column values in the top 25% of the range have a red background and in the bottom 25% of the range have a green background. The red background is not used when the min value is within 80% of the max value.
| dbms | 256us | 1ms | 4ms | 16ms | 64ms | 256ms | 1s | 4s | 16s | gt | max |
|---|---|---|---|---|---|---|---|---|---|---|---|
| my5649.cy8 | 70.111 | 16.309 | 11.618 | 1.623 | 0.339 | 0.001 | 2.077 | ||||
| my5735.cy8 | 66.790 | 22.668 | 9.370 | 0.865 | 0.307 | 0.623 | |||||
| my8021.cy8 | 61.567 | 22.748 | 11.469 | 4.043 | 0.174 | 0.553 | |||||
| my8031.cy8 | 65.641 | 22.502 | 10.789 | 0.816 | 0.253 | 0.579 |
Performance metrics for the DBMS listed above. Some are normalized by throughput, others are not. Legend for results is here.
ips	qps	rps	rmbps	wps	wmbps	rpq	rkbpq	wpi	wkbpi	csps	cpups	cspq	cpupq	dbgb1	dbgb2	rss	maxop	p50	p99	tag
5131	0	2671	40.7	3734.3	134.3	0.521	8.117	0.728	26.807	15569	17.5	3.034	136	101.8	144.2	10.4	2.077	1448	100	500m.my5649.cy8
5737	0	2877	44.9	4071.8	143.9	0.501	8.023	0.710	25.687	18524	22.5	3.229	157	101.8	144.3	10.6	0.623	2547	300	500m.my5735.cy8
3954	0	2008	31.4	3544.5	103.0	0.508	8.125	0.896	26.682	23052	24.4	5.830	247	101.4	143.9	10.4	0.553	1050	250	500m.my8021.cy8
5605	0	2839	44.4	5775.3	169.8	0.506	8.103	1.030	31.020	23740	23.7	4.235	169	101.4	105.8	10.6	0.579	2848	350	500m.my8031.cy8
q100.1
q100.1: range queries with 100 insert/s per client. Graphs for performance per 1-second interval are here.
Average throughput:
Query response time histogram: each cell has the percentage of responses that take <= the time in the header and max is the max response time in seconds. For max values in the top 25% of the range have a red background and in the bottom 25% of the range have a green background. The red background is not used when the min value is within 80% of the max value.
| dbms | 256us | 1ms | 4ms | 16ms | 64ms | 256ms | 1s | 4s | 16s | gt | max |
|---|---|---|---|---|---|---|---|---|---|---|---|
| my5649.cy8 | 3.322 | 46.532 | 49.340 | 0.666 | 0.137 | 0.002 | 0.114 | ||||
| my5735.cy8 | 5.061 | 27.974 | 50.109 | 2.517 | 14.303 | 0.036 | 0.143 | ||||
| my8021.cy8 | 2.389 | 37.777 | 53.601 | 1.328 | 4.898 | 0.008 | 0.138 | ||||
| my8031.cy8 | 6.929 | 40.321 | 51.906 | 0.730 | 0.111 | 0.004 | 0.133 |
Insert response time histogram: each cell has the percentage of responses that take <= the time in the header and max is the max response time in seconds. For max values in the top 25% of the range have a red background and in the bottom 25% of the range have a green background. The red background is not used when the min value is within 80% of the max value.
| dbms | 256us | 1ms | 4ms | 16ms | 64ms | 256ms | 1s | 4s | 16s | gt | max |
|---|---|---|---|---|---|---|---|---|---|---|---|
| my5649.cy8 | 2.597 | 59.431 | 37.625 | 0.347 | 0.091 | ||||||
| my5735.cy8 | 28.958 | 64.250 | 6.792 | 0.044 | |||||||
| my8021.cy8 | 4.167 | 70.903 | 24.889 | 0.042 | 0.084 | ||||||
| my8031.cy8 | 0.903 | 85.583 | 13.264 | 0.250 | 0.102 |
Performance metrics for the DBMS listed above. Some are normalized by throughput, others are not. Legend for results is here.
ips	qps	rps	rmbps	wps	wmbps	rpq	rkbpq	wpi	wkbpi	csps	cpups	cspq	cpupq	dbgb1	dbgb2	rss	maxop	p50	p99	tag
100	672	3244	50.7	608.3	18.4	4.828	77.202	6.095	188.833	10376	16.2	15.443	964	101.8	144.3	10.4	0.114	655	447	500m.my5649.cy8
100	157	834	13.0	393.4	11.8	5.319	85.097	3.942	121.386	3496	7.0	22.284	1785	101.8	144.3	10.6	0.143	64	32	500m.my5735.cy8
100	315	1574	24.6	585.6	14.7	4.992	79.865	5.867	150.659	8100	12.1	25.683	1535	101.4	143.9	10.4	0.138	80	32	500m.my8021.cy8
100	757	3631	56.7	770.8	19.3	4.796	76.740	7.724	197.979	12268	16.3	16.207	861	101.4	105.8	10.6	0.133	751	543	500m.my8031.cy8
q500.1
q500.1: range queries with 500 insert/s per client. Graphs for performance per 1-second interval are here.
Average throughput:
Query response time histogram: each cell has the percentage of responses that take <= the time in the header and max is the max response time in seconds. For max values in the top 25% of the range have a red background and in the bottom 25% of the range have a green background. The red background is not used when the min value is within 80% of the max value.
| dbms | 256us | 1ms | 4ms | 16ms | 64ms | 256ms | 1s | 4s | 16s | gt | max |
|---|---|---|---|---|---|---|---|---|---|---|---|
| my5649.cy8 | 6.499 | 43.563 | 49.456 | 0.377 | 0.105 | 0.049 | |||||
| my5735.cy8 | 11.284 | 36.922 | 50.326 | 0.525 | 0.943 | nonzero | 0.075 | ||||
| my8021.cy8 | 5.568 | 35.507 | 55.000 | 0.791 | 3.134 | 0.059 | |||||
| my8031.cy8 | 10.102 | 37.002 | 52.304 | 0.463 | 0.129 | 0.048 |
Insert response time histogram: each cell has the percentage of responses that take <= the time in the header and max is the max response time in seconds. For max values in the top 25% of the range have a red background and in the bottom 25% of the range have a green background. The red background is not used when the min value is within 80% of the max value.
| dbms | 256us | 1ms | 4ms | 16ms | 64ms | 256ms | 1s | 4s | 16s | gt | max |
|---|---|---|---|---|---|---|---|---|---|---|---|
| my5649.cy8 | 57.014 | 41.544 | 1.439 | 0.003 | 0.070 | ||||||
| my5735.cy8 | 66.539 | 33.169 | 0.292 | 0.053 | |||||||
| my8021.cy8 | 37.931 | 61.053 | 1.017 | 0.047 | |||||||
| my8031.cy8 | 53.158 | 46.147 | 0.694 | 0.040 |
Performance metrics for the DBMS listed above. Some are normalized by throughput, others are not. Legend for results is here.
ips	qps	rps	rmbps	wps	wmbps	rpq	rkbpq	wpi	wkbpi	csps	cpups	cspq	cpupq	dbgb1	dbgb2	rss	maxop	p50	p99	tag
499	768	3629	56.6	422.2	13.0	4.728	75.491	0.846	26.633	11153	15.7	14.529	818	101.9	144.4	10.4	0.049	751	591	500m.my5649.cy8
499	643	3037	47.5	477.8	14.5	4.723	75.570	0.957	29.686	9877	14.1	15.361	877	101.9	144.4	10.6	0.075	735	48	500m.my5735.cy8
499	408	1950	30.5	432.4	11.0	4.782	76.518	0.866	22.522	9430	14.3	23.123	1403	101.6	144.1	10.4	0.059	591	48	500m.my8021.cy8
499	807	3803	59.4	672.7	17.0	4.713	75.403	1.347	34.917	12501	16.6	15.491	823	101.6	105.9	10.6	0.048	799	591	500m.my8031.cy8
q1000.1
q1000.1: range queries with 1000 insert/s per client. Graphs for performance per 1-second interval are here.
Average throughput:
Query response time histogram: each cell has the percentage of responses that take <= the time in the header and max is the max response time in seconds. For max values in the top 25% of the range have a red background and in the bottom 25% of the range have a green background. The red background is not used when the min value is within 80% of the max value.
| dbms | 256us | 1ms | 4ms | 16ms | 64ms | 256ms | 1s | 4s | 16s | gt | max |
|---|---|---|---|---|---|---|---|---|---|---|---|
| my5649.cy8 | 8.403 | 40.352 | 50.719 | 0.367 | 0.159 | 0.058 | |||||
| my5735.cy8 | 13.874 | 34.101 | 51.492 | 0.392 | 0.141 | 0.060 | |||||
| my8021.cy8 | 7.345 | 35.446 | 56.626 | 0.427 | 0.156 | 0.060 | |||||
| my8031.cy8 | 12.706 | 33.650 | 52.978 | 0.499 | 0.168 | 0.060 |
Insert response time histogram: each cell has the percentage of responses that take <= the time in the header and max is the max response time in seconds. For max values in the top 25% of the range have a red background and in the bottom 25% of the range have a green background. The red background is not used when the min value is within 80% of the max value.
| dbms | 256us | 1ms | 4ms | 16ms | 64ms | 256ms | 1s | 4s | 16s | gt | max |
|---|---|---|---|---|---|---|---|---|---|---|---|
| my5649.cy8 | 74.311 | 24.900 | 0.789 | 0.050 | |||||||
| my5735.cy8 | 78.950 | 20.772 | 0.278 | 0.050 | |||||||
| my8021.cy8 | 51.644 | 47.717 | 0.637 | 0.001 | 0.066 | ||||||
| my8031.cy8 | 71.678 | 27.456 | 0.867 | 0.060 |
Performance metrics for the DBMS listed above. Some are normalized by throughput, others are not. Legend for results is here.
ips	qps	rps	rmbps	wps	wmbps	rpq	rkbpq	wpi	wkbpi	csps	cpups	cspq	cpupq	dbgb1	dbgb2	rss	maxop	p50	p99	tag
999	769	3684	57.3	656.7	20.3	4.788	76.325	0.658	20.817	12036	16.2	15.646	842	102.2	144.6	10.4	0.058	751	607	500m.my5649.cy8
999	788	3755	58.7	667.2	20.5	4.767	76.265	0.668	20.994	12441	16.9	15.794	858	102.2	144.6	10.6	0.060	783	575	500m.my5735.cy8
999	700	3342	52.2	768.8	19.7	4.778	76.442	0.770	20.153	15095	21.2	21.577	1212	101.8	144.3	10.4	0.060	688	559	500m.my8021.cy8
999	810	3855	60.2	1136.7	28.9	4.760	76.158	1.138	29.680	13966	17.4	17.244	859	101.8	106.2	10.6	0.060	799	591	500m.my8031.cy8
l.i0
l.i0: load without secondary indexes
Performance metrics for all DBMS, not just the ones listed above. Some are normalized by throughput, others are not. Legend for results is here.
ips	qps	rps	rmbps	wps	wmbps	rpq	rkbpq	wpi	wkbpi	csps	cpups	cspq	cpupq	dbgb1	dbgb2	rss	maxop	p50	p99	tag
109963	0	963	3.8	438.6	36.9	0.009	0.035	0.004	0.343	13883	38.4	0.126	14	32.9	73.4	10.6	0.382	110782	76615	500m.my5649.cy8
105664	0	0	0.0	453.6	36.0	0.000	0.000	0.004	0.349	11672	40.3	0.110	15	32.9	73.4	10.9	0.138	105787	94596	500m.my5735.cy8
75312	0	0	0.0	402.9	26.9	0.000	0.000	0.005	0.366	19218	38.2	0.255	20	32.8	73.3	11.1	0.112	75232	70468	500m.my8021.cy8
73271	0	0	0.0	444.4	27.9	0.000	0.000	0.006	0.389	8531	34.2	0.116	19	32.8	35.2	11.1	0.085	73120	69025	500m.my8031.cy8
l.x
l.x: create secondary indexes
Performance metrics for all DBMS, not just the ones listed above. Some are normalized by throughput, others are not. Legend for results is here.
ips	qps	rps	rmbps	wps	wmbps	rpq	rkbpq	wpi	wkbpi	csps	cpups	cspq	cpupq	dbgb1	dbgb2	rss	maxop	p50	p99	tag
66081	0	406	59.1	720.2	80.7	0.006	0.916	0.011	1.251	2436	18.0	0.037	11	67.8	108.3	10.3	0.027	NA	NA	500m.my5649.cy8
114466	0	624	98.8	1107.0	126.0	0.005	0.884	0.010	1.127	6841	21.6	0.060	8	73.6	114.1	10.2	0.016	NA	NA	500m.my5735.cy8
109791	0	588	94.7	1167.0	120.8	0.005	0.883	0.011	1.127	7013	22.0	0.064	8	73.3	113.8	10.2	0.015	NA	NA	500m.my8021.cy8
119784	0	2025	173.0	2402.7	154.2	0.017	1.479	0.020	1.318	9419	69.4	0.079	23	73.3	75.7	10.4	0.015	NA	NA	500m.my8031.cy8
l.i1
l.i1: continue load after secondary indexes created
Performance metrics for all DBMS, not just the ones listed above. Some are normalized by throughput, others are not. Legend for results is here.
ips	qps	rps	rmbps	wps	wmbps	rpq	rkbpq	wpi	wkbpi	csps	cpups	cspq	cpupq	dbgb1	dbgb2	rss	maxop	p50	p99	tag
5131	0	2671	40.7	3734.3	134.3	0.521	8.117	0.728	26.807	15569	17.5	3.034	136	101.8	144.2	10.4	2.077	1448	100	500m.my5649.cy8
5737	0	2877	44.9	4071.8	143.9	0.501	8.023	0.710	25.687	18524	22.5	3.229	157	101.8	144.3	10.6	0.623	2547	300	500m.my5735.cy8
3954	0	2008	31.4	3544.5	103.0	0.508	8.125	0.896	26.682	23052	24.4	5.830	247	101.4	143.9	10.4	0.553	1050	250	500m.my8021.cy8
5605	0	2839	44.4	5775.3	169.8	0.506	8.103	1.030	31.020	23740	23.7	4.235	169	101.4	105.8	10.6	0.579	2848	350	500m.my8031.cy8
q100.1
q100.1: range queries with 100 insert/s per client
Performance metrics for all DBMS, not just the ones listed above. Some are normalized by throughput, others are not. Legend for results is here.
ips	qps	rps	rmbps	wps	wmbps	rpq	rkbpq	wpi	wkbpi	csps	cpups	cspq	cpupq	dbgb1	dbgb2	rss	maxop	p50	p99	tag
100	672	3244	50.7	608.3	18.4	4.828	77.202	6.095	188.833	10376	16.2	15.443	964	101.8	144.3	10.4	0.114	655	447	500m.my5649.cy8
100	157	834	13.0	393.4	11.8	5.319	85.097	3.942	121.386	3496	7.0	22.284	1785	101.8	144.3	10.6	0.143	64	32	500m.my5735.cy8
100	315	1574	24.6	585.6	14.7	4.992	79.865	5.867	150.659	8100	12.1	25.683	1535	101.4	143.9	10.4	0.138	80	32	500m.my8021.cy8
100	757	3631	56.7	770.8	19.3	4.796	76.740	7.724	197.979	12268	16.3	16.207	861	101.4	105.8	10.6	0.133	751	543	500m.my8031.cy8
q500.1
q500.1: range queries with 500 insert/s per client
Performance metrics for all DBMS, not just the ones listed above. Some are normalized by throughput, others are not. Legend for results is here.
ips	qps	rps	rmbps	wps	wmbps	rpq	rkbpq	wpi	wkbpi	csps	cpups	cspq	cpupq	dbgb1	dbgb2	rss	maxop	p50	p99	tag
499	768	3629	56.6	422.2	13.0	4.728	75.491	0.846	26.633	11153	15.7	14.529	818	101.9	144.4	10.4	0.049	751	591	500m.my5649.cy8
499	643	3037	47.5	477.8	14.5	4.723	75.570	0.957	29.686	9877	14.1	15.361	877	101.9	144.4	10.6	0.075	735	48	500m.my5735.cy8
499	408	1950	30.5	432.4	11.0	4.782	76.518	0.866	22.522	9430	14.3	23.123	1403	101.6	144.1	10.4	0.059	591	48	500m.my8021.cy8
499	807	3803	59.4	672.7	17.0	4.713	75.403	1.347	34.917	12501	16.6	15.491	823	101.6	105.9	10.6	0.048	799	591	500m.my8031.cy8
q1000.1
q1000.1: range queries with 1000 insert/s per client
Performance metrics for all DBMS, not just the ones listed above. Some are normalized by throughput, others are not. Legend for results is here.
ips	qps	rps	rmbps	wps	wmbps	rpq	rkbpq	wpi	wkbpi	csps	cpups	cspq	cpupq	dbgb1	dbgb2	rss	maxop	p50	p99	tag
999	769	3684	57.3	656.7	20.3	4.788	76.325	0.658	20.817	12036	16.2	15.646	842	102.2	144.6	10.4	0.058	751	607	500m.my5649.cy8
999	788	3755	58.7	667.2	20.5	4.767	76.265	0.668	20.994	12441	16.9	15.794	858	102.2	144.6	10.6	0.060	783	575	500m.my5735.cy8
999	700	3342	52.2	768.8	19.7	4.778	76.442	0.770	20.153	15095	21.2	21.577	1212	101.8	144.3	10.4	0.060	688	559	500m.my8021.cy8
999	810	3855	60.2	1136.7	28.9	4.760	76.158	1.138	29.680	13966	17.4	17.244	859	101.8	106.2	10.6	0.060	799	591	500m.my8031.cy8
l.i0
- l.i0: load without secondary indexes
- Legend for results is here.
- Each entry lists the percentage of responses that fit in that bucket (slower than max time for previous bucket, faster than min time for next bucket).
Insert response time histogram
256us	1ms	4ms	16ms	64ms	256ms	1s	4s	16s	gt	max	tag
0.000	96.840	2.765	0.309	0.083	0.001	0.003	0.000	0.000	0.000	0.382	my5649.cy8
0.000	98.437	1.327	0.164	0.069	0.004	0.000	0.000	0.000	0.000	0.138	my5735.cy8
0.000	0.000	99.569	0.345	0.086	nonzero	0.000	0.000	0.000	0.000	0.112	my8021.cy8
0.000	0.000	99.627	0.279	0.093	nonzero	0.000	0.000	0.000	0.000	0.085	my8031.cy8
l.x
- l.x: create secondary indexes
- Legend for results is here.
- Each entry lists the percentage of responses that fit in that bucket (slower than max time for previous bucket, faster than min time for next bucket).
TODO - determine whether there is data for create index response time
l.i1
- l.i1: continue load after secondary indexes created
- Legend for results is here.
- Each entry lists the percentage of responses that fit in that bucket (slower than max time for previous bucket, faster than min time for next bucket).
Insert response time histogram
256us	1ms	4ms	16ms	64ms	256ms	1s	4s	16s	gt	max	tag
0.000	0.000	70.111	16.309	11.618	1.623	0.339	0.001	0.000	0.000	2.077	my5649.cy8
0.000	0.000	66.790	22.668	9.370	0.865	0.307	0.000	0.000	0.000	0.623	my5735.cy8
0.000	0.000	61.567	22.748	11.469	4.043	0.174	0.000	0.000	0.000	0.553	my8021.cy8
0.000	0.000	65.641	22.502	10.789	0.816	0.253	0.000	0.000	0.000	0.579	my8031.cy8
q100.1
- q100.1: range queries with 100 insert/s per client
- Legend for results is here.
- Each entry lists the percentage of responses that fit in that bucket (slower than max time for previous bucket, faster than min time for next bucket).
Query response time histogram
256us	1ms	4ms	16ms	64ms	256ms	1s	4s	16s	gt	max	tag
3.322	46.532	49.340	0.666	0.137	0.002	0.000	0.000	0.000	0.000	0.114	my5649.cy8
5.061	27.974	50.109	2.517	14.303	0.036	0.000	0.000	0.000	0.000	0.143	my5735.cy8
2.389	37.777	53.601	1.328	4.898	0.008	0.000	0.000	0.000	0.000	0.138	my8021.cy8
6.929	40.321	51.906	0.730	0.111	0.004	0.000	0.000	0.000	0.000	0.133	my8031.cy8
Insert response time histogram
256us	1ms	4ms	16ms	64ms	256ms	1s	4s	16s	gt	max	tag
0.000	0.000	2.597	59.431	37.625	0.347	0.000	0.000	0.000	0.000	0.091	my5649.cy8
0.000	0.000	28.958	64.250	6.792	0.000	0.000	0.000	0.000	0.000	0.044	my5735.cy8
0.000	0.000	4.167	70.903	24.889	0.042	0.000	0.000	0.000	0.000	0.084	my8021.cy8
0.000	0.000	0.903	85.583	13.264	0.250	0.000	0.000	0.000	0.000	0.102	my8031.cy8
q500.1
- q500.1: range queries with 500 insert/s per client
- Legend for results is here.
- Each entry lists the percentage of responses that fit in that bucket (slower than max time for previous bucket, faster than min time for next bucket).
Query response time histogram
256us	1ms	4ms	16ms	64ms	256ms	1s	4s	16s	gt	max	tag
6.499	43.563	49.456	0.377	0.105	0.000	0.000	0.000	0.000	0.000	0.049	my5649.cy8
11.284	36.922	50.326	0.525	0.943	nonzero	0.000	0.000	0.000	0.000	0.075	my5735.cy8
5.568	35.507	55.000	0.791	3.134	0.000	0.000	0.000	0.000	0.000	0.059	my8021.cy8
10.102	37.002	52.304	0.463	0.129	0.000	0.000	0.000	0.000	0.000	0.048	my8031.cy8
Insert response time histogram
256us	1ms	4ms	16ms	64ms	256ms	1s	4s	16s	gt	max	tag
0.000	0.000	57.014	41.544	1.439	0.003	0.000	0.000	0.000	0.000	0.070	my5649.cy8
0.000	0.000	66.539	33.169	0.292	0.000	0.000	0.000	0.000	0.000	0.053	my5735.cy8
0.000	0.000	37.931	61.053	1.017	0.000	0.000	0.000	0.000	0.000	0.047	my8021.cy8
0.000	0.000	53.158	46.147	0.694	0.000	0.000	0.000	0.000	0.000	0.040	my8031.cy8
q1000.1
- q1000.1: range queries with 1000 insert/s per client
- Legend for results is here.
- Each entry lists the percentage of responses that fit in that bucket (slower than max time for previous bucket, faster than min time for next bucket).
Query response time histogram
256us	1ms	4ms	16ms	64ms	256ms	1s	4s	16s	gt	max	tag
8.403	40.352	50.719	0.367	0.159	0.000	0.000	0.000	0.000	0.000	0.058	my5649.cy8
13.874	34.101	51.492	0.392	0.141	0.000	0.000	0.000	0.000	0.000	0.060	my5735.cy8
7.345	35.446	56.626	0.427	0.156	0.000	0.000	0.000	0.000	0.000	0.060	my8021.cy8
12.706	33.650	52.978	0.499	0.168	0.000	0.000	0.000	0.000	0.000	0.060	my8031.cy8
Insert response time histogram
256us	1ms	4ms	16ms	64ms	256ms	1s	4s	16s	gt	max	tag
0.000	0.000	74.311	24.900	0.789	0.000	0.000	0.000	0.000	0.000	0.050	my5649.cy8
0.000	0.000	78.950	20.772	0.278	0.000	0.000	0.000	0.000	0.000	0.050	my5735.cy8
0.000	0.000	51.644	47.717	0.637	0.001	0.000	0.000	0.000	0.000	0.066	my8021.cy8
0.000	0.000	71.678	27.456	0.867	0.000	0.000	0.000	0.000	0.000	0.060	my8031.cy8