Introduction
This is a report for the insert benchmark with 20M docs and 1 client(s). It is generated by scripts (bash, awk, sed) and Tufte might not be impressed. An overview of the insert benchmark is here and a short update is here. Below, by DBMS, I mean DBMS+version.config. An example is my8020.c10b40 where my means MySQL, 8020 is version 8.0.20 and c10b40 is the name for the configuration file.
The test server is an Intel NUC with 4 cores, 16G RAM and a Samsung 970 EVO. More details are here. Clients and the DBMS share one server. The per-database configs are in the per-database subdirectories here.
The tested DBMS are:
- fbmy5635.cy9c - FB MySQL 5.6.35 with MyRocks and the cy9c config
- fbmy8028.cy9c - FB MySQL 8.0.28 with MyRocks and the cy9c config
Contents
- Summary
- l.i0: load without secondary indexes
- l.x: create secondary indexes
- l.i1: continue load after secondary indexes created
- q100.1: range queries with 100 insert/s per client
- q500.1: range queries with 500 insert/s per client
- q1000.1: range queries with 1000 insert/s per client
Summary
The numbers are inserts/s for l.i0 and l.i1, indexed docs (or rows) /s for l.x and queries/s for q*.2. The values are the average rate over the entire test for inserts (IPS) and queries (QPS). The range of values for IPS and QPS is split into 3 parts: bottom 25%, middle 50%, top 25%. Values in the bottom 25% have a red background, values in the top 25% have a green background and values in the middle have no color. A gray background is used for values that can be ignored because the DBMS did not sustain the target insert rate. Red backgrounds are not used when the minimum value is within 80% of the max value.
| dbms | l.i0 | l.x | l.i1 | q100.1 | q500.1 | q1000.1 |
|---|---|---|---|---|---|---|
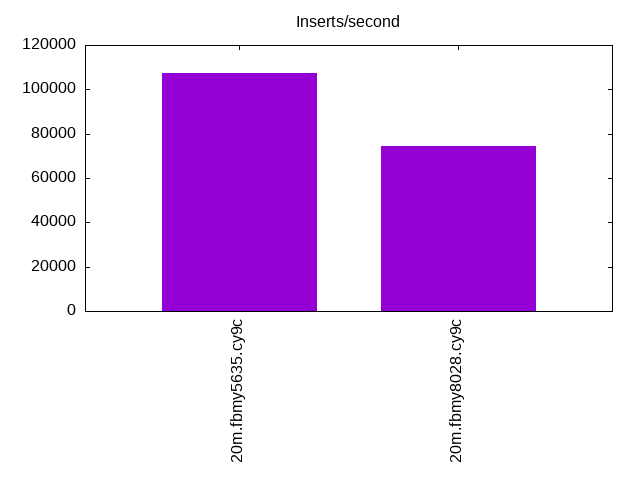
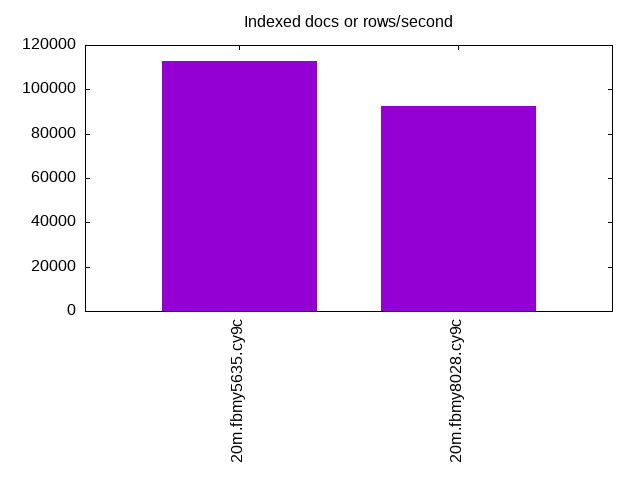
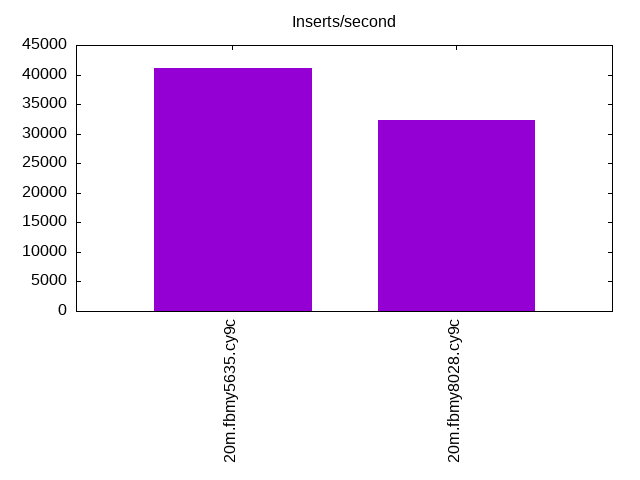
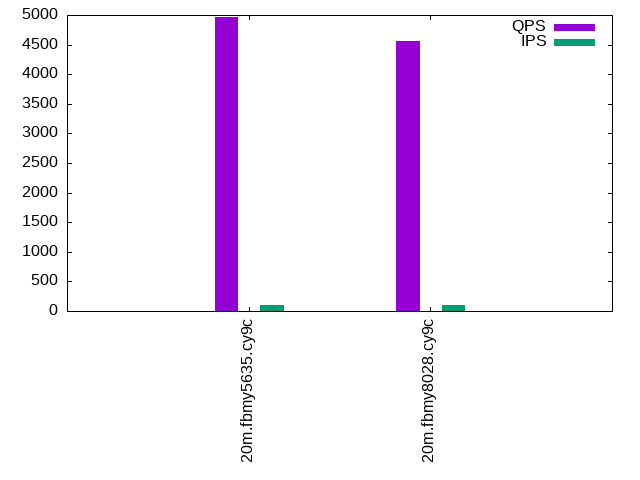
| 20m.fbmy5635.cy9c | 107527 | 112921 | 41068 | 4958 | 4900 | 4891 |
| 20m.fbmy8028.cy9c | 74349 | 92627 | 32362 | 4558 | 4493 | 4479 |
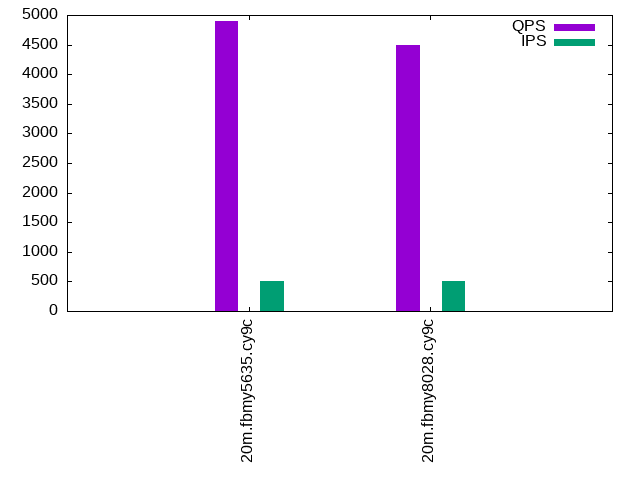
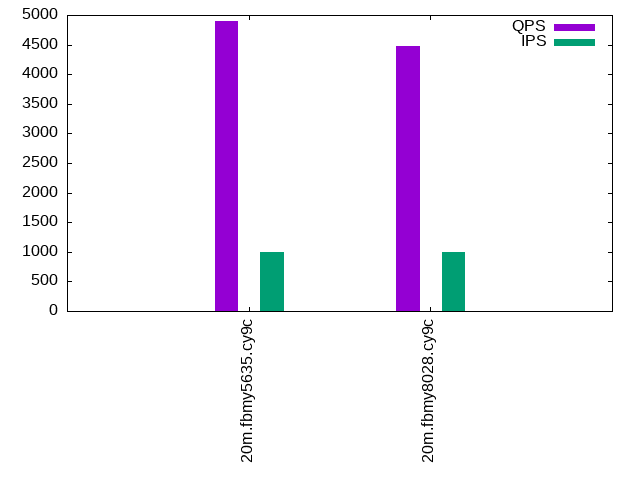
This lists the average rate of inserts/s for the tests that do inserts concurrent with queries. For such tests the query rate is listed in the table above. The read+write tests are setup so that the insert rate should match the target rate every second. Cells that are not at least 95% of the target have a red background to indicate a failure to satisfy the target.
| dbms | q100.1 | q500.1 | q1000.1 |
|---|---|---|---|
| fbmy5635.cy9c | 100 | 500 | 999 |
| fbmy8028.cy9c | 100 | 499 | 999 |
| target | 100 | 500 | 1000 |
l.i0
l.i0: load without secondary indexes. Graphs for performance per 1-second interval are here.
Average throughput:
Insert response time histogram: each cell has the percentage of responses that take <= the time in the header and max is the max response time in seconds. For the max column values in the top 25% of the range have a red background and in the bottom 25% of the range have a green background. The red background is not used when the min value is within 80% of the max value.
| dbms | 256us | 1ms | 4ms | 16ms | 64ms | 256ms | 1s | 4s | 16s | gt | max |
|---|---|---|---|---|---|---|---|---|---|---|---|
| fbmy5635.cy9c | 98.393 | 1.563 | 0.040 | 0.001 | 0.003 | 0.098 | |||||
| fbmy8028.cy9c | 99.835 | 0.114 | 0.051 | 0.062 |
Performance metrics for the DBMS listed above. Some are normalized by throughput, others are not. Legend for results is here.
ips	qps	rps	rmbps	wps	wmbps	rpq	rkbpq	wpi	wkbpi	csps	cpups	cspq	cpupq	dbgb1	dbgb2	rss	maxop	p50	p99	tag
107527	0	0	0.0	42.6	18.3	0.000	0.000	0.000	0.174	10680	42.7	0.099	16	0.7	1.8	0.2	0.098	108884	94097	20m.fbmy5635.cy9c
74349	0	0	0.0	38.4	14.5	0.000	0.000	0.001	0.199	7679	36.4	0.103	20	0.7	1.9	0.6	0.062	74648	68324	20m.fbmy8028.cy9c
l.x
l.x: create secondary indexes.
Average throughput:
Performance metrics for the DBMS listed above. Some are normalized by throughput, others are not. Legend for results is here.
ips	qps	rps	rmbps	wps	wmbps	rpq	rkbpq	wpi	wkbpi	csps	cpups	cspq	cpupq	dbgb1	dbgb2	rss	maxop	p50	p99	tag
112921	0	0	0.0	31.9	17.0	0.000	0.000	0.000	0.154	557	24.5	0.005	9	1.5	2.5	1.3	0.004	NA	NA	20m.fbmy5635.cy9c
92627	0	0	0.0	24.4	14.1	0.000	0.000	0.000	0.156	514	24.6	0.006	11	1.4	2.7	1.9	0.008	NA	NA	20m.fbmy8028.cy9c
l.i1
l.i1: continue load after secondary indexes created. Graphs for performance per 1-second interval are here.
Average throughput:
Insert response time histogram: each cell has the percentage of responses that take <= the time in the header and max is the max response time in seconds. For the max column values in the top 25% of the range have a red background and in the bottom 25% of the range have a green background. The red background is not used when the min value is within 80% of the max value.
| dbms | 256us | 1ms | 4ms | 16ms | 64ms | 256ms | 1s | 4s | 16s | gt | max |
|---|---|---|---|---|---|---|---|---|---|---|---|
| fbmy5635.cy9c | 5.462 | 94.446 | 0.089 | 0.003 | nonzero | 0.079 | |||||
| fbmy8028.cy9c | 99.835 | 0.144 | 0.021 | 0.050 |
Performance metrics for the DBMS listed above. Some are normalized by throughput, others are not. Legend for results is here.
ips	qps	rps	rmbps	wps	wmbps	rpq	rkbpq	wpi	wkbpi	csps	cpups	cspq	cpupq	dbgb1	dbgb2	rss	maxop	p50	p99	tag
41068	0	12	1.5	93.1	55.0	0.000	0.038	0.002	1.372	9430	54.8	0.230	53	2.9	4.6	2.1	0.079	40606	34775	20m.fbmy5635.cy9c
32362	0	10	1.2	63.4	36.7	0.000	0.038	0.002	1.162	7506	48.5	0.232	60	2.8	4.7	2.6	0.050	32164	27936	20m.fbmy8028.cy9c
q100.1
q100.1: range queries with 100 insert/s per client. Graphs for performance per 1-second interval are here.
Average throughput:
Query response time histogram: each cell has the percentage of responses that take <= the time in the header and max is the max response time in seconds. For max values in the top 25% of the range have a red background and in the bottom 25% of the range have a green background. The red background is not used when the min value is within 80% of the max value.
| dbms | 256us | 1ms | 4ms | 16ms | 64ms | 256ms | 1s | 4s | 16s | gt | max |
|---|---|---|---|---|---|---|---|---|---|---|---|
| fbmy5635.cy9c | 99.004 | 0.995 | nonzero | 0.002 | |||||||
| fbmy8028.cy9c | 98.060 | 1.940 | nonzero | 0.002 |
Insert response time histogram: each cell has the percentage of responses that take <= the time in the header and max is the max response time in seconds. For max values in the top 25% of the range have a red background and in the bottom 25% of the range have a green background. The red background is not used when the min value is within 80% of the max value.
| dbms | 256us | 1ms | 4ms | 16ms | 64ms | 256ms | 1s | 4s | 16s | gt | max |
|---|---|---|---|---|---|---|---|---|---|---|---|
| fbmy5635.cy9c | 0.042 | 99.931 | 0.028 | 0.004 | |||||||
| fbmy8028.cy9c | 99.903 | 0.083 | 0.014 | 0.019 |
Performance metrics for the DBMS listed above. Some are normalized by throughput, others are not. Legend for results is here.
ips	qps	rps	rmbps	wps	wmbps	rpq	rkbpq	wpi	wkbpi	csps	cpups	cspq	cpupq	dbgb1	dbgb2	rss	maxop	p50	p99	tag
100	4958	0	0.0	3.4	0.1	0.000	0.000	0.034	1.465	19056	25.4	3.843	205	2.8	4.6	4.0	0.002	4973	4779	20m.fbmy5635.cy9c
100	4558	0	0.0	3.2	0.1	0.000	0.000	0.032	0.563	17675	25.9	3.877	227	2.8	4.8	4.3	0.002	4539	4347	20m.fbmy8028.cy9c
q500.1
q500.1: range queries with 500 insert/s per client. Graphs for performance per 1-second interval are here.
Average throughput:
Query response time histogram: each cell has the percentage of responses that take <= the time in the header and max is the max response time in seconds. For max values in the top 25% of the range have a red background and in the bottom 25% of the range have a green background. The red background is not used when the min value is within 80% of the max value.
| dbms | 256us | 1ms | 4ms | 16ms | 64ms | 256ms | 1s | 4s | 16s | gt | max |
|---|---|---|---|---|---|---|---|---|---|---|---|
| fbmy5635.cy9c | 98.460 | 1.539 | 0.001 | 0.003 | |||||||
| fbmy8028.cy9c | 97.529 | 2.469 | 0.002 | nonzero | 0.005 |
Insert response time histogram: each cell has the percentage of responses that take <= the time in the header and max is the max response time in seconds. For max values in the top 25% of the range have a red background and in the bottom 25% of the range have a green background. The red background is not used when the min value is within 80% of the max value.
| dbms | 256us | 1ms | 4ms | 16ms | 64ms | 256ms | 1s | 4s | 16s | gt | max |
|---|---|---|---|---|---|---|---|---|---|---|---|
| fbmy5635.cy9c | 0.319 | 99.642 | 0.039 | 0.007 | |||||||
| fbmy8028.cy9c | 99.894 | 0.075 | 0.031 | 0.019 |
Performance metrics for the DBMS listed above. Some are normalized by throughput, others are not. Legend for results is here.
ips	qps	rps	rmbps	wps	wmbps	rpq	rkbpq	wpi	wkbpi	csps	cpups	cspq	cpupq	dbgb1	dbgb2	rss	maxop	p50	p99	tag
500	4900	0	0.0	3.7	0.5	0.000	0.000	0.007	0.948	18892	25.8	3.856	211	3.0	3.1	4.8	0.003	4907	4747	20m.fbmy5635.cy9c
499	4493	0	0.0	3.5	0.3	0.000	0.000	0.007	0.708	17485	26.2	3.892	233	3.0	3.2	4.8	0.005	4491	4219	20m.fbmy8028.cy9c
q1000.1
q1000.1: range queries with 1000 insert/s per client. Graphs for performance per 1-second interval are here.
Average throughput:
Query response time histogram: each cell has the percentage of responses that take <= the time in the header and max is the max response time in seconds. For max values in the top 25% of the range have a red background and in the bottom 25% of the range have a green background. The red background is not used when the min value is within 80% of the max value.
| dbms | 256us | 1ms | 4ms | 16ms | 64ms | 256ms | 1s | 4s | 16s | gt | max |
|---|---|---|---|---|---|---|---|---|---|---|---|
| fbmy5635.cy9c | 97.897 | 2.100 | 0.003 | nonzero | 0.004 | ||||||
| fbmy8028.cy9c | 96.634 | 3.359 | 0.007 | nonzero | 0.007 |
Insert response time histogram: each cell has the percentage of responses that take <= the time in the header and max is the max response time in seconds. For max values in the top 25% of the range have a red background and in the bottom 25% of the range have a green background. The red background is not used when the min value is within 80% of the max value.
| dbms | 256us | 1ms | 4ms | 16ms | 64ms | 256ms | 1s | 4s | 16s | gt | max |
|---|---|---|---|---|---|---|---|---|---|---|---|
| fbmy5635.cy9c | 0.150 | 99.812 | 0.036 | 0.001 | 0.033 | ||||||
| fbmy8028.cy9c | 99.887 | 0.068 | 0.044 | 0.039 |
Performance metrics for the DBMS listed above. Some are normalized by throughput, others are not. Legend for results is here.
ips	qps	rps	rmbps	wps	wmbps	rpq	rkbpq	wpi	wkbpi	csps	cpups	cspq	cpupq	dbgb1	dbgb2	rss	maxop	p50	p99	tag
999	4891	0	0.0	5.8	1.9	0.000	0.000	0.006	1.946	18982	26.7	3.881	218	3.3	3.7	8.5	0.004	4892	4699	20m.fbmy5635.cy9c
999	4479	0	0.0	5.1	1.3	0.000	0.000	0.005	1.357	17544	27.2	3.917	243	3.3	3.9	7.7	0.007	4491	4203	20m.fbmy8028.cy9c
l.i0
l.i0: load without secondary indexes
Performance metrics for all DBMS, not just the ones listed above. Some are normalized by throughput, others are not. Legend for results is here.
ips	qps	rps	rmbps	wps	wmbps	rpq	rkbpq	wpi	wkbpi	csps	cpups	cspq	cpupq	dbgb1	dbgb2	rss	maxop	p50	p99	tag
107527	0	0	0.0	42.6	18.3	0.000	0.000	0.000	0.174	10680	42.7	0.099	16	0.7	1.8	0.2	0.098	108884	94097	20m.fbmy5635.cy9c
74349	0	0	0.0	38.4	14.5	0.000	0.000	0.001	0.199	7679	36.4	0.103	20	0.7	1.9	0.6	0.062	74648	68324	20m.fbmy8028.cy9c
l.x
l.x: create secondary indexes
Performance metrics for all DBMS, not just the ones listed above. Some are normalized by throughput, others are not. Legend for results is here.
ips	qps	rps	rmbps	wps	wmbps	rpq	rkbpq	wpi	wkbpi	csps	cpups	cspq	cpupq	dbgb1	dbgb2	rss	maxop	p50	p99	tag
112921	0	0	0.0	31.9	17.0	0.000	0.000	0.000	0.154	557	24.5	0.005	9	1.5	2.5	1.3	0.004	NA	NA	20m.fbmy5635.cy9c
92627	0	0	0.0	24.4	14.1	0.000	0.000	0.000	0.156	514	24.6	0.006	11	1.4	2.7	1.9	0.008	NA	NA	20m.fbmy8028.cy9c
l.i1
l.i1: continue load after secondary indexes created
Performance metrics for all DBMS, not just the ones listed above. Some are normalized by throughput, others are not. Legend for results is here.
ips	qps	rps	rmbps	wps	wmbps	rpq	rkbpq	wpi	wkbpi	csps	cpups	cspq	cpupq	dbgb1	dbgb2	rss	maxop	p50	p99	tag
41068	0	12	1.5	93.1	55.0	0.000	0.038	0.002	1.372	9430	54.8	0.230	53	2.9	4.6	2.1	0.079	40606	34775	20m.fbmy5635.cy9c
32362	0	10	1.2	63.4	36.7	0.000	0.038	0.002	1.162	7506	48.5	0.232	60	2.8	4.7	2.6	0.050	32164	27936	20m.fbmy8028.cy9c
q100.1
q100.1: range queries with 100 insert/s per client
Performance metrics for all DBMS, not just the ones listed above. Some are normalized by throughput, others are not. Legend for results is here.
ips	qps	rps	rmbps	wps	wmbps	rpq	rkbpq	wpi	wkbpi	csps	cpups	cspq	cpupq	dbgb1	dbgb2	rss	maxop	p50	p99	tag
100	4958	0	0.0	3.4	0.1	0.000	0.000	0.034	1.465	19056	25.4	3.843	205	2.8	4.6	4.0	0.002	4973	4779	20m.fbmy5635.cy9c
100	4558	0	0.0	3.2	0.1	0.000	0.000	0.032	0.563	17675	25.9	3.877	227	2.8	4.8	4.3	0.002	4539	4347	20m.fbmy8028.cy9c
q500.1
q500.1: range queries with 500 insert/s per client
Performance metrics for all DBMS, not just the ones listed above. Some are normalized by throughput, others are not. Legend for results is here.
ips	qps	rps	rmbps	wps	wmbps	rpq	rkbpq	wpi	wkbpi	csps	cpups	cspq	cpupq	dbgb1	dbgb2	rss	maxop	p50	p99	tag
500	4900	0	0.0	3.7	0.5	0.000	0.000	0.007	0.948	18892	25.8	3.856	211	3.0	3.1	4.8	0.003	4907	4747	20m.fbmy5635.cy9c
499	4493	0	0.0	3.5	0.3	0.000	0.000	0.007	0.708	17485	26.2	3.892	233	3.0	3.2	4.8	0.005	4491	4219	20m.fbmy8028.cy9c
q1000.1
q1000.1: range queries with 1000 insert/s per client
Performance metrics for all DBMS, not just the ones listed above. Some are normalized by throughput, others are not. Legend for results is here.
ips	qps	rps	rmbps	wps	wmbps	rpq	rkbpq	wpi	wkbpi	csps	cpups	cspq	cpupq	dbgb1	dbgb2	rss	maxop	p50	p99	tag
999	4891	0	0.0	5.8	1.9	0.000	0.000	0.006	1.946	18982	26.7	3.881	218	3.3	3.7	8.5	0.004	4892	4699	20m.fbmy5635.cy9c
999	4479	0	0.0	5.1	1.3	0.000	0.000	0.005	1.357	17544	27.2	3.917	243	3.3	3.9	7.7	0.007	4491	4203	20m.fbmy8028.cy9c
l.i0
- l.i0: load without secondary indexes
- Legend for results is here.
- Each entry lists the percentage of responses that fit in that bucket (slower than max time for previous bucket, faster than min time for next bucket).
Insert response time histogram
256us	1ms	4ms	16ms	64ms	256ms	1s	4s	16s	gt	max	tag
0.000	98.393	1.563	0.040	0.001	0.003	0.000	0.000	0.000	0.000	0.098	fbmy5635.cy9c
0.000	0.000	99.835	0.114	0.051	0.000	0.000	0.000	0.000	0.000	0.062	fbmy8028.cy9c
l.x
- l.x: create secondary indexes
- Legend for results is here.
- Each entry lists the percentage of responses that fit in that bucket (slower than max time for previous bucket, faster than min time for next bucket).
TODO - determine whether there is data for create index response time
l.i1
- l.i1: continue load after secondary indexes created
- Legend for results is here.
- Each entry lists the percentage of responses that fit in that bucket (slower than max time for previous bucket, faster than min time for next bucket).
Insert response time histogram
256us	1ms	4ms	16ms	64ms	256ms	1s	4s	16s	gt	max	tag
0.000	5.462	94.446	0.089	0.003	nonzero	0.000	0.000	0.000	0.000	0.079	fbmy5635.cy9c
0.000	0.000	99.835	0.144	0.021	0.000	0.000	0.000	0.000	0.000	0.050	fbmy8028.cy9c
q100.1
- q100.1: range queries with 100 insert/s per client
- Legend for results is here.
- Each entry lists the percentage of responses that fit in that bucket (slower than max time for previous bucket, faster than min time for next bucket).
Query response time histogram
256us	1ms	4ms	16ms	64ms	256ms	1s	4s	16s	gt	max	tag
99.004	0.995	nonzero	0.000	0.000	0.000	0.000	0.000	0.000	0.000	0.002	fbmy5635.cy9c
98.060	1.940	nonzero	0.000	0.000	0.000	0.000	0.000	0.000	0.000	0.002	fbmy8028.cy9c
Insert response time histogram
256us	1ms	4ms	16ms	64ms	256ms	1s	4s	16s	gt	max	tag
0.000	0.042	99.931	0.028	0.000	0.000	0.000	0.000	0.000	0.000	0.004	fbmy5635.cy9c
0.000	0.000	99.903	0.083	0.014	0.000	0.000	0.000	0.000	0.000	0.019	fbmy8028.cy9c
q500.1
- q500.1: range queries with 500 insert/s per client
- Legend for results is here.
- Each entry lists the percentage of responses that fit in that bucket (slower than max time for previous bucket, faster than min time for next bucket).
Query response time histogram
256us	1ms	4ms	16ms	64ms	256ms	1s	4s	16s	gt	max	tag
98.460	1.539	0.001	0.000	0.000	0.000	0.000	0.000	0.000	0.000	0.003	fbmy5635.cy9c
97.529	2.469	0.002	nonzero	0.000	0.000	0.000	0.000	0.000	0.000	0.005	fbmy8028.cy9c
Insert response time histogram
256us	1ms	4ms	16ms	64ms	256ms	1s	4s	16s	gt	max	tag
0.000	0.319	99.642	0.039	0.000	0.000	0.000	0.000	0.000	0.000	0.007	fbmy5635.cy9c
0.000	0.000	99.894	0.075	0.031	0.000	0.000	0.000	0.000	0.000	0.019	fbmy8028.cy9c
q1000.1
- q1000.1: range queries with 1000 insert/s per client
- Legend for results is here.
- Each entry lists the percentage of responses that fit in that bucket (slower than max time for previous bucket, faster than min time for next bucket).
Query response time histogram
256us	1ms	4ms	16ms	64ms	256ms	1s	4s	16s	gt	max	tag
97.897	2.100	0.003	nonzero	0.000	0.000	0.000	0.000	0.000	0.000	0.004	fbmy5635.cy9c
96.634	3.359	0.007	nonzero	0.000	0.000	0.000	0.000	0.000	0.000	0.007	fbmy8028.cy9c
Insert response time histogram
256us	1ms	4ms	16ms	64ms	256ms	1s	4s	16s	gt	max	tag
0.000	0.150	99.812	0.036	0.001	0.000	0.000	0.000	0.000	0.000	0.033	fbmy5635.cy9c
0.000	0.000	99.887	0.068	0.044	0.000	0.000	0.000	0.000	0.000	0.039	fbmy8028.cy9c