Introduction
This is a report for the insert benchmark with 20M docs and 1 client(s). It is generated by scripts (bash, awk, sed) and Tufte might not be impressed. An overview of the insert benchmark is here and a short update is here. Below, by DBMS, I mean DBMS+version.config. An example is my8020.c10b40 where my means MySQL, 8020 is version 8.0.20 and c10b40 is the name for the configuration file.
The test server is an Intel NUC with 4 cores, 16G RAM and a Samsung 970 EVO. More details are here. Clients and the DBMS share one server. The per-database configs are in the per-database subdirectories here.
The tested DBMS are:
- pg1211.cx7 - Postgres 12.11 with the cx7 config
- pg137.cx7 - Postgres 13.7 with the cx7 config
- pg146.cx7 - Postgres 14.6 with the cx7 config
- pg151.cx7 - Postgres 15.1 with the cx7 config
Contents
- Summary
- l.i0: load without secondary indexes
- l.x: create secondary indexes
- l.i1: continue load after secondary indexes created
- q100.1: range queries with 100 insert/s per client
- q500.1: range queries with 500 insert/s per client
- q1000.1: range queries with 1000 insert/s per client
Summary
The numbers are inserts/s for l.i0 and l.i1, indexed docs (or rows) /s for l.x and queries/s for q*.2. The values are the average rate over the entire test for inserts (IPS) and queries (QPS). The range of values for IPS and QPS is split into 3 parts: bottom 25%, middle 50%, top 25%. Values in the bottom 25% have a red background, values in the top 25% have a green background and values in the middle have no color. A gray background is used for values that can be ignored because the DBMS did not sustain the target insert rate. Red backgrounds are not used when the minimum value is within 80% of the max value.
| dbms | l.i0 | l.x | l.i1 | q100.1 | q500.1 | q1000.1 |
|---|---|---|---|---|---|---|
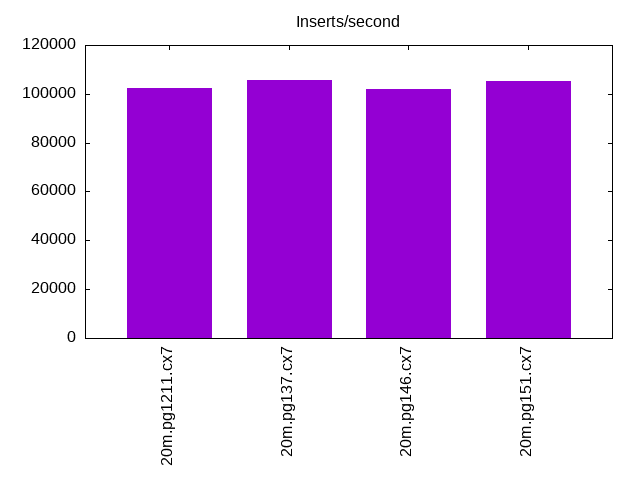
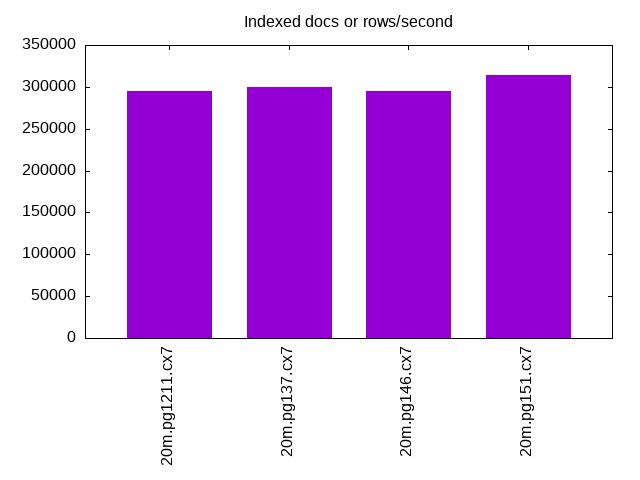
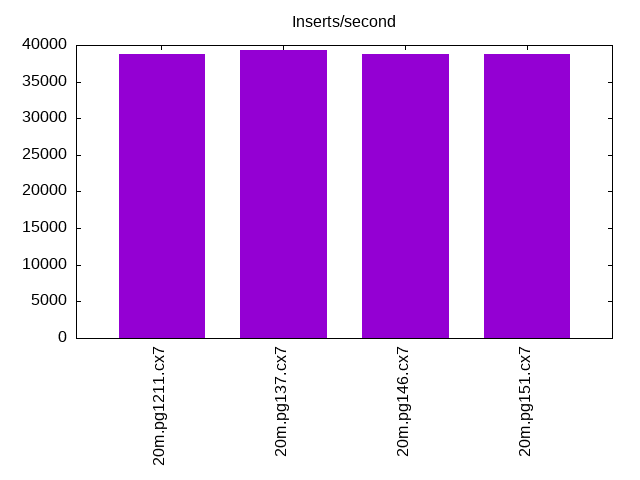
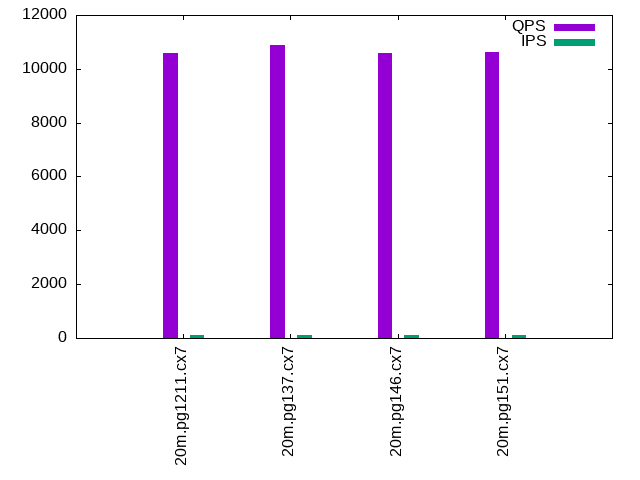
| 20m.pg1211.cx7 | 102564 | 295588 | 38835 | 10575 | 10431 | 10564 |
| 20m.pg137.cx7 | 105820 | 300000 | 39293 | 10883 | 10837 | 10778 |
| 20m.pg146.cx7 | 102041 | 295588 | 38760 | 10580 | 10504 | 10615 |
| 20m.pg151.cx7 | 105263 | 314062 | 38760 | 10623 | 10738 | 10653 |
This lists the average rate of inserts/s for the tests that do inserts concurrent with queries. For such tests the query rate is listed in the table above. The read+write tests are setup so that the insert rate should match the target rate every second. Cells that are not at least 95% of the target have a red background to indicate a failure to satisfy the target.
| dbms | q100.1 | q500.1 | q1000.1 |
|---|---|---|---|
| pg1211.cx7 | 100 | 499 | 999 |
| pg137.cx7 | 100 | 500 | 999 |
| pg146.cx7 | 100 | 500 | 999 |
| pg151.cx7 | 100 | 499 | 999 |
| target | 100 | 500 | 1000 |
l.i0
l.i0: load without secondary indexes. Graphs for performance per 1-second interval are here.
Average throughput:
Insert response time histogram: each cell has the percentage of responses that take <= the time in the header and max is the max response time in seconds. For the max column values in the top 25% of the range have a red background and in the bottom 25% of the range have a green background. The red background is not used when the min value is within 80% of the max value.
| dbms | 256us | 1ms | 4ms | 16ms | 64ms | 256ms | 1s | 4s | 16s | gt | max |
|---|---|---|---|---|---|---|---|---|---|---|---|
| pg1211.cx7 | 92.346 | 7.654 | 0.004 | ||||||||
| pg137.cx7 | 97.725 | 2.275 | 0.002 | ||||||||
| pg146.cx7 | 91.716 | 8.284 | 0.001 | 0.005 | |||||||
| pg151.cx7 | 97.897 | 2.103 | 0.001 | 0.004 |
Performance metrics for the DBMS listed above. Some are normalized by throughput, others are not. Legend for results is here.
ips	qps	rps	rmbps	wps	wmbps	rpq	rkbpq	wpi	wkbpi	csps	cpups	cspq	cpupq	dbgb1	dbgb2	rss	maxop	p50	p99	tag
102564	0	0	0.0	67.6	44.0	0.000	0.000	0.001	0.439	12202	40.6	0.119	16	1.9	5.2	0.0	0.004	103227	93801	20m.pg1211.cx7
105820	0	0	0.0	68.8	44.4	0.000	0.000	0.001	0.430	12641	42.1	0.119	16	1.9	5.2	0.0	0.002	107182	99092	20m.pg137.cx7
102041	0	0	0.0	67.6	44.0	0.000	0.000	0.001	0.442	12224	40.1	0.120	16	1.9	5.2	0.0	0.005	102891	94459	20m.pg146.cx7
105263	0	0	0.0	68.8	44.1	0.000	0.000	0.001	0.429	12596	41.3	0.120	16	1.9	5.2	0.0	0.004	106583	99132	20m.pg151.cx7
l.x
l.x: create secondary indexes.
Average throughput:
Performance metrics for the DBMS listed above. Some are normalized by throughput, others are not. Legend for results is here.
ips	qps	rps	rmbps	wps	wmbps	rpq	rkbpq	wpi	wkbpi	csps	cpups	cspq	cpupq	dbgb1	dbgb2	rss	maxop	p50	p99	tag
295588	0	0	0.0	55.5	58.8	0.000	0.000	0.000	0.204	1213	23.4	0.004	3	3.7	8.6	0.0	0.002	NA	NA	20m.pg1211.cx7
300000	0	0	0.0	60.0	62.4	0.000	0.000	0.000	0.213	1249	23.9	0.004	3	3.7	8.6	0.0	0.002	NA	NA	20m.pg137.cx7
295588	0	0	0.0	54.9	58.3	0.000	0.000	0.000	0.202	1195	23.6	0.004	3	3.7	8.6	0.0	0.002	NA	NA	20m.pg146.cx7
314062	0	0	0.0	53.0	56.7	0.000	0.000	0.000	0.185	1226	23.8	0.004	3	3.7	8.6	0.0	0.002	NA	NA	20m.pg151.cx7
l.i1
l.i1: continue load after secondary indexes created. Graphs for performance per 1-second interval are here.
Average throughput:
Insert response time histogram: each cell has the percentage of responses that take <= the time in the header and max is the max response time in seconds. For the max column values in the top 25% of the range have a red background and in the bottom 25% of the range have a green background. The red background is not used when the min value is within 80% of the max value.
| dbms | 256us | 1ms | 4ms | 16ms | 64ms | 256ms | 1s | 4s | 16s | gt | max |
|---|---|---|---|---|---|---|---|---|---|---|---|
| pg1211.cx7 | 99.961 | 0.033 | 0.006 | nonzero | 0.072 | ||||||
| pg137.cx7 | 99.969 | 0.026 | 0.004 | 0.001 | 0.075 | ||||||
| pg146.cx7 | 99.977 | 0.021 | 0.002 | 0.027 | |||||||
| pg151.cx7 | 99.968 | 0.028 | 0.003 | 0.042 |
Performance metrics for the DBMS listed above. Some are normalized by throughput, others are not. Legend for results is here.
ips	qps	rps	rmbps	wps	wmbps	rpq	rkbpq	wpi	wkbpi	csps	cpups	cspq	cpupq	dbgb1	dbgb2	rss	maxop	p50	p99	tag
38835	0	0	0.0	205.1	66.3	0.000	0.000	0.005	1.747	9797	32.7	0.252	34	8.2	19.5	0.0	0.072	40006	24274	20m.pg1211.cx7
39293	0	0	0.0	212.3	69.0	0.000	0.000	0.005	1.799	9919	32.9	0.252	33	8.2	20.0	0.0	0.075	40306	24172	20m.pg137.cx7
38760	0	0	0.0	166.3	64.6	0.000	0.000	0.004	1.707	9818	32.4	0.253	33	8.2	20.7	1.6	0.027	39808	26631	20m.pg146.cx7
38760	0	0	0.0	162.7	63.2	0.000	0.000	0.004	1.668	9752	32.4	0.252	33	8.2	20.3	0.0	0.042	40006	23323	20m.pg151.cx7
q100.1
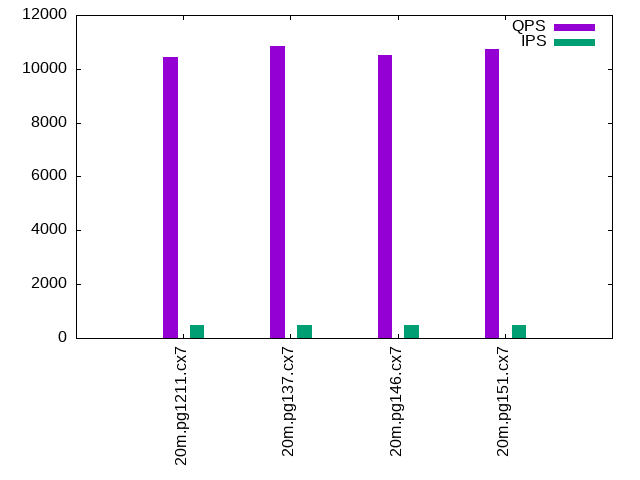
q100.1: range queries with 100 insert/s per client. Graphs for performance per 1-second interval are here.
Average throughput:
Query response time histogram: each cell has the percentage of responses that take <= the time in the header and max is the max response time in seconds. For max values in the top 25% of the range have a red background and in the bottom 25% of the range have a green background. The red background is not used when the min value is within 80% of the max value.
| dbms | 256us | 1ms | 4ms | 16ms | 64ms | 256ms | 1s | 4s | 16s | gt | max |
|---|---|---|---|---|---|---|---|---|---|---|---|
| pg1211.cx7 | 99.995 | 0.004 | 0.001 | nonzero | 0.004 | ||||||
| pg137.cx7 | 99.995 | 0.004 | 0.001 | 0.003 | |||||||
| pg146.cx7 | 99.995 | 0.004 | 0.001 | 0.003 | |||||||
| pg151.cx7 | 99.996 | 0.004 | nonzero | nonzero | 0.004 |
Insert response time histogram: each cell has the percentage of responses that take <= the time in the header and max is the max response time in seconds. For max values in the top 25% of the range have a red background and in the bottom 25% of the range have a green background. The red background is not used when the min value is within 80% of the max value.
| dbms | 256us | 1ms | 4ms | 16ms | 64ms | 256ms | 1s | 4s | 16s | gt | max |
|---|---|---|---|---|---|---|---|---|---|---|---|
| pg1211.cx7 | 99.972 | 0.028 | 0.005 | ||||||||
| pg137.cx7 | 99.986 | 0.014 | 0.005 | ||||||||
| pg146.cx7 | 99.958 | 0.042 | 0.006 | ||||||||
| pg151.cx7 | 99.986 | 0.014 | 0.006 |
Performance metrics for the DBMS listed above. Some are normalized by throughput, others are not. Legend for results is here.
ips	qps	rps	rmbps	wps	wmbps	rpq	rkbpq	wpi	wkbpi	csps	cpups	cspq	cpupq	dbgb1	dbgb2	rss	maxop	p50	p99	tag
100	10575	0	0.0	199.5	5.4	0.000	0.000	1.997	55.142	40622	25.7	3.841	97	8.2	14.2	0.0	0.004	10573	10452	20m.pg1211.cx7
100	10883	0	0.0	198.4	4.7	0.000	0.000	1.988	48.231	41803	25.7	3.841	94	8.2	13.8	0.0	0.003	10884	10756	20m.pg137.cx7
100	10580	0	0.0	191.5	4.9	0.000	0.000	1.918	50.337	40607	25.7	3.838	97	8.2	15.9	0.0	0.003	10581	10453	20m.pg146.cx7
100	10623	0	0.0	192.4	4.9	0.000	0.000	1.928	50.013	40743	25.7	3.836	97	8.2	15.9	0.0	0.004	10628	10484	20m.pg151.cx7
q500.1
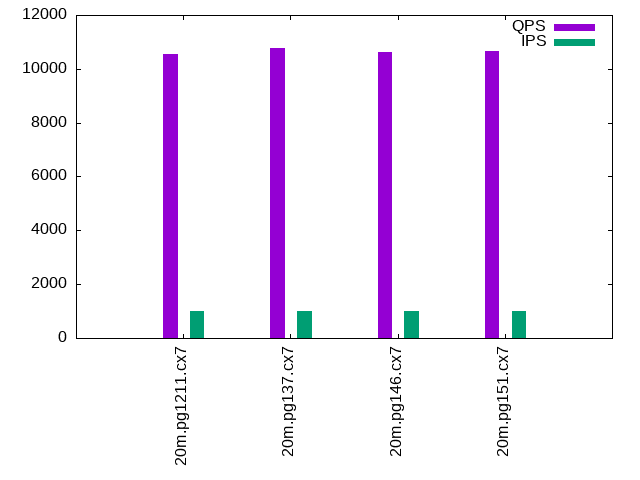
q500.1: range queries with 500 insert/s per client. Graphs for performance per 1-second interval are here.
Average throughput:
Query response time histogram: each cell has the percentage of responses that take <= the time in the header and max is the max response time in seconds. For max values in the top 25% of the range have a red background and in the bottom 25% of the range have a green background. The red background is not used when the min value is within 80% of the max value.
| dbms | 256us | 1ms | 4ms | 16ms | 64ms | 256ms | 1s | 4s | 16s | gt | max |
|---|---|---|---|---|---|---|---|---|---|---|---|
| pg1211.cx7 | 99.980 | 0.015 | 0.005 | nonzero | 0.006 | ||||||
| pg137.cx7 | 99.982 | 0.014 | 0.004 | nonzero | 0.005 | ||||||
| pg146.cx7 | 99.975 | 0.018 | 0.007 | nonzero | 0.005 | ||||||
| pg151.cx7 | 99.976 | 0.017 | 0.007 | nonzero | 0.006 |
Insert response time histogram: each cell has the percentage of responses that take <= the time in the header and max is the max response time in seconds. For max values in the top 25% of the range have a red background and in the bottom 25% of the range have a green background. The red background is not used when the min value is within 80% of the max value.
| dbms | 256us | 1ms | 4ms | 16ms | 64ms | 256ms | 1s | 4s | 16s | gt | max |
|---|---|---|---|---|---|---|---|---|---|---|---|
| pg1211.cx7 | 99.969 | 0.031 | 0.006 | ||||||||
| pg137.cx7 | 99.967 | 0.033 | 0.006 | ||||||||
| pg146.cx7 | 99.964 | 0.036 | 0.006 | ||||||||
| pg151.cx7 | 99.947 | 0.053 | 0.007 |
Performance metrics for the DBMS listed above. Some are normalized by throughput, others are not. Legend for results is here.
ips	qps	rps	rmbps	wps	wmbps	rpq	rkbpq	wpi	wkbpi	csps	cpups	cspq	cpupq	dbgb1	dbgb2	rss	maxop	p50	p99	tag
499	10431	0	0.0	334.6	12.4	0.000	0.000	0.670	25.515	40219	26.1	3.856	100	8.7	12.1	0.0	0.006	10437	10181	20m.pg1211.cx7
500	10837	0	0.0	337.6	12.5	0.000	0.000	0.676	25.608	41710	26.1	3.849	96	8.7	12.0	0.0	0.005	10836	10692	20m.pg137.cx7
500	10504	0	0.0	339.4	11.8	0.000	0.000	0.680	24.130	40416	26.1	3.848	99	8.7	12.9	0.0	0.005	10501	10377	20m.pg146.cx7
499	10738	0	0.0	339.5	11.8	0.000	0.000	0.680	24.139	41286	26.1	3.845	97	8.7	12.9	0.0	0.006	10740	10612	20m.pg151.cx7
q1000.1
q1000.1: range queries with 1000 insert/s per client. Graphs for performance per 1-second interval are here.
Average throughput:
Query response time histogram: each cell has the percentage of responses that take <= the time in the header and max is the max response time in seconds. For max values in the top 25% of the range have a red background and in the bottom 25% of the range have a green background. The red background is not used when the min value is within 80% of the max value.
| dbms | 256us | 1ms | 4ms | 16ms | 64ms | 256ms | 1s | 4s | 16s | gt | max |
|---|---|---|---|---|---|---|---|---|---|---|---|
| pg1211.cx7 | 99.951 | 0.037 | 0.012 | nonzero | 0.015 | ||||||
| pg137.cx7 | 99.953 | 0.035 | 0.012 | nonzero | 0.015 | ||||||
| pg146.cx7 | 99.945 | 0.040 | 0.015 | nonzero | 0.008 | ||||||
| pg151.cx7 | 99.947 | 0.038 | 0.015 | nonzero | 0.007 |
Insert response time histogram: each cell has the percentage of responses that take <= the time in the header and max is the max response time in seconds. For max values in the top 25% of the range have a red background and in the bottom 25% of the range have a green background. The red background is not used when the min value is within 80% of the max value.
| dbms | 256us | 1ms | 4ms | 16ms | 64ms | 256ms | 1s | 4s | 16s | gt | max |
|---|---|---|---|---|---|---|---|---|---|---|---|
| pg1211.cx7 | 98.428 | 1.410 | 0.163 | 0.035 | |||||||
| pg137.cx7 | 98.517 | 1.328 | 0.156 | 0.035 | |||||||
| pg146.cx7 | 99.037 | 0.958 | 0.004 | 0.035 | |||||||
| pg151.cx7 | 99.076 | 0.919 | 0.004 | 0.035 |
Performance metrics for the DBMS listed above. Some are normalized by throughput, others are not. Legend for results is here.
ips	qps	rps	rmbps	wps	wmbps	rpq	rkbpq	wpi	wkbpi	csps	cpups	cspq	cpupq	dbgb1	dbgb2	rss	maxop	p50	p99	tag
999	10564	7	0.1	382.9	19.0	0.001	0.006	0.383	19.479	40839	26.7	3.866	101	10.6	14.6	0.0	0.015	10565	10405	20m.pg1211.cx7
999	10778	7	0.1	384.6	19.0	0.001	0.006	0.385	19.511	41661	26.8	3.865	99	10.6	14.6	0.0	0.015	10788	10613	20m.pg137.cx7
999	10615	7	0.1	413.2	17.4	0.001	0.006	0.414	17.864	40983	26.7	3.861	101	10.6	15.4	0.0	0.008	10613	10469	20m.pg146.cx7
999	10653	7	0.1	413.7	17.4	0.001	0.006	0.414	17.877	41108	26.8	3.859	101	10.6	15.4	0.0	0.007	10660	10517	20m.pg151.cx7
l.i0
l.i0: load without secondary indexes
Performance metrics for all DBMS, not just the ones listed above. Some are normalized by throughput, others are not. Legend for results is here.
ips	qps	rps	rmbps	wps	wmbps	rpq	rkbpq	wpi	wkbpi	csps	cpups	cspq	cpupq	dbgb1	dbgb2	rss	maxop	p50	p99	tag
102564	0	0	0.0	67.6	44.0	0.000	0.000	0.001	0.439	12202	40.6	0.119	16	1.9	5.2	0.0	0.004	103227	93801	20m.pg1211.cx7
105820	0	0	0.0	68.8	44.4	0.000	0.000	0.001	0.430	12641	42.1	0.119	16	1.9	5.2	0.0	0.002	107182	99092	20m.pg137.cx7
102041	0	0	0.0	67.6	44.0	0.000	0.000	0.001	0.442	12224	40.1	0.120	16	1.9	5.2	0.0	0.005	102891	94459	20m.pg146.cx7
105263	0	0	0.0	68.8	44.1	0.000	0.000	0.001	0.429	12596	41.3	0.120	16	1.9	5.2	0.0	0.004	106583	99132	20m.pg151.cx7
l.x
l.x: create secondary indexes
Performance metrics for all DBMS, not just the ones listed above. Some are normalized by throughput, others are not. Legend for results is here.
ips	qps	rps	rmbps	wps	wmbps	rpq	rkbpq	wpi	wkbpi	csps	cpups	cspq	cpupq	dbgb1	dbgb2	rss	maxop	p50	p99	tag
295588	0	0	0.0	55.5	58.8	0.000	0.000	0.000	0.204	1213	23.4	0.004	3	3.7	8.6	0.0	0.002	NA	NA	20m.pg1211.cx7
300000	0	0	0.0	60.0	62.4	0.000	0.000	0.000	0.213	1249	23.9	0.004	3	3.7	8.6	0.0	0.002	NA	NA	20m.pg137.cx7
295588	0	0	0.0	54.9	58.3	0.000	0.000	0.000	0.202	1195	23.6	0.004	3	3.7	8.6	0.0	0.002	NA	NA	20m.pg146.cx7
314062	0	0	0.0	53.0	56.7	0.000	0.000	0.000	0.185	1226	23.8	0.004	3	3.7	8.6	0.0	0.002	NA	NA	20m.pg151.cx7
l.i1
l.i1: continue load after secondary indexes created
Performance metrics for all DBMS, not just the ones listed above. Some are normalized by throughput, others are not. Legend for results is here.
ips	qps	rps	rmbps	wps	wmbps	rpq	rkbpq	wpi	wkbpi	csps	cpups	cspq	cpupq	dbgb1	dbgb2	rss	maxop	p50	p99	tag
38835	0	0	0.0	205.1	66.3	0.000	0.000	0.005	1.747	9797	32.7	0.252	34	8.2	19.5	0.0	0.072	40006	24274	20m.pg1211.cx7
39293	0	0	0.0	212.3	69.0	0.000	0.000	0.005	1.799	9919	32.9	0.252	33	8.2	20.0	0.0	0.075	40306	24172	20m.pg137.cx7
38760	0	0	0.0	166.3	64.6	0.000	0.000	0.004	1.707	9818	32.4	0.253	33	8.2	20.7	1.6	0.027	39808	26631	20m.pg146.cx7
38760	0	0	0.0	162.7	63.2	0.000	0.000	0.004	1.668	9752	32.4	0.252	33	8.2	20.3	0.0	0.042	40006	23323	20m.pg151.cx7
q100.1
q100.1: range queries with 100 insert/s per client
Performance metrics for all DBMS, not just the ones listed above. Some are normalized by throughput, others are not. Legend for results is here.
ips	qps	rps	rmbps	wps	wmbps	rpq	rkbpq	wpi	wkbpi	csps	cpups	cspq	cpupq	dbgb1	dbgb2	rss	maxop	p50	p99	tag
100	10575	0	0.0	199.5	5.4	0.000	0.000	1.997	55.142	40622	25.7	3.841	97	8.2	14.2	0.0	0.004	10573	10452	20m.pg1211.cx7
100	10883	0	0.0	198.4	4.7	0.000	0.000	1.988	48.231	41803	25.7	3.841	94	8.2	13.8	0.0	0.003	10884	10756	20m.pg137.cx7
100	10580	0	0.0	191.5	4.9	0.000	0.000	1.918	50.337	40607	25.7	3.838	97	8.2	15.9	0.0	0.003	10581	10453	20m.pg146.cx7
100	10623	0	0.0	192.4	4.9	0.000	0.000	1.928	50.013	40743	25.7	3.836	97	8.2	15.9	0.0	0.004	10628	10484	20m.pg151.cx7
q500.1
q500.1: range queries with 500 insert/s per client
Performance metrics for all DBMS, not just the ones listed above. Some are normalized by throughput, others are not. Legend for results is here.
ips	qps	rps	rmbps	wps	wmbps	rpq	rkbpq	wpi	wkbpi	csps	cpups	cspq	cpupq	dbgb1	dbgb2	rss	maxop	p50	p99	tag
499	10431	0	0.0	334.6	12.4	0.000	0.000	0.670	25.515	40219	26.1	3.856	100	8.7	12.1	0.0	0.006	10437	10181	20m.pg1211.cx7
500	10837	0	0.0	337.6	12.5	0.000	0.000	0.676	25.608	41710	26.1	3.849	96	8.7	12.0	0.0	0.005	10836	10692	20m.pg137.cx7
500	10504	0	0.0	339.4	11.8	0.000	0.000	0.680	24.130	40416	26.1	3.848	99	8.7	12.9	0.0	0.005	10501	10377	20m.pg146.cx7
499	10738	0	0.0	339.5	11.8	0.000	0.000	0.680	24.139	41286	26.1	3.845	97	8.7	12.9	0.0	0.006	10740	10612	20m.pg151.cx7
q1000.1
q1000.1: range queries with 1000 insert/s per client
Performance metrics for all DBMS, not just the ones listed above. Some are normalized by throughput, others are not. Legend for results is here.
ips	qps	rps	rmbps	wps	wmbps	rpq	rkbpq	wpi	wkbpi	csps	cpups	cspq	cpupq	dbgb1	dbgb2	rss	maxop	p50	p99	tag
999	10564	7	0.1	382.9	19.0	0.001	0.006	0.383	19.479	40839	26.7	3.866	101	10.6	14.6	0.0	0.015	10565	10405	20m.pg1211.cx7
999	10778	7	0.1	384.6	19.0	0.001	0.006	0.385	19.511	41661	26.8	3.865	99	10.6	14.6	0.0	0.015	10788	10613	20m.pg137.cx7
999	10615	7	0.1	413.2	17.4	0.001	0.006	0.414	17.864	40983	26.7	3.861	101	10.6	15.4	0.0	0.008	10613	10469	20m.pg146.cx7
999	10653	7	0.1	413.7	17.4	0.001	0.006	0.414	17.877	41108	26.8	3.859	101	10.6	15.4	0.0	0.007	10660	10517	20m.pg151.cx7
l.i0
- l.i0: load without secondary indexes
- Legend for results is here.
- Each entry lists the percentage of responses that fit in that bucket (slower than max time for previous bucket, faster than min time for next bucket).
Insert response time histogram
256us	1ms	4ms	16ms	64ms	256ms	1s	4s	16s	gt	max	tag
0.000	92.346	7.654	0.000	0.000	0.000	0.000	0.000	0.000	0.000	0.004	pg1211.cx7
0.000	97.725	2.275	0.000	0.000	0.000	0.000	0.000	0.000	0.000	0.002	pg137.cx7
0.000	91.716	8.284	0.001	0.000	0.000	0.000	0.000	0.000	0.000	0.005	pg146.cx7
0.000	97.897	2.103	0.001	0.000	0.000	0.000	0.000	0.000	0.000	0.004	pg151.cx7
l.x
- l.x: create secondary indexes
- Legend for results is here.
- Each entry lists the percentage of responses that fit in that bucket (slower than max time for previous bucket, faster than min time for next bucket).
TODO - determine whether there is data for create index response time
l.i1
- l.i1: continue load after secondary indexes created
- Legend for results is here.
- Each entry lists the percentage of responses that fit in that bucket (slower than max time for previous bucket, faster than min time for next bucket).
Insert response time histogram
256us	1ms	4ms	16ms	64ms	256ms	1s	4s	16s	gt	max	tag
0.000	0.000	99.961	0.033	0.006	nonzero	0.000	0.000	0.000	0.000	0.072	pg1211.cx7
0.000	0.000	99.969	0.026	0.004	0.001	0.000	0.000	0.000	0.000	0.075	pg137.cx7
0.000	0.000	99.977	0.021	0.002	0.000	0.000	0.000	0.000	0.000	0.027	pg146.cx7
0.000	0.000	99.968	0.028	0.003	0.000	0.000	0.000	0.000	0.000	0.042	pg151.cx7
q100.1
- q100.1: range queries with 100 insert/s per client
- Legend for results is here.
- Each entry lists the percentage of responses that fit in that bucket (slower than max time for previous bucket, faster than min time for next bucket).
Query response time histogram
256us	1ms	4ms	16ms	64ms	256ms	1s	4s	16s	gt	max	tag
99.995	0.004	0.001	nonzero	0.000	0.000	0.000	0.000	0.000	0.000	0.004	pg1211.cx7
99.995	0.004	0.001	0.000	0.000	0.000	0.000	0.000	0.000	0.000	0.003	pg137.cx7
99.995	0.004	0.001	0.000	0.000	0.000	0.000	0.000	0.000	0.000	0.003	pg146.cx7
99.996	0.004	nonzero	nonzero	0.000	0.000	0.000	0.000	0.000	0.000	0.004	pg151.cx7
Insert response time histogram
256us	1ms	4ms	16ms	64ms	256ms	1s	4s	16s	gt	max	tag
0.000	0.000	99.972	0.028	0.000	0.000	0.000	0.000	0.000	0.000	0.005	pg1211.cx7
0.000	0.000	99.986	0.014	0.000	0.000	0.000	0.000	0.000	0.000	0.005	pg137.cx7
0.000	0.000	99.958	0.042	0.000	0.000	0.000	0.000	0.000	0.000	0.006	pg146.cx7
0.000	0.000	99.986	0.014	0.000	0.000	0.000	0.000	0.000	0.000	0.006	pg151.cx7
q500.1
- q500.1: range queries with 500 insert/s per client
- Legend for results is here.
- Each entry lists the percentage of responses that fit in that bucket (slower than max time for previous bucket, faster than min time for next bucket).
Query response time histogram
256us	1ms	4ms	16ms	64ms	256ms	1s	4s	16s	gt	max	tag
99.980	0.015	0.005	nonzero	0.000	0.000	0.000	0.000	0.000	0.000	0.006	pg1211.cx7
99.982	0.014	0.004	nonzero	0.000	0.000	0.000	0.000	0.000	0.000	0.005	pg137.cx7
99.975	0.018	0.007	nonzero	0.000	0.000	0.000	0.000	0.000	0.000	0.005	pg146.cx7
99.976	0.017	0.007	nonzero	0.000	0.000	0.000	0.000	0.000	0.000	0.006	pg151.cx7
Insert response time histogram
256us	1ms	4ms	16ms	64ms	256ms	1s	4s	16s	gt	max	tag
0.000	0.000	99.969	0.031	0.000	0.000	0.000	0.000	0.000	0.000	0.006	pg1211.cx7
0.000	0.000	99.967	0.033	0.000	0.000	0.000	0.000	0.000	0.000	0.006	pg137.cx7
0.000	0.000	99.964	0.036	0.000	0.000	0.000	0.000	0.000	0.000	0.006	pg146.cx7
0.000	0.000	99.947	0.053	0.000	0.000	0.000	0.000	0.000	0.000	0.007	pg151.cx7
q1000.1
- q1000.1: range queries with 1000 insert/s per client
- Legend for results is here.
- Each entry lists the percentage of responses that fit in that bucket (slower than max time for previous bucket, faster than min time for next bucket).
Query response time histogram
256us	1ms	4ms	16ms	64ms	256ms	1s	4s	16s	gt	max	tag
99.951	0.037	0.012	nonzero	0.000	0.000	0.000	0.000	0.000	0.000	0.015	pg1211.cx7
99.953	0.035	0.012	nonzero	0.000	0.000	0.000	0.000	0.000	0.000	0.015	pg137.cx7
99.945	0.040	0.015	nonzero	0.000	0.000	0.000	0.000	0.000	0.000	0.008	pg146.cx7
99.947	0.038	0.015	nonzero	0.000	0.000	0.000	0.000	0.000	0.000	0.007	pg151.cx7
Insert response time histogram
256us	1ms	4ms	16ms	64ms	256ms	1s	4s	16s	gt	max	tag
0.000	0.000	98.428	1.410	0.163	0.000	0.000	0.000	0.000	0.000	0.035	pg1211.cx7
0.000	0.000	98.517	1.328	0.156	0.000	0.000	0.000	0.000	0.000	0.035	pg137.cx7
0.000	0.000	99.037	0.958	0.004	0.000	0.000	0.000	0.000	0.000	0.035	pg146.cx7
0.000	0.000	99.076	0.919	0.004	0.000	0.000	0.000	0.000	0.000	0.035	pg151.cx7