Introduction
This is a report for the insert benchmark with 20M docs and 1 client(s). It is generated by scripts (bash, awk, sed) and Tufte might not be impressed. An overview of the insert benchmark is here and a short update is here. Below, by DBMS, I mean DBMS+version.config. An example is my8020.c10b40 where my means MySQL, 8020 is version 8.0.20 and c10b40 is the name for the configuration file.
The test server is an Intel NUC with 4 cores, 16G RAM and a Samsung 970 EVO. More details are here. Clients and the DBMS share one server. The per-database configs are in the per-database subdirectories here.
The tested DBMS are:
- my5649.cy8 - MySQL 5.6.49 with InnoDB and the cy8 config
- my5735.cy8 - MySQL 5.7.35 with InnoDB and the cy8 config
- my8021.cy8 - MySQL 8.0.21 with InnoDB and the cy8 config
- my8031.cy8 - MySQL 8.0.31 with InnoDB and the cy8 config
Contents
- Summary
- l.i0: load without secondary indexes
- l.x: create secondary indexes
- l.i1: continue load after secondary indexes created
- q100.1: range queries with 100 insert/s per client
- q500.1: range queries with 500 insert/s per client
- q1000.1: range queries with 1000 insert/s per client
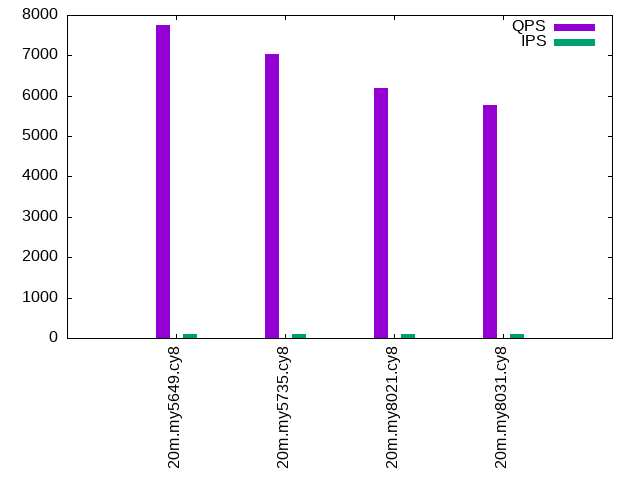
Summary
The numbers are inserts/s for l.i0 and l.i1, indexed docs (or rows) /s for l.x and queries/s for q*.2. The values are the average rate over the entire test for inserts (IPS) and queries (QPS). The range of values for IPS and QPS is split into 3 parts: bottom 25%, middle 50%, top 25%. Values in the bottom 25% have a red background, values in the top 25% have a green background and values in the middle have no color. A gray background is used for values that can be ignored because the DBMS did not sustain the target insert rate. Red backgrounds are not used when the minimum value is within 80% of the max value.
| dbms | l.i0 | l.x | l.i1 | q100.1 | q500.1 | q1000.1 |
|---|---|---|---|---|---|---|
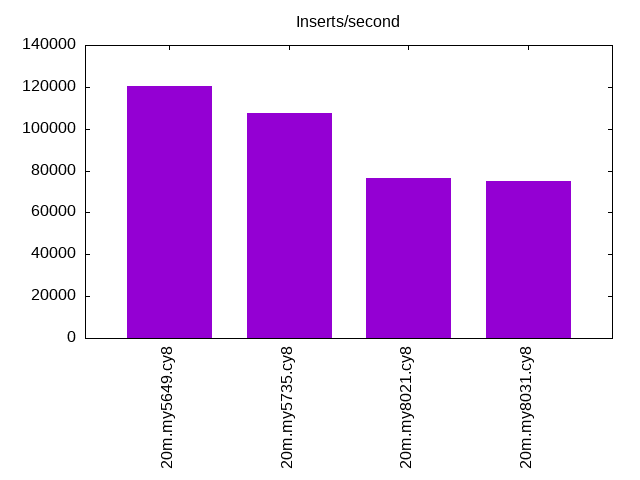
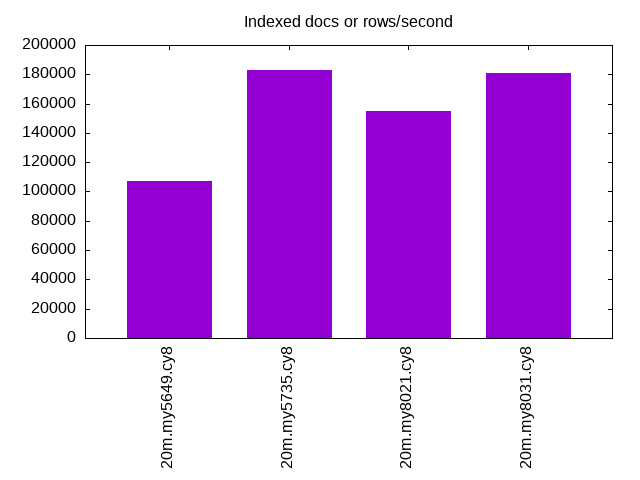
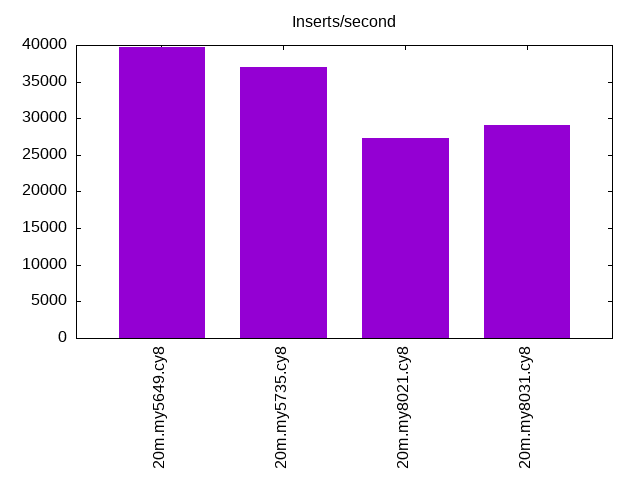
| 20m.my5649.cy8 | 120482 | 107487 | 39761 | 7745 | 7812 | 7800 |
| 20m.my5735.cy8 | 107527 | 182727 | 37037 | 7033 | 6968 | 6897 |
| 20m.my8021.cy8 | 76628 | 154615 | 27285 | 6193 | 6165 | 6153 |
| 20m.my8031.cy8 | 75188 | 181081 | 29028 | 5782 | 5771 | 5694 |
This lists the average rate of inserts/s for the tests that do inserts concurrent with queries. For such tests the query rate is listed in the table above. The read+write tests are setup so that the insert rate should match the target rate every second. Cells that are not at least 95% of the target have a red background to indicate a failure to satisfy the target.
| dbms | q100.1 | q500.1 | q1000.1 |
|---|---|---|---|
| my5649.cy8 | 100 | 499 | 999 |
| my5735.cy8 | 100 | 499 | 999 |
| my8021.cy8 | 100 | 499 | 999 |
| my8031.cy8 | 100 | 499 | 999 |
| target | 100 | 500 | 1000 |
l.i0
l.i0: load without secondary indexes. Graphs for performance per 1-second interval are here.
Average throughput:
Insert response time histogram: each cell has the percentage of responses that take <= the time in the header and max is the max response time in seconds. For the max column values in the top 25% of the range have a red background and in the bottom 25% of the range have a green background. The red background is not used when the min value is within 80% of the max value.
| dbms | 256us | 1ms | 4ms | 16ms | 64ms | 256ms | 1s | 4s | 16s | gt | max |
|---|---|---|---|---|---|---|---|---|---|---|---|
| my5649.cy8 | 98.967 | 0.927 | 0.094 | 0.009 | 0.003 | 0.253 | |||||
| my5735.cy8 | 98.728 | 1.027 | 0.132 | 0.110 | 0.003 | 0.119 | |||||
| my8021.cy8 | 99.567 | 0.345 | 0.088 | 0.054 | |||||||
| my8031.cy8 | 99.625 | 0.256 | 0.120 | 0.051 |
Performance metrics for the DBMS listed above. Some are normalized by throughput, others are not. Legend for results is here.
ips	qps	rps	rmbps	wps	wmbps	rpq	rkbpq	wpi	wkbpi	csps	cpups	cspq	cpupq	dbgb1	dbgb2	rss	maxop	p50	p99	tag
120482	0	1061	4.1	41.3	27.6	0.009	0.035	0.000	0.234	13827	40.1	0.115	13	1.3	41.8	2.1	0.253	122912	83436	20m.my5649.cy8
107527	0	0	0.0	151.4	27.3	0.000	0.000	0.001	0.260	10989	40.1	0.102	15	1.3	41.8	2.3	0.119	108220	82905	20m.my5735.cy8
76628	0	0	0.0	110.9	20.1	0.000	0.000	0.001	0.268	18828	38.2	0.246	20	1.3	41.9	2.5	0.054	77082	71347	20m.my8021.cy8
75188	0	0	0.0	390.7	26.9	0.000	0.000	0.005	0.367	8567	35.5	0.114	19	1.3	3.8	2.5	0.051	75717	69026	20m.my8031.cy8
l.x
l.x: create secondary indexes.
Average throughput:
Performance metrics for the DBMS listed above. Some are normalized by throughput, others are not. Legend for results is here.
ips	qps	rps	rmbps	wps	wmbps	rpq	rkbpq	wpi	wkbpi	csps	cpups	cspq	cpupq	dbgb1	dbgb2	rss	maxop	p50	p99	tag
107487	0	32	0.1	1305.5	113.3	0.000	0.001	0.012	1.079	4031	20.2	0.038	8	2.7	43.2	3.5	0.012	NA	NA	20m.my5649.cy8
182727	0	0	0.0	1991.0	163.6	0.000	0.000	0.011	0.917	9987	23.7	0.055	5	3.0	43.5	3.7	0.016	NA	NA	20m.my5735.cy8
154615	0	0	0.0	1630.7	125.5	0.000	0.000	0.011	0.831	9086	23.6	0.059	6	3.0	43.5	3.0	0.013	NA	NA	20m.my8021.cy8
181081	0	944	63.1	3348.1	185.9	0.005	0.357	0.018	1.051	9871	71.5	0.055	16	3.0	5.4	3.9	0.012	NA	NA	20m.my8031.cy8
l.i1
l.i1: continue load after secondary indexes created. Graphs for performance per 1-second interval are here.
Average throughput:
Insert response time histogram: each cell has the percentage of responses that take <= the time in the header and max is the max response time in seconds. For the max column values in the top 25% of the range have a red background and in the bottom 25% of the range have a green background. The red background is not used when the min value is within 80% of the max value.
| dbms | 256us | 1ms | 4ms | 16ms | 64ms | 256ms | 1s | 4s | 16s | gt | max |
|---|---|---|---|---|---|---|---|---|---|---|---|
| my5649.cy8 | 3.429 | 95.637 | 0.792 | 0.137 | 0.004 | nonzero | 0.292 | ||||
| my5735.cy8 | 99.273 | 0.569 | 0.157 | 0.002 | 0.118 | ||||||
| my8021.cy8 | 99.115 | 0.640 | 0.201 | 0.044 | 0.157 | ||||||
| my8031.cy8 | 98.797 | 0.955 | 0.238 | 0.010 | 0.156 |
Performance metrics for the DBMS listed above. Some are normalized by throughput, others are not. Legend for results is here.
ips	qps	rps	rmbps	wps	wmbps	rpq	rkbpq	wpi	wkbpi	csps	cpups	cspq	cpupq	dbgb1	dbgb2	rss	maxop	p50	p99	tag
39761	0	699	2.7	80.8	25.3	0.018	0.070	0.002	0.651	9232	29.0	0.232	29	7.9	48.4	7.9	0.292	41770	4845	20m.my5649.cy8
37037	0	0	0.0	842.3	45.7	0.000	0.000	0.023	1.265	9818	30.3	0.265	33	7.9	48.4	8.2	0.118	38573	3097	20m.my5735.cy8
27285	0	126	2.0	141.9	18.8	0.005	0.074	0.005	0.706	13836	31.0	0.507	45	7.9	48.4	8.3	0.157	28968	550	20m.my8021.cy8
29028	0	134	2.1	2269.1	75.4	0.005	0.074	0.078	2.662	12607	30.2	0.434	42	7.9	10.3	8.3	0.156	30866	1199	20m.my8031.cy8
q100.1
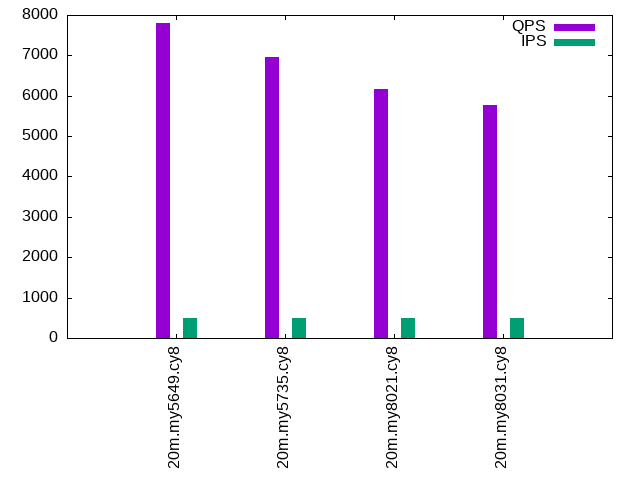
q100.1: range queries with 100 insert/s per client. Graphs for performance per 1-second interval are here.
Average throughput:
Query response time histogram: each cell has the percentage of responses that take <= the time in the header and max is the max response time in seconds. For max values in the top 25% of the range have a red background and in the bottom 25% of the range have a green background. The red background is not used when the min value is within 80% of the max value.
| dbms | 256us | 1ms | 4ms | 16ms | 64ms | 256ms | 1s | 4s | 16s | gt | max |
|---|---|---|---|---|---|---|---|---|---|---|---|
| my5649.cy8 | 97.540 | 2.455 | 0.002 | 0.004 | nonzero | 0.017 | |||||
| my5735.cy8 | 99.837 | 0.163 | nonzero | nonzero | nonzero | 0.020 | |||||
| my8021.cy8 | 99.176 | 0.823 | nonzero | nonzero | nonzero | 0.020 | |||||
| my8031.cy8 | 98.970 | 1.029 | nonzero | nonzero | nonzero | 0.020 |
Insert response time histogram: each cell has the percentage of responses that take <= the time in the header and max is the max response time in seconds. For max values in the top 25% of the range have a red background and in the bottom 25% of the range have a green background. The red background is not used when the min value is within 80% of the max value.
| dbms | 256us | 1ms | 4ms | 16ms | 64ms | 256ms | 1s | 4s | 16s | gt | max |
|---|---|---|---|---|---|---|---|---|---|---|---|
| my5649.cy8 | 55.139 | 43.944 | 0.917 | 0.019 | |||||||
| my5735.cy8 | 99.278 | 0.097 | 0.625 | 0.024 | |||||||
| my8021.cy8 | 98.458 | 1.042 | 0.500 | 0.025 | |||||||
| my8031.cy8 | 99.194 | 0.181 | 0.625 | 0.024 |
Performance metrics for the DBMS listed above. Some are normalized by throughput, others are not. Legend for results is here.
ips	qps	rps	rmbps	wps	wmbps	rpq	rkbpq	wpi	wkbpi	csps	cpups	cspq	cpupq	dbgb1	dbgb2	rss	maxop	p50	p99	tag
100	7745	2	0.0	96.6	3.0	0.000	0.001	0.967	30.301	30020	25.5	3.876	132	8.1	48.6	8.0	0.017	8199	3487	20m.my5649.cy8
100	7033	0	0.0	13.2	0.4	0.000	0.000	0.132	4.061	27053	26.0	3.847	148	8.1	48.6	8.3	0.020	7032	6904	20m.my5735.cy8
100	6193	0	0.0	89.0	2.2	0.000	0.000	0.892	22.118	24686	26.2	3.986	169	8.1	48.6	8.5	0.020	6201	6025	20m.my8021.cy8
100	5782	0	0.0	126.3	3.1	0.000	0.000	1.264	31.505	22796	25.8	3.943	178	8.1	10.5	8.5	0.020	5786	5628	20m.my8031.cy8
q500.1
q500.1: range queries with 500 insert/s per client. Graphs for performance per 1-second interval are here.
Average throughput:
Query response time histogram: each cell has the percentage of responses that take <= the time in the header and max is the max response time in seconds. For max values in the top 25% of the range have a red background and in the bottom 25% of the range have a green background. The red background is not used when the min value is within 80% of the max value.
| dbms | 256us | 1ms | 4ms | 16ms | 64ms | 256ms | 1s | 4s | 16s | gt | max |
|---|---|---|---|---|---|---|---|---|---|---|---|
| my5649.cy8 | 97.960 | 2.033 | 0.003 | 0.004 | nonzero | 0.017 | |||||
| my5735.cy8 | 99.660 | 0.338 | 0.002 | nonzero | nonzero | 0.023 | |||||
| my8021.cy8 | 99.113 | 0.885 | 0.001 | nonzero | nonzero | 0.020 | |||||
| my8031.cy8 | 98.661 | 1.337 | 0.002 | nonzero | nonzero | 0.024 |
Insert response time histogram: each cell has the percentage of responses that take <= the time in the header and max is the max response time in seconds. For max values in the top 25% of the range have a red background and in the bottom 25% of the range have a green background. The red background is not used when the min value is within 80% of the max value.
| dbms | 256us | 1ms | 4ms | 16ms | 64ms | 256ms | 1s | 4s | 16s | gt | max |
|---|---|---|---|---|---|---|---|---|---|---|---|
| my5649.cy8 | 0.075 | 90.369 | 9.453 | 0.103 | 0.018 | ||||||
| my5735.cy8 | 99.497 | 0.103 | 0.400 | 0.026 | |||||||
| my8021.cy8 | 98.867 | 0.964 | 0.169 | 0.026 | |||||||
| my8031.cy8 | 99.419 | 0.183 | 0.397 | 0.028 |
Performance metrics for the DBMS listed above. Some are normalized by throughput, others are not. Legend for results is here.
ips	qps	rps	rmbps	wps	wmbps	rpq	rkbpq	wpi	wkbpi	csps	cpups	cspq	cpupq	dbgb1	dbgb2	rss	maxop	p50	p99	tag
499	7812	9	0.0	2.7	0.4	0.001	0.005	0.005	0.771	30062	25.7	3.848	132	8.7	49.2	8.6	0.017	8183	3932	20m.my5649.cy8
499	6968	0	0.0	17.9	0.7	0.000	0.000	0.036	1.521	26885	26.4	3.858	152	8.7	49.2	8.9	0.023	6971	6553	20m.my5735.cy8
499	6165	0	0.0	7.9	0.5	0.000	0.000	0.016	0.956	24481	26.5	3.971	172	8.7	49.3	9.1	0.020	6170	5948	20m.my8021.cy8
499	5771	0	0.0	232.9	6.1	0.000	0.000	0.466	12.453	23075	26.4	3.998	183	8.7	11.1	9.1	0.024	5786	5418	20m.my8031.cy8
q1000.1
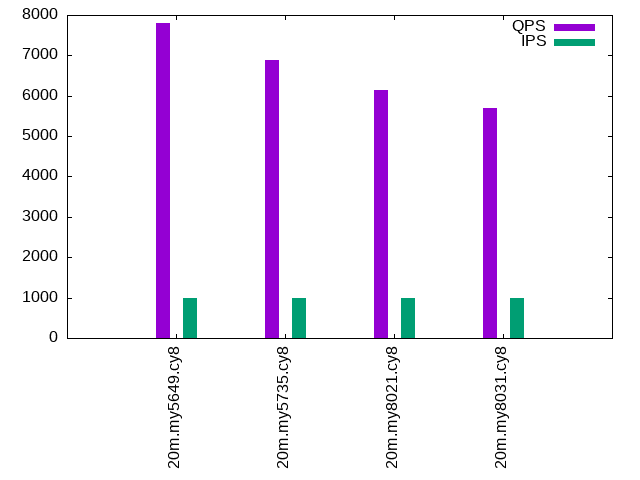
q1000.1: range queries with 1000 insert/s per client. Graphs for performance per 1-second interval are here.
Average throughput:
Query response time histogram: each cell has the percentage of responses that take <= the time in the header and max is the max response time in seconds. For max values in the top 25% of the range have a red background and in the bottom 25% of the range have a green background. The red background is not used when the min value is within 80% of the max value.
| dbms | 256us | 1ms | 4ms | 16ms | 64ms | 256ms | 1s | 4s | 16s | gt | max |
|---|---|---|---|---|---|---|---|---|---|---|---|
| my5649.cy8 | 98.350 | 1.642 | 0.005 | 0.003 | nonzero | 0.016 | |||||
| my5735.cy8 | 99.546 | 0.450 | 0.004 | nonzero | nonzero | 0.023 | |||||
| my8021.cy8 | 99.093 | 0.904 | 0.002 | nonzero | nonzero | 0.021 | |||||
| my8031.cy8 | 98.215 | 1.780 | 0.005 | nonzero | nonzero | 0.022 |
Insert response time histogram: each cell has the percentage of responses that take <= the time in the header and max is the max response time in seconds. For max values in the top 25% of the range have a red background and in the bottom 25% of the range have a green background. The red background is not used when the min value is within 80% of the max value.
| dbms | 256us | 1ms | 4ms | 16ms | 64ms | 256ms | 1s | 4s | 16s | gt | max |
|---|---|---|---|---|---|---|---|---|---|---|---|
| my5649.cy8 | 0.164 | 94.943 | 4.869 | 0.024 | 0.019 | ||||||
| my5735.cy8 | 99.806 | 0.064 | 0.131 | 0.042 | |||||||
| my8021.cy8 | 98.886 | 1.032 | 0.082 | 0.026 | |||||||
| my8031.cy8 | 99.715 | 0.151 | 0.133 | 0.041 |
Performance metrics for the DBMS listed above. Some are normalized by throughput, others are not. Legend for results is here.
ips	qps	rps	rmbps	wps	wmbps	rpq	rkbpq	wpi	wkbpi	csps	cpups	cspq	cpupq	dbgb1	dbgb2	rss	maxop	p50	p99	tag
999	7800	18	0.1	2.5	0.4	0.002	0.009	0.003	0.445	30114	26.2	3.861	134	9.1	49.6	9.0	0.016	8103	4315	20m.my5649.cy8
999	6897	0	0.0	30.6	1.1	0.000	0.000	0.031	1.129	26746	26.8	3.878	155	9.1	49.7	9.3	0.023	6904	6776	20m.my5735.cy8
999	6153	0	0.0	15.6	0.7	0.000	0.000	0.016	0.718	24722	26.9	4.018	175	9.1	49.7	9.5	0.021	6155	5995	20m.my8021.cy8
999	5694	0	0.0	372.3	9.6	0.000	0.000	0.373	9.889	23218	26.8	4.078	188	9.1	11.6	9.5	0.022	5691	5562	20m.my8031.cy8
l.i0
l.i0: load without secondary indexes
Performance metrics for all DBMS, not just the ones listed above. Some are normalized by throughput, others are not. Legend for results is here.
ips	qps	rps	rmbps	wps	wmbps	rpq	rkbpq	wpi	wkbpi	csps	cpups	cspq	cpupq	dbgb1	dbgb2	rss	maxop	p50	p99	tag
120482	0	1061	4.1	41.3	27.6	0.009	0.035	0.000	0.234	13827	40.1	0.115	13	1.3	41.8	2.1	0.253	122912	83436	20m.my5649.cy8
107527	0	0	0.0	151.4	27.3	0.000	0.000	0.001	0.260	10989	40.1	0.102	15	1.3	41.8	2.3	0.119	108220	82905	20m.my5735.cy8
76628	0	0	0.0	110.9	20.1	0.000	0.000	0.001	0.268	18828	38.2	0.246	20	1.3	41.9	2.5	0.054	77082	71347	20m.my8021.cy8
75188	0	0	0.0	390.7	26.9	0.000	0.000	0.005	0.367	8567	35.5	0.114	19	1.3	3.8	2.5	0.051	75717	69026	20m.my8031.cy8
l.x
l.x: create secondary indexes
Performance metrics for all DBMS, not just the ones listed above. Some are normalized by throughput, others are not. Legend for results is here.
ips	qps	rps	rmbps	wps	wmbps	rpq	rkbpq	wpi	wkbpi	csps	cpups	cspq	cpupq	dbgb1	dbgb2	rss	maxop	p50	p99	tag
107487	0	32	0.1	1305.5	113.3	0.000	0.001	0.012	1.079	4031	20.2	0.038	8	2.7	43.2	3.5	0.012	NA	NA	20m.my5649.cy8
182727	0	0	0.0	1991.0	163.6	0.000	0.000	0.011	0.917	9987	23.7	0.055	5	3.0	43.5	3.7	0.016	NA	NA	20m.my5735.cy8
154615	0	0	0.0	1630.7	125.5	0.000	0.000	0.011	0.831	9086	23.6	0.059	6	3.0	43.5	3.0	0.013	NA	NA	20m.my8021.cy8
181081	0	944	63.1	3348.1	185.9	0.005	0.357	0.018	1.051	9871	71.5	0.055	16	3.0	5.4	3.9	0.012	NA	NA	20m.my8031.cy8
l.i1
l.i1: continue load after secondary indexes created
Performance metrics for all DBMS, not just the ones listed above. Some are normalized by throughput, others are not. Legend for results is here.
ips	qps	rps	rmbps	wps	wmbps	rpq	rkbpq	wpi	wkbpi	csps	cpups	cspq	cpupq	dbgb1	dbgb2	rss	maxop	p50	p99	tag
39761	0	699	2.7	80.8	25.3	0.018	0.070	0.002	0.651	9232	29.0	0.232	29	7.9	48.4	7.9	0.292	41770	4845	20m.my5649.cy8
37037	0	0	0.0	842.3	45.7	0.000	0.000	0.023	1.265	9818	30.3	0.265	33	7.9	48.4	8.2	0.118	38573	3097	20m.my5735.cy8
27285	0	126	2.0	141.9	18.8	0.005	0.074	0.005	0.706	13836	31.0	0.507	45	7.9	48.4	8.3	0.157	28968	550	20m.my8021.cy8
29028	0	134	2.1	2269.1	75.4	0.005	0.074	0.078	2.662	12607	30.2	0.434	42	7.9	10.3	8.3	0.156	30866	1199	20m.my8031.cy8
q100.1
q100.1: range queries with 100 insert/s per client
Performance metrics for all DBMS, not just the ones listed above. Some are normalized by throughput, others are not. Legend for results is here.
ips	qps	rps	rmbps	wps	wmbps	rpq	rkbpq	wpi	wkbpi	csps	cpups	cspq	cpupq	dbgb1	dbgb2	rss	maxop	p50	p99	tag
100	7745	2	0.0	96.6	3.0	0.000	0.001	0.967	30.301	30020	25.5	3.876	132	8.1	48.6	8.0	0.017	8199	3487	20m.my5649.cy8
100	7033	0	0.0	13.2	0.4	0.000	0.000	0.132	4.061	27053	26.0	3.847	148	8.1	48.6	8.3	0.020	7032	6904	20m.my5735.cy8
100	6193	0	0.0	89.0	2.2	0.000	0.000	0.892	22.118	24686	26.2	3.986	169	8.1	48.6	8.5	0.020	6201	6025	20m.my8021.cy8
100	5782	0	0.0	126.3	3.1	0.000	0.000	1.264	31.505	22796	25.8	3.943	178	8.1	10.5	8.5	0.020	5786	5628	20m.my8031.cy8
q500.1
q500.1: range queries with 500 insert/s per client
Performance metrics for all DBMS, not just the ones listed above. Some are normalized by throughput, others are not. Legend for results is here.
ips	qps	rps	rmbps	wps	wmbps	rpq	rkbpq	wpi	wkbpi	csps	cpups	cspq	cpupq	dbgb1	dbgb2	rss	maxop	p50	p99	tag
499	7812	9	0.0	2.7	0.4	0.001	0.005	0.005	0.771	30062	25.7	3.848	132	8.7	49.2	8.6	0.017	8183	3932	20m.my5649.cy8
499	6968	0	0.0	17.9	0.7	0.000	0.000	0.036	1.521	26885	26.4	3.858	152	8.7	49.2	8.9	0.023	6971	6553	20m.my5735.cy8
499	6165	0	0.0	7.9	0.5	0.000	0.000	0.016	0.956	24481	26.5	3.971	172	8.7	49.3	9.1	0.020	6170	5948	20m.my8021.cy8
499	5771	0	0.0	232.9	6.1	0.000	0.000	0.466	12.453	23075	26.4	3.998	183	8.7	11.1	9.1	0.024	5786	5418	20m.my8031.cy8
q1000.1
q1000.1: range queries with 1000 insert/s per client
Performance metrics for all DBMS, not just the ones listed above. Some are normalized by throughput, others are not. Legend for results is here.
ips	qps	rps	rmbps	wps	wmbps	rpq	rkbpq	wpi	wkbpi	csps	cpups	cspq	cpupq	dbgb1	dbgb2	rss	maxop	p50	p99	tag
999	7800	18	0.1	2.5	0.4	0.002	0.009	0.003	0.445	30114	26.2	3.861	134	9.1	49.6	9.0	0.016	8103	4315	20m.my5649.cy8
999	6897	0	0.0	30.6	1.1	0.000	0.000	0.031	1.129	26746	26.8	3.878	155	9.1	49.7	9.3	0.023	6904	6776	20m.my5735.cy8
999	6153	0	0.0	15.6	0.7	0.000	0.000	0.016	0.718	24722	26.9	4.018	175	9.1	49.7	9.5	0.021	6155	5995	20m.my8021.cy8
999	5694	0	0.0	372.3	9.6	0.000	0.000	0.373	9.889	23218	26.8	4.078	188	9.1	11.6	9.5	0.022	5691	5562	20m.my8031.cy8
l.i0
- l.i0: load without secondary indexes
- Legend for results is here.
- Each entry lists the percentage of responses that fit in that bucket (slower than max time for previous bucket, faster than min time for next bucket).
Insert response time histogram
256us	1ms	4ms	16ms	64ms	256ms	1s	4s	16s	gt	max	tag
0.000	98.967	0.927	0.094	0.009	0.003	0.000	0.000	0.000	0.000	0.253	my5649.cy8
0.000	98.728	1.027	0.132	0.110	0.003	0.000	0.000	0.000	0.000	0.119	my5735.cy8
0.000	0.000	99.567	0.345	0.088	0.000	0.000	0.000	0.000	0.000	0.054	my8021.cy8
0.000	0.000	99.625	0.256	0.120	0.000	0.000	0.000	0.000	0.000	0.051	my8031.cy8
l.x
- l.x: create secondary indexes
- Legend for results is here.
- Each entry lists the percentage of responses that fit in that bucket (slower than max time for previous bucket, faster than min time for next bucket).
TODO - determine whether there is data for create index response time
l.i1
- l.i1: continue load after secondary indexes created
- Legend for results is here.
- Each entry lists the percentage of responses that fit in that bucket (slower than max time for previous bucket, faster than min time for next bucket).
Insert response time histogram
256us	1ms	4ms	16ms	64ms	256ms	1s	4s	16s	gt	max	tag
0.000	3.429	95.637	0.792	0.137	0.004	nonzero	0.000	0.000	0.000	0.292	my5649.cy8
0.000	0.000	99.273	0.569	0.157	0.002	0.000	0.000	0.000	0.000	0.118	my5735.cy8
0.000	0.000	99.115	0.640	0.201	0.044	0.000	0.000	0.000	0.000	0.157	my8021.cy8
0.000	0.000	98.797	0.955	0.238	0.010	0.000	0.000	0.000	0.000	0.156	my8031.cy8
q100.1
- q100.1: range queries with 100 insert/s per client
- Legend for results is here.
- Each entry lists the percentage of responses that fit in that bucket (slower than max time for previous bucket, faster than min time for next bucket).
Query response time histogram
256us	1ms	4ms	16ms	64ms	256ms	1s	4s	16s	gt	max	tag
97.540	2.455	0.002	0.004	nonzero	0.000	0.000	0.000	0.000	0.000	0.017	my5649.cy8
99.837	0.163	nonzero	nonzero	nonzero	0.000	0.000	0.000	0.000	0.000	0.020	my5735.cy8
99.176	0.823	nonzero	nonzero	nonzero	0.000	0.000	0.000	0.000	0.000	0.020	my8021.cy8
98.970	1.029	nonzero	nonzero	nonzero	0.000	0.000	0.000	0.000	0.000	0.020	my8031.cy8
Insert response time histogram
256us	1ms	4ms	16ms	64ms	256ms	1s	4s	16s	gt	max	tag
0.000	0.000	55.139	43.944	0.917	0.000	0.000	0.000	0.000	0.000	0.019	my5649.cy8
0.000	0.000	99.278	0.097	0.625	0.000	0.000	0.000	0.000	0.000	0.024	my5735.cy8
0.000	0.000	98.458	1.042	0.500	0.000	0.000	0.000	0.000	0.000	0.025	my8021.cy8
0.000	0.000	99.194	0.181	0.625	0.000	0.000	0.000	0.000	0.000	0.024	my8031.cy8
q500.1
- q500.1: range queries with 500 insert/s per client
- Legend for results is here.
- Each entry lists the percentage of responses that fit in that bucket (slower than max time for previous bucket, faster than min time for next bucket).
Query response time histogram
256us	1ms	4ms	16ms	64ms	256ms	1s	4s	16s	gt	max	tag
97.960	2.033	0.003	0.004	nonzero	0.000	0.000	0.000	0.000	0.000	0.017	my5649.cy8
99.660	0.338	0.002	nonzero	nonzero	0.000	0.000	0.000	0.000	0.000	0.023	my5735.cy8
99.113	0.885	0.001	nonzero	nonzero	0.000	0.000	0.000	0.000	0.000	0.020	my8021.cy8
98.661	1.337	0.002	nonzero	nonzero	0.000	0.000	0.000	0.000	0.000	0.024	my8031.cy8
Insert response time histogram
256us	1ms	4ms	16ms	64ms	256ms	1s	4s	16s	gt	max	tag
0.000	0.075	90.369	9.453	0.103	0.000	0.000	0.000	0.000	0.000	0.018	my5649.cy8
0.000	0.000	99.497	0.103	0.400	0.000	0.000	0.000	0.000	0.000	0.026	my5735.cy8
0.000	0.000	98.867	0.964	0.169	0.000	0.000	0.000	0.000	0.000	0.026	my8021.cy8
0.000	0.000	99.419	0.183	0.397	0.000	0.000	0.000	0.000	0.000	0.028	my8031.cy8
q1000.1
- q1000.1: range queries with 1000 insert/s per client
- Legend for results is here.
- Each entry lists the percentage of responses that fit in that bucket (slower than max time for previous bucket, faster than min time for next bucket).
Query response time histogram
256us	1ms	4ms	16ms	64ms	256ms	1s	4s	16s	gt	max	tag
98.350	1.642	0.005	0.003	nonzero	0.000	0.000	0.000	0.000	0.000	0.016	my5649.cy8
99.546	0.450	0.004	nonzero	nonzero	0.000	0.000	0.000	0.000	0.000	0.023	my5735.cy8
99.093	0.904	0.002	nonzero	nonzero	0.000	0.000	0.000	0.000	0.000	0.021	my8021.cy8
98.215	1.780	0.005	nonzero	nonzero	0.000	0.000	0.000	0.000	0.000	0.022	my8031.cy8
Insert response time histogram
256us	1ms	4ms	16ms	64ms	256ms	1s	4s	16s	gt	max	tag
0.000	0.164	94.943	4.869	0.024	0.000	0.000	0.000	0.000	0.000	0.019	my5649.cy8
0.000	0.000	99.806	0.064	0.131	0.000	0.000	0.000	0.000	0.000	0.042	my5735.cy8
0.000	0.000	98.886	1.032	0.082	0.000	0.000	0.000	0.000	0.000	0.026	my8021.cy8
0.000	0.000	99.715	0.151	0.133	0.000	0.000	0.000	0.000	0.000	0.041	my8031.cy8