Introduction
This is a report for the insert benchmark with 500M docs and 1 client(s). It is generated by scripts (bash, awk, sed) and Tufte might not be impressed. An overview of the insert benchmark is here and a short update is here. Below, by DBMS, I mean DBMS+version.config. An example is my8020.c10b40 where my means MySQL, 8020 is version 8.0.20 and c10b40 is the name for the configuration file.
The test server is an Intel NUC with 4 cores, 16G RAM and a Samsung 970 EVO. More details are here. Clients and the DBMS share one server. The per-database configs are in the per-database subdirectories here.
The tested DBMS are:
- pg1211.cx7 - Postgres 12.11 and the cx7 config
- pg137.cx7 - Postgres 13.7 and the cx7 config
- pg143.cx7 - Postgres 14.3 and the cx7 config
- pg15b1.cx7 - Postgres 15beta1 and the cx7 config
- pg15b1p1.cx7 - Postgres 15beta1 and the cx7 config with these patches
Contents
- Summary
- l.i0: load without secondary indexes
- l.x: create secondary indexes
- l.i1: continue load after secondary indexes created
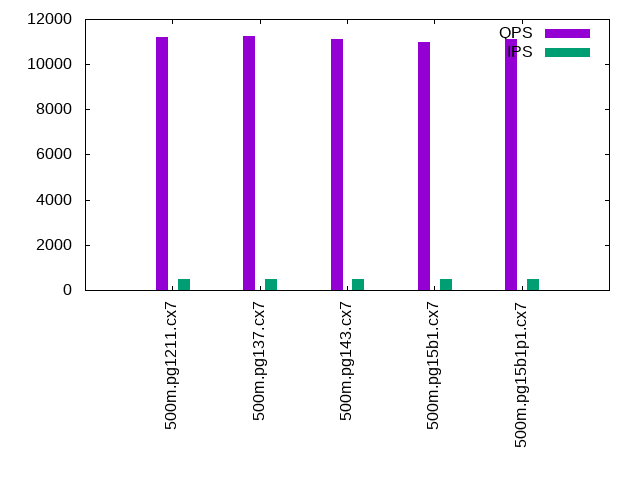
- q100.1: range queries with 100 insert/s per client
- q500.1: range queries with 500 insert/s per client
- q1000.1: range queries with 1000 insert/s per client
Summary
The numbers are inserts/s for l.i0 and l.i1, indexed docs (or rows) /s for l.x and queries/s for q*.2. The values are the average rate over the entire test for inserts (IPS) and queries (QPS). The range of values for IPS and QPS is split into 3 parts: bottom 25%, middle 50%, top 25%. Values in the bottom 25% have a red background, values in the top 25% have a green background and values in the middle have no color. A gray background is used for values that can be ignored because the DBMS did not sustain the target insert rate. Red backgrounds are not used when the minimum value is within 80% of the max value.
| dbms | l.i0 | l.x | l.i1 | q100.1 | q500.1 | q1000.1 |
|---|---|---|---|---|---|---|
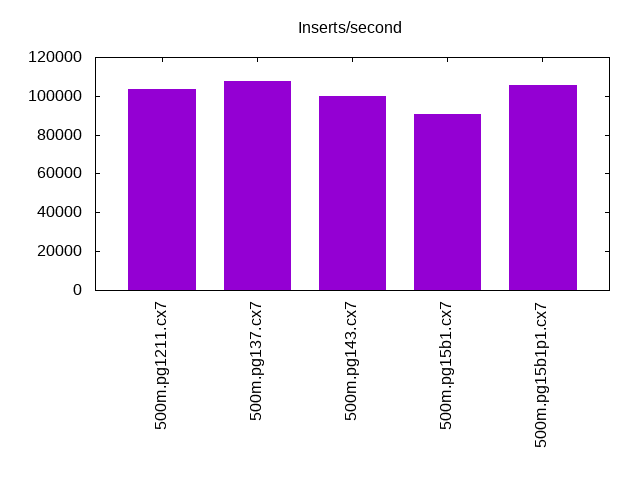
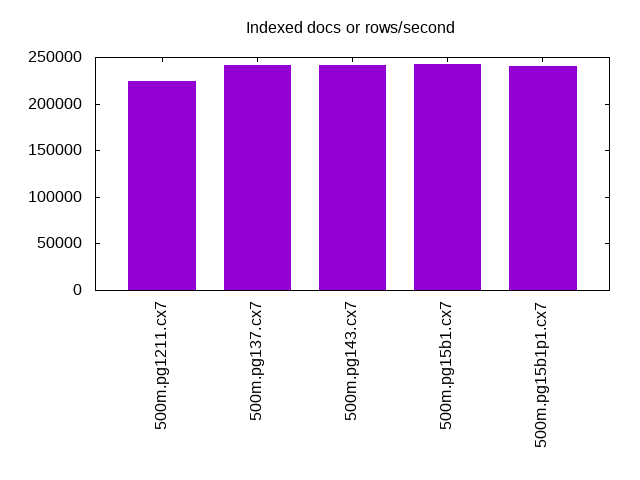
| 500m.pg1211.cx7 | 103713 | 223858 | 2545 | 11005 | 11191 | 11080 |
| 500m.pg137.cx7 | 107689 | 241828 | 2611 | 11092 | 11230 | 11176 |
| 500m.pg143.cx7 | 100080 | 241945 | 2544 | 11056 | 11104 | 11016 |
| 500m.pg15b1.cx7 | 90612 | 242179 | 2541 | 10901 | 10973 | 10809 |
| 500m.pg15b1p1.cx7 | 105708 | 240433 | 2552 | 11099 | 11118 | 11050 |
This lists the average rate of inserts/s for the tests that do inserts concurrent with queries. For such tests the query rate is listed in the table above. The read+write tests are setup so that the insert rate should match the target rate every second. Cells that are not at least 95% of the target have a red background to indicate a failure to satisfy the target.
| dbms | q100.1 | q500.1 | q1000.1 |
|---|---|---|---|
| pg1211.cx7 | 100 | 499 | 999 |
| pg137.cx7 | 100 | 500 | 999 |
| pg143.cx7 | 100 | 499 | 999 |
| pg15b1.cx7 | 100 | 499 | 999 |
| pg15b1p1.cx7 | 100 | 500 | 999 |
| target | 100 | 500 | 1000 |
l.i0
l.i0: load without secondary indexes. Graphs for performance per 1-second interval are here.
Average throughput:
Insert response time histogram: each cell has the percentage of responses that take <= the time in the header and max is the max response time in seconds. For the max column values in the top 25% of the range have a red background and in the bottom 25% of the range have a green background. The red background is not used when the min value is within 80% of the max value.
| dbms | 256us | 1ms | 4ms | 16ms | 64ms | 256ms | 1s | 4s | 16s | gt | max |
|---|---|---|---|---|---|---|---|---|---|---|---|
| pg1211.cx7 | 95.179 | 4.819 | 0.002 | nonzero | nonzero | 0.190 | |||||
| pg137.cx7 | 97.165 | 2.831 | 0.003 | 0.001 | nonzero | 0.164 | |||||
| pg143.cx7 | 76.414 | 23.582 | 0.003 | 0.001 | nonzero | 0.166 | |||||
| pg15b1.cx7 | 0.122 | 99.876 | 0.002 | nonzero | nonzero | 0.155 | |||||
| pg15b1p1.cx7 | 96.646 | 3.351 | 0.002 | nonzero | nonzero | 0.191 |
Performance metrics for the DBMS listed above. Some are normalized by throughput, others are not. Legend for results is here.
ips	qps	rps	rmbps	wps	wmbps	rpq	rkbpq	wpi	wkbpi	csps	cpups	cspq	cpupq	dbgb1	dbgb2	rss	maxop	p50	p99	tag
103713	0	45	0.4	197.2	39.9	0.000	0.004	0.002	0.394	12408	42.5	0.120	16	47.8	55.9	0.0	0.190	103827	99494	500m.pg1211.cx7
107689	0	39	0.3	162.2	51.5	0.000	0.003	0.002	0.490	12949	43.7	0.120	16	47.8	63.0	0.0	0.164	108085	101689	500m.pg137.cx7
100080	0	41	0.3	142.4	46.9	0.000	0.003	0.001	0.480	12030	44.1	0.120	18	47.8	63.6	0.0	0.166	100564	94696	500m.pg143.cx7
90612	0	38	0.3	128.3	42.4	0.000	0.003	0.001	0.479	10912	42.4	0.120	19	47.8	63.2	0.0	0.155	90704	86385	500m.pg15b1.cx7
105708	0	40	0.3	144.2	48.5	0.000	0.003	0.001	0.470	12609	44.5	0.119	17	47.8	64.3	0.0	0.191	106085	99794	500m.pg15b1p1.cx7
l.x
l.x: create secondary indexes.
Average throughput:
Performance metrics for the DBMS listed above. Some are normalized by throughput, others are not. Legend for results is here.
ips	qps	rps	rmbps	wps	wmbps	rpq	rkbpq	wpi	wkbpi	csps	cpups	cspq	cpupq	dbgb1	dbgb2	rss	maxop	p50	p99	tag
223858	0	577	70.0	486.4	105.4	0.003	0.320	0.002	0.482	1028	23.0	0.005	4	91.9	115.5	0.0	0.003	NA	NA	500m.pg1211.cx7
241828	0	592	73.6	196.9	75.9	0.002	0.312	0.001	0.321	526	23.2	0.002	4	91.9	107.0	0.0	0.004	NA	NA	500m.pg137.cx7
241945	0	593	73.6	195.2	75.6	0.002	0.311	0.001	0.320	587	23.2	0.002	4	91.9	108.9	0.0	0.003	NA	NA	500m.pg143.cx7
242179	0	670	82.9	224.3	88.2	0.003	0.351	0.001	0.373	695	23.3	0.003	4	91.9	110.9	0.0	0.003	NA	NA	500m.pg15b1.cx7
240433	0	664	82.4	220.7	87.0	0.003	0.351	0.001	0.371	601	23.1	0.002	4	91.9	109.2	0.0	0.003	NA	NA	500m.pg15b1p1.cx7
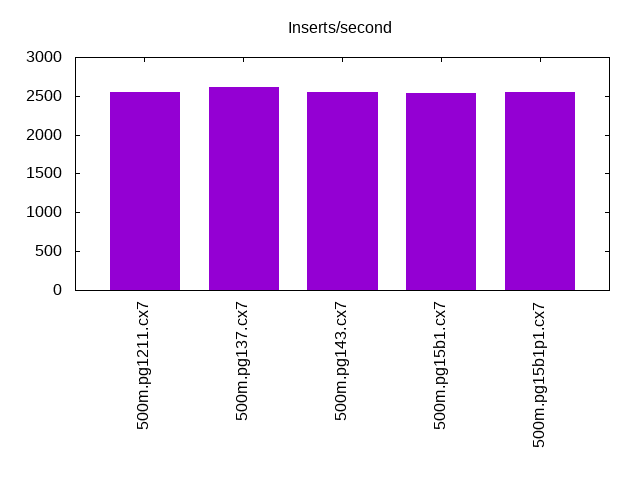
l.i1
l.i1: continue load after secondary indexes created. Graphs for performance per 1-second interval are here.
Average throughput:
Insert response time histogram: each cell has the percentage of responses that take <= the time in the header and max is the max response time in seconds. For the max column values in the top 25% of the range have a red background and in the bottom 25% of the range have a green background. The red background is not used when the min value is within 80% of the max value.
| dbms | 256us | 1ms | 4ms | 16ms | 64ms | 256ms | 1s | 4s | 16s | gt | max |
|---|---|---|---|---|---|---|---|---|---|---|---|
| pg1211.cx7 | 32.427 | 67.526 | 0.046 | 0.135 | |||||||
| pg137.cx7 | 34.766 | 65.124 | 0.111 | 0.148 | |||||||
| pg143.cx7 | 32.624 | 67.284 | 0.091 | 0.116 | |||||||
| pg15b1.cx7 | 32.864 | 67.018 | 0.118 | 0.210 | |||||||
| pg15b1p1.cx7 | 33.149 | 66.741 | 0.110 | 0.173 |
Performance metrics for the DBMS listed above. Some are normalized by throughput, others are not. Legend for results is here.
ips	qps	rps	rmbps	wps	wmbps	rpq	rkbpq	wpi	wkbpi	csps	cpups	cspq	cpupq	dbgb1	dbgb2	rss	maxop	p50	p99	tag
2545	0	3403	27.3	4288.1	68.3	1.337	10.971	1.685	27.498	7891	22.7	3.100	357	93.6	114.1	0.0	0.135	2549	1548	500m.pg1211.cx7
2611	0	3523	28.2	4462.6	71.2	1.349	11.066	1.709	27.910	8233	22.8	3.153	349	93.6	113.1	0.0	0.148	2647	1598	500m.pg137.cx7
2544	0	3422	27.4	4321.8	69.8	1.345	11.032	1.698	28.101	7949	20.9	3.124	329	93.6	120.0	0.0	0.116	2597	1348	500m.pg143.cx7
2541	0	3425	27.4	4335.0	68.3	1.348	11.056	1.706	27.519	7835	20.5	3.083	323	93.6	117.5	0.0	0.210	2597	1248	500m.pg15b1.cx7
2552	0	3438	27.5	4330.0	69.8	1.347	11.049	1.696	27.988	7940	20.7	3.111	324	93.6	120.1	0.0	0.173	2647	1398	500m.pg15b1p1.cx7
q100.1
q100.1: range queries with 100 insert/s per client. Graphs for performance per 1-second interval are here.
Average throughput:

Query response time histogram: each cell has the percentage of responses that take <= the time in the header and max is the max response time in seconds. For max values in the top 25% of the range have a red background and in the bottom 25% of the range have a green background. The red background is not used when the min value is within 80% of the max value.
| dbms | 256us | 1ms | 4ms | 16ms | 64ms | 256ms | 1s | 4s | 16s | gt | max |
|---|---|---|---|---|---|---|---|---|---|---|---|
| pg1211.cx7 | 99.720 | 0.279 | 0.001 | nonzero | 0.015 | ||||||
| pg137.cx7 | 99.565 | 0.430 | 0.004 | 0.002 | nonzero | nonzero | 0.075 | ||||
| pg143.cx7 | 99.701 | 0.291 | 0.006 | 0.001 | nonzero | nonzero | 0.103 | ||||
| pg15b1.cx7 | 99.770 | 0.224 | 0.005 | 0.001 | nonzero | 0.061 | |||||
| pg15b1p1.cx7 | 99.889 | 0.107 | 0.004 | nonzero | nonzero | 0.061 |
Insert response time histogram: each cell has the percentage of responses that take <= the time in the header and max is the max response time in seconds. For max values in the top 25% of the range have a red background and in the bottom 25% of the range have a green background. The red background is not used when the min value is within 80% of the max value.
| dbms | 256us | 1ms | 4ms | 16ms | 64ms | 256ms | 1s | 4s | 16s | gt | max |
|---|---|---|---|---|---|---|---|---|---|---|---|
| pg1211.cx7 | 85.257 | 14.743 | 0.032 | ||||||||
| pg137.cx7 | 84.292 | 15.708 | 0.059 | ||||||||
| pg143.cx7 | 95.778 | 4.215 | 0.007 | 0.118 | |||||||
| pg15b1.cx7 | 96.056 | 3.938 | 0.007 | 0.586 | |||||||
| pg15b1p1.cx7 | 97.000 | 2.993 | 0.007 | 0.110 |
Performance metrics for the DBMS listed above. Some are normalized by throughput, others are not. Legend for results is here.
ips	qps	rps	rmbps	wps	wmbps	rpq	rkbpq	wpi	wkbpi	csps	cpups	cspq	cpupq	dbgb1	dbgb2	rss	maxop	p50	p99	tag
100	11005	137	1.1	269.8	4.2	0.012	0.102	2.704	42.929	42591	28.1	3.870	102	93.7	98.0	0.0	0.015	11140	3116	500m.pg1211.cx7
100	11092	139	1.1	288.6	4.4	0.013	0.103	2.892	44.697	42925	28.1	3.870	101	93.7	98.3	0.0	0.075	11335	2445	500m.pg137.cx7
100	11056	139	1.1	333.7	4.8	0.013	0.104	3.344	49.119	42715	26.7	3.863	97	93.7	104.8	0.0	0.103	11239	2879	500m.pg143.cx7
100	10901	139	1.1	311.8	4.6	0.013	0.105	3.124	47.258	42094	26.7	3.861	98	93.7	102.3	0.0	0.061	11044	3468	500m.pg15b1.cx7
100	11099	139	1.1	278.4	4.3	0.013	0.103	2.790	44.270	42840	26.5	3.860	96	93.7	104.5	0.0	0.061	11188	7256	500m.pg15b1p1.cx7
q500.1
q500.1: range queries with 500 insert/s per client. Graphs for performance per 1-second interval are here.
Average throughput:
Query response time histogram: each cell has the percentage of responses that take <= the time in the header and max is the max response time in seconds. For max values in the top 25% of the range have a red background and in the bottom 25% of the range have a green background. The red background is not used when the min value is within 80% of the max value.
| dbms | 256us | 1ms | 4ms | 16ms | 64ms | 256ms | 1s | 4s | 16s | gt | max |
|---|---|---|---|---|---|---|---|---|---|---|---|
| pg1211.cx7 | 99.977 | 0.021 | 0.001 | nonzero | 0.005 | ||||||
| pg137.cx7 | 99.977 | 0.022 | 0.001 | nonzero | 0.008 | ||||||
| pg143.cx7 | 99.974 | 0.025 | 0.002 | nonzero | 0.005 | ||||||
| pg15b1.cx7 | 99.974 | 0.024 | 0.002 | nonzero | 0.008 | ||||||
| pg15b1p1.cx7 | 99.974 | 0.024 | 0.002 | nonzero | 0.011 |
Insert response time histogram: each cell has the percentage of responses that take <= the time in the header and max is the max response time in seconds. For max values in the top 25% of the range have a red background and in the bottom 25% of the range have a green background. The red background is not used when the min value is within 80% of the max value.
| dbms | 256us | 1ms | 4ms | 16ms | 64ms | 256ms | 1s | 4s | 16s | gt | max |
|---|---|---|---|---|---|---|---|---|---|---|---|
| pg1211.cx7 | 96.867 | 3.122 | 0.011 | 0.080 | |||||||
| pg137.cx7 | 96.539 | 3.446 | 0.015 | 0.111 | |||||||
| pg143.cx7 | 95.378 | 4.614 | 0.008 | 0.098 | |||||||
| pg15b1.cx7 | 95.375 | 4.618 | 0.007 | 0.079 | |||||||
| pg15b1p1.cx7 | 96.736 | 3.264 | 0.061 |
Performance metrics for the DBMS listed above. Some are normalized by throughput, others are not. Legend for results is here.
ips	qps	rps	rmbps	wps	wmbps	rpq	rkbpq	wpi	wkbpi	csps	cpups	cspq	cpupq	dbgb1	dbgb2	rss	maxop	p50	p99	tag
499	11191	657	5.2	1053.9	18.2	0.059	0.476	2.110	37.301	44406	28.7	3.968	103	94.6	98.8	0.0	0.005	11204	11012	500m.pg1211.cx7
500	11230	658	5.2	1054.8	18.2	0.059	0.475	2.112	37.249	44551	28.7	3.967	102	94.6	98.8	0.0	0.008	11236	11081	500m.pg137.cx7
499	11104	658	5.2	1015.7	17.6	0.059	0.482	2.034	36.145	44036	27.7	3.966	100	94.6	100.1	0.0	0.005	11108	10964	500m.pg143.cx7
499	10973	658	5.2	1017.0	17.6	0.060	0.487	2.036	36.168	43501	27.7	3.964	101	94.6	100.1	0.0	0.008	10980	10852	500m.pg15b1.cx7
500	11118	662	5.3	1019.6	17.7	0.060	0.484	2.041	36.195	44057	27.6	3.963	99	94.6	100.1	0.0	0.011	11124	10980	500m.pg15b1p1.cx7
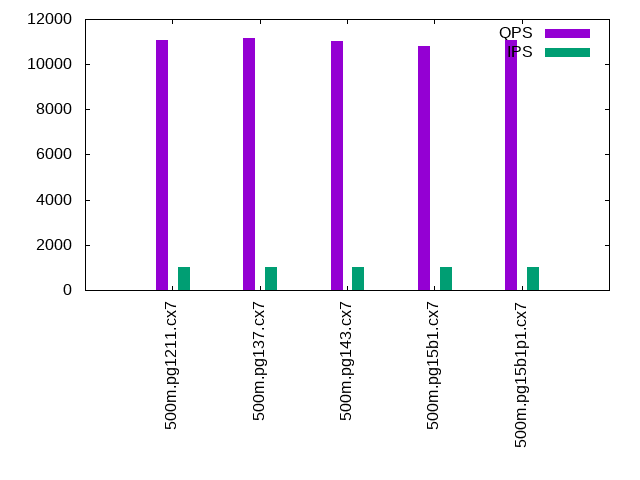
q1000.1
q1000.1: range queries with 1000 insert/s per client. Graphs for performance per 1-second interval are here.
Average throughput:
Query response time histogram: each cell has the percentage of responses that take <= the time in the header and max is the max response time in seconds. For max values in the top 25% of the range have a red background and in the bottom 25% of the range have a green background. The red background is not used when the min value is within 80% of the max value.
| dbms | 256us | 1ms | 4ms | 16ms | 64ms | 256ms | 1s | 4s | 16s | gt | max |
|---|---|---|---|---|---|---|---|---|---|---|---|
| pg1211.cx7 | 99.936 | 0.062 | 0.002 | nonzero | 0.007 | ||||||
| pg137.cx7 | 99.935 | 0.063 | 0.002 | nonzero | nonzero | 0.016 | |||||
| pg143.cx7 | 99.930 | 0.067 | 0.003 | nonzero | 0.010 | ||||||
| pg15b1.cx7 | 99.928 | 0.069 | 0.003 | nonzero | 0.008 | ||||||
| pg15b1p1.cx7 | 99.930 | 0.068 | 0.002 | nonzero | 0.007 |
Insert response time histogram: each cell has the percentage of responses that take <= the time in the header and max is the max response time in seconds. For max values in the top 25% of the range have a red background and in the bottom 25% of the range have a green background. The red background is not used when the min value is within 80% of the max value.
| dbms | 256us | 1ms | 4ms | 16ms | 64ms | 256ms | 1s | 4s | 16s | gt | max |
|---|---|---|---|---|---|---|---|---|---|---|---|
| pg1211.cx7 | 92.145 | 7.839 | 0.016 | 0.085 | |||||||
| pg137.cx7 | 91.624 | 8.343 | 0.033 | 0.152 | |||||||
| pg143.cx7 | 88.764 | 11.219 | 0.017 | 0.082 | |||||||
| pg15b1.cx7 | 87.883 | 12.099 | 0.018 | 0.083 | |||||||
| pg15b1p1.cx7 | 88.816 | 11.170 | 0.014 | 0.090 |
Performance metrics for the DBMS listed above. Some are normalized by throughput, others are not. Legend for results is here.
ips	qps	rps	rmbps	wps	wmbps	rpq	rkbpq	wpi	wkbpi	csps	cpups	cspq	cpupq	dbgb1	dbgb2	rss	maxop	p50	p99	tag
999	11080	1292	10.3	1699.0	32.3	0.117	0.952	1.701	33.132	45413	29.6	4.099	107	95.5	102.8	0.0	0.007	11092	10884	500m.pg1211.cx7
999	11176	1294	10.3	1692.5	32.3	0.116	0.945	1.694	33.056	45782	29.6	4.096	106	95.5	102.8	0.0	0.016	11188	10980	500m.pg137.cx7
999	11016	1294	10.3	1737.1	31.6	0.117	0.962	1.739	32.369	45133	28.7	4.097	104	95.5	104.5	0.0	0.010	11028	10852	500m.pg143.cx7
999	10809	1294	10.3	1739.9	31.6	0.120	0.980	1.741	32.364	44304	28.8	4.099	107	95.5	104.5	0.0	0.008	10820	10660	500m.pg15b1.cx7
999	11050	1295	10.4	1735.3	31.5	0.117	0.959	1.737	32.283	45215	28.7	4.092	104	95.5	104.5	0.0	0.007	11060	10884	500m.pg15b1p1.cx7
l.i0
l.i0: load without secondary indexes
Performance metrics for all DBMS, not just the ones listed above. Some are normalized by throughput, others are not. Legend for results is here.
ips	qps	rps	rmbps	wps	wmbps	rpq	rkbpq	wpi	wkbpi	csps	cpups	cspq	cpupq	dbgb1	dbgb2	rss	maxop	p50	p99	tag
103713	0	45	0.4	197.2	39.9	0.000	0.004	0.002	0.394	12408	42.5	0.120	16	47.8	55.9	0.0	0.190	103827	99494	500m.pg1211.cx7
107689	0	39	0.3	162.2	51.5	0.000	0.003	0.002	0.490	12949	43.7	0.120	16	47.8	63.0	0.0	0.164	108085	101689	500m.pg137.cx7
100080	0	41	0.3	142.4	46.9	0.000	0.003	0.001	0.480	12030	44.1	0.120	18	47.8	63.6	0.0	0.166	100564	94696	500m.pg143.cx7
90612	0	38	0.3	128.3	42.4	0.000	0.003	0.001	0.479	10912	42.4	0.120	19	47.8	63.2	0.0	0.155	90704	86385	500m.pg15b1.cx7
105708	0	40	0.3	144.2	48.5	0.000	0.003	0.001	0.470	12609	44.5	0.119	17	47.8	64.3	0.0	0.191	106085	99794	500m.pg15b1p1.cx7
l.x
l.x: create secondary indexes
Performance metrics for all DBMS, not just the ones listed above. Some are normalized by throughput, others are not. Legend for results is here.
ips	qps	rps	rmbps	wps	wmbps	rpq	rkbpq	wpi	wkbpi	csps	cpups	cspq	cpupq	dbgb1	dbgb2	rss	maxop	p50	p99	tag
223858	0	577	70.0	486.4	105.4	0.003	0.320	0.002	0.482	1028	23.0	0.005	4	91.9	115.5	0.0	0.003	NA	NA	500m.pg1211.cx7
241828	0	592	73.6	196.9	75.9	0.002	0.312	0.001	0.321	526	23.2	0.002	4	91.9	107.0	0.0	0.004	NA	NA	500m.pg137.cx7
241945	0	593	73.6	195.2	75.6	0.002	0.311	0.001	0.320	587	23.2	0.002	4	91.9	108.9	0.0	0.003	NA	NA	500m.pg143.cx7
242179	0	670	82.9	224.3	88.2	0.003	0.351	0.001	0.373	695	23.3	0.003	4	91.9	110.9	0.0	0.003	NA	NA	500m.pg15b1.cx7
240433	0	664	82.4	220.7	87.0	0.003	0.351	0.001	0.371	601	23.1	0.002	4	91.9	109.2	0.0	0.003	NA	NA	500m.pg15b1p1.cx7
l.i1
l.i1: continue load after secondary indexes created
Performance metrics for all DBMS, not just the ones listed above. Some are normalized by throughput, others are not. Legend for results is here.
ips	qps	rps	rmbps	wps	wmbps	rpq	rkbpq	wpi	wkbpi	csps	cpups	cspq	cpupq	dbgb1	dbgb2	rss	maxop	p50	p99	tag
2545	0	3403	27.3	4288.1	68.3	1.337	10.971	1.685	27.498	7891	22.7	3.100	357	93.6	114.1	0.0	0.135	2549	1548	500m.pg1211.cx7
2611	0	3523	28.2	4462.6	71.2	1.349	11.066	1.709	27.910	8233	22.8	3.153	349	93.6	113.1	0.0	0.148	2647	1598	500m.pg137.cx7
2544	0	3422	27.4	4321.8	69.8	1.345	11.032	1.698	28.101	7949	20.9	3.124	329	93.6	120.0	0.0	0.116	2597	1348	500m.pg143.cx7
2541	0	3425	27.4	4335.0	68.3	1.348	11.056	1.706	27.519	7835	20.5	3.083	323	93.6	117.5	0.0	0.210	2597	1248	500m.pg15b1.cx7
2552	0	3438	27.5	4330.0	69.8	1.347	11.049	1.696	27.988	7940	20.7	3.111	324	93.6	120.1	0.0	0.173	2647	1398	500m.pg15b1p1.cx7
q100.1
q100.1: range queries with 100 insert/s per client
Performance metrics for all DBMS, not just the ones listed above. Some are normalized by throughput, others are not. Legend for results is here.
ips	qps	rps	rmbps	wps	wmbps	rpq	rkbpq	wpi	wkbpi	csps	cpups	cspq	cpupq	dbgb1	dbgb2	rss	maxop	p50	p99	tag
100	11005	137	1.1	269.8	4.2	0.012	0.102	2.704	42.929	42591	28.1	3.870	102	93.7	98.0	0.0	0.015	11140	3116	500m.pg1211.cx7
100	11092	139	1.1	288.6	4.4	0.013	0.103	2.892	44.697	42925	28.1	3.870	101	93.7	98.3	0.0	0.075	11335	2445	500m.pg137.cx7
100	11056	139	1.1	333.7	4.8	0.013	0.104	3.344	49.119	42715	26.7	3.863	97	93.7	104.8	0.0	0.103	11239	2879	500m.pg143.cx7
100	10901	139	1.1	311.8	4.6	0.013	0.105	3.124	47.258	42094	26.7	3.861	98	93.7	102.3	0.0	0.061	11044	3468	500m.pg15b1.cx7
100	11099	139	1.1	278.4	4.3	0.013	0.103	2.790	44.270	42840	26.5	3.860	96	93.7	104.5	0.0	0.061	11188	7256	500m.pg15b1p1.cx7
q500.1
q500.1: range queries with 500 insert/s per client
Performance metrics for all DBMS, not just the ones listed above. Some are normalized by throughput, others are not. Legend for results is here.
ips	qps	rps	rmbps	wps	wmbps	rpq	rkbpq	wpi	wkbpi	csps	cpups	cspq	cpupq	dbgb1	dbgb2	rss	maxop	p50	p99	tag
499	11191	657	5.2	1053.9	18.2	0.059	0.476	2.110	37.301	44406	28.7	3.968	103	94.6	98.8	0.0	0.005	11204	11012	500m.pg1211.cx7
500	11230	658	5.2	1054.8	18.2	0.059	0.475	2.112	37.249	44551	28.7	3.967	102	94.6	98.8	0.0	0.008	11236	11081	500m.pg137.cx7
499	11104	658	5.2	1015.7	17.6	0.059	0.482	2.034	36.145	44036	27.7	3.966	100	94.6	100.1	0.0	0.005	11108	10964	500m.pg143.cx7
499	10973	658	5.2	1017.0	17.6	0.060	0.487	2.036	36.168	43501	27.7	3.964	101	94.6	100.1	0.0	0.008	10980	10852	500m.pg15b1.cx7
500	11118	662	5.3	1019.6	17.7	0.060	0.484	2.041	36.195	44057	27.6	3.963	99	94.6	100.1	0.0	0.011	11124	10980	500m.pg15b1p1.cx7
q1000.1
q1000.1: range queries with 1000 insert/s per client
Performance metrics for all DBMS, not just the ones listed above. Some are normalized by throughput, others are not. Legend for results is here.
ips	qps	rps	rmbps	wps	wmbps	rpq	rkbpq	wpi	wkbpi	csps	cpups	cspq	cpupq	dbgb1	dbgb2	rss	maxop	p50	p99	tag
999	11080	1292	10.3	1699.0	32.3	0.117	0.952	1.701	33.132	45413	29.6	4.099	107	95.5	102.8	0.0	0.007	11092	10884	500m.pg1211.cx7
999	11176	1294	10.3	1692.5	32.3	0.116	0.945	1.694	33.056	45782	29.6	4.096	106	95.5	102.8	0.0	0.016	11188	10980	500m.pg137.cx7
999	11016	1294	10.3	1737.1	31.6	0.117	0.962	1.739	32.369	45133	28.7	4.097	104	95.5	104.5	0.0	0.010	11028	10852	500m.pg143.cx7
999	10809	1294	10.3	1739.9	31.6	0.120	0.980	1.741	32.364	44304	28.8	4.099	107	95.5	104.5	0.0	0.008	10820	10660	500m.pg15b1.cx7
999	11050	1295	10.4	1735.3	31.5	0.117	0.959	1.737	32.283	45215	28.7	4.092	104	95.5	104.5	0.0	0.007	11060	10884	500m.pg15b1p1.cx7
l.i0
- l.i0: load without secondary indexes
- Legend for results is here.
- Each entry lists the percentage of responses that fit in that bucket (slower than max time for previous bucket, faster than min time for next bucket).
Insert response time histogram
256us	1ms	4ms	16ms	64ms	256ms	1s	4s	16s	gt	max	tag
0.000	95.179	4.819	0.002	nonzero	nonzero	0.000	0.000	0.000	0.000	0.190	pg1211.cx7
0.000	97.165	2.831	0.003	0.001	nonzero	0.000	0.000	0.000	0.000	0.164	pg137.cx7
0.000	76.414	23.582	0.003	0.001	nonzero	0.000	0.000	0.000	0.000	0.166	pg143.cx7
0.000	0.122	99.876	0.002	nonzero	nonzero	0.000	0.000	0.000	0.000	0.155	pg15b1.cx7
0.000	96.646	3.351	0.002	nonzero	nonzero	0.000	0.000	0.000	0.000	0.191	pg15b1p1.cx7
l.x
- l.x: create secondary indexes
- Legend for results is here.
- Each entry lists the percentage of responses that fit in that bucket (slower than max time for previous bucket, faster than min time for next bucket).
TODO - determine whether there is data for create index response time
l.i1
- l.i1: continue load after secondary indexes created
- Legend for results is here.
- Each entry lists the percentage of responses that fit in that bucket (slower than max time for previous bucket, faster than min time for next bucket).
Insert response time histogram
256us	1ms	4ms	16ms	64ms	256ms	1s	4s	16s	gt	max	tag
0.000	0.000	0.000	32.427	67.526	0.046	0.000	0.000	0.000	0.000	0.135	pg1211.cx7
0.000	0.000	0.000	34.766	65.124	0.111	0.000	0.000	0.000	0.000	0.148	pg137.cx7
0.000	0.000	0.000	32.624	67.284	0.091	0.000	0.000	0.000	0.000	0.116	pg143.cx7
0.000	0.000	0.000	32.864	67.018	0.118	0.000	0.000	0.000	0.000	0.210	pg15b1.cx7
0.000	0.000	0.000	33.149	66.741	0.110	0.000	0.000	0.000	0.000	0.173	pg15b1p1.cx7
q100.1
- q100.1: range queries with 100 insert/s per client
- Legend for results is here.
- Each entry lists the percentage of responses that fit in that bucket (slower than max time for previous bucket, faster than min time for next bucket).
Query response time histogram
256us	1ms	4ms	16ms	64ms	256ms	1s	4s	16s	gt	max	tag
99.720	0.279	0.001	nonzero	0.000	0.000	0.000	0.000	0.000	0.000	0.015	pg1211.cx7
99.565	0.430	0.004	0.002	nonzero	nonzero	0.000	0.000	0.000	0.000	0.075	pg137.cx7
99.701	0.291	0.006	0.001	nonzero	nonzero	0.000	0.000	0.000	0.000	0.103	pg143.cx7
99.770	0.224	0.005	0.001	nonzero	0.000	0.000	0.000	0.000	0.000	0.061	pg15b1.cx7
99.889	0.107	0.004	nonzero	nonzero	0.000	0.000	0.000	0.000	0.000	0.061	pg15b1p1.cx7
Insert response time histogram
256us	1ms	4ms	16ms	64ms	256ms	1s	4s	16s	gt	max	tag
0.000	0.000	0.000	85.257	14.743	0.000	0.000	0.000	0.000	0.000	0.032	pg1211.cx7
0.000	0.000	0.000	84.292	15.708	0.000	0.000	0.000	0.000	0.000	0.059	pg137.cx7
0.000	0.000	0.000	95.778	4.215	0.007	0.000	0.000	0.000	0.000	0.118	pg143.cx7
0.000	0.000	0.000	96.056	3.938	0.000	0.007	0.000	0.000	0.000	0.586	pg15b1.cx7
0.000	0.000	0.000	97.000	2.993	0.007	0.000	0.000	0.000	0.000	0.110	pg15b1p1.cx7
q500.1
- q500.1: range queries with 500 insert/s per client
- Legend for results is here.
- Each entry lists the percentage of responses that fit in that bucket (slower than max time for previous bucket, faster than min time for next bucket).
Query response time histogram
256us	1ms	4ms	16ms	64ms	256ms	1s	4s	16s	gt	max	tag
99.977	0.021	0.001	nonzero	0.000	0.000	0.000	0.000	0.000	0.000	0.005	pg1211.cx7
99.977	0.022	0.001	nonzero	0.000	0.000	0.000	0.000	0.000	0.000	0.008	pg137.cx7
99.974	0.025	0.002	nonzero	0.000	0.000	0.000	0.000	0.000	0.000	0.005	pg143.cx7
99.974	0.024	0.002	nonzero	0.000	0.000	0.000	0.000	0.000	0.000	0.008	pg15b1.cx7
99.974	0.024	0.002	nonzero	0.000	0.000	0.000	0.000	0.000	0.000	0.011	pg15b1p1.cx7
Insert response time histogram
256us	1ms	4ms	16ms	64ms	256ms	1s	4s	16s	gt	max	tag
0.000	0.000	0.000	96.867	3.122	0.011	0.000	0.000	0.000	0.000	0.080	pg1211.cx7
0.000	0.000	0.000	96.539	3.446	0.015	0.000	0.000	0.000	0.000	0.111	pg137.cx7
0.000	0.000	0.000	95.378	4.614	0.008	0.000	0.000	0.000	0.000	0.098	pg143.cx7
0.000	0.000	0.000	95.375	4.618	0.007	0.000	0.000	0.000	0.000	0.079	pg15b1.cx7
0.000	0.000	0.000	96.736	3.264	0.000	0.000	0.000	0.000	0.000	0.061	pg15b1p1.cx7
q1000.1
- q1000.1: range queries with 1000 insert/s per client
- Legend for results is here.
- Each entry lists the percentage of responses that fit in that bucket (slower than max time for previous bucket, faster than min time for next bucket).
Query response time histogram
256us	1ms	4ms	16ms	64ms	256ms	1s	4s	16s	gt	max	tag
99.936	0.062	0.002	nonzero	0.000	0.000	0.000	0.000	0.000	0.000	0.007	pg1211.cx7
99.935	0.063	0.002	nonzero	nonzero	0.000	0.000	0.000	0.000	0.000	0.016	pg137.cx7
99.930	0.067	0.003	nonzero	0.000	0.000	0.000	0.000	0.000	0.000	0.010	pg143.cx7
99.928	0.069	0.003	nonzero	0.000	0.000	0.000	0.000	0.000	0.000	0.008	pg15b1.cx7
99.930	0.068	0.002	nonzero	0.000	0.000	0.000	0.000	0.000	0.000	0.007	pg15b1p1.cx7
Insert response time histogram
256us	1ms	4ms	16ms	64ms	256ms	1s	4s	16s	gt	max	tag
0.000	0.000	0.000	92.145	7.839	0.016	0.000	0.000	0.000	0.000	0.085	pg1211.cx7
0.000	0.000	0.000	91.624	8.343	0.033	0.000	0.000	0.000	0.000	0.152	pg137.cx7
0.000	0.000	0.000	88.764	11.219	0.017	0.000	0.000	0.000	0.000	0.082	pg143.cx7
0.000	0.000	0.000	87.883	12.099	0.018	0.000	0.000	0.000	0.000	0.083	pg15b1.cx7
0.000	0.000	0.000	88.816	11.170	0.014	0.000	0.000	0.000	0.000	0.090	pg15b1p1.cx7