Introduction
This is a report for the insert benchmark with 20M docs and 1 client(s). It is generated by scripts (bash, awk, sed) and Tufte might not be impressed. An overview of the insert benchmark is here and a short update is here. Below, by DBMS, I mean DBMS+version.config. An example is my8020.c10b40 where my means MySQL, 8020 is version 8.0.20 and c10b40 is the name for the configuration file.
The test server is an Intel NUC with 4 cores, 16G RAM and a Samsung 970 EVO. More details are here. Clients and the DBMS share one server. The per-database configs are in the per-database subdirectories here.
The tested DBMS are:
- pg1211.cx7 - Postgres 12.11 and the cx7 config
- pg137.cx7 - Postgres 13.7 and the cx7 config
- pg143.cx7 - Postgres 14.3 and the cx7 config
- pg15b1.cx7 - Postgres 15beta1 and the cx7 config
- pg15b1p1.cx7 - Postgres 15beta1 and the cx7 config with these patches
Contents
- Summary
- l.i0: load without secondary indexes
- l.x: create secondary indexes
- l.i1: continue load after secondary indexes created
- q100.1: range queries with 100 insert/s per client
- q500.1: range queries with 500 insert/s per client
- q1000.1: range queries with 1000 insert/s per client
Summary
The numbers are inserts/s for l.i0 and l.i1, indexed docs (or rows) /s for l.x and queries/s for q*.2. The values are the average rate over the entire test for inserts (IPS) and queries (QPS). The range of values for IPS and QPS is split into 3 parts: bottom 25%, middle 50%, top 25%. Values in the bottom 25% have a red background, values in the top 25% have a green background and values in the middle have no color. A gray background is used for values that can be ignored because the DBMS did not sustain the target insert rate. Red backgrounds are not used when the minimum value is within 80% of the max value.
| dbms | l.i0 | l.x | l.i1 | q100.1 | q500.1 | q1000.1 |
|---|---|---|---|---|---|---|
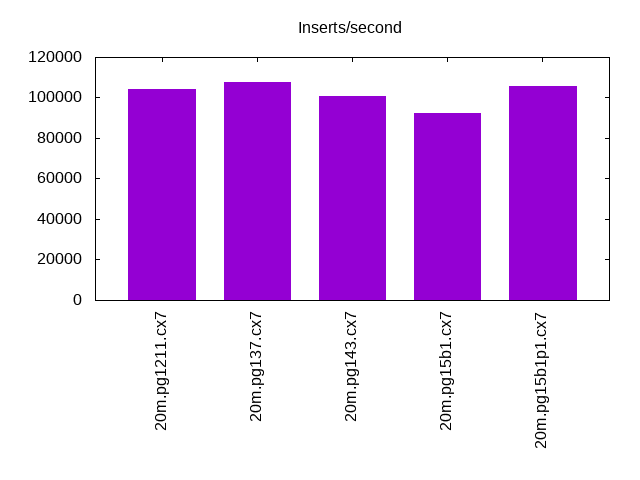
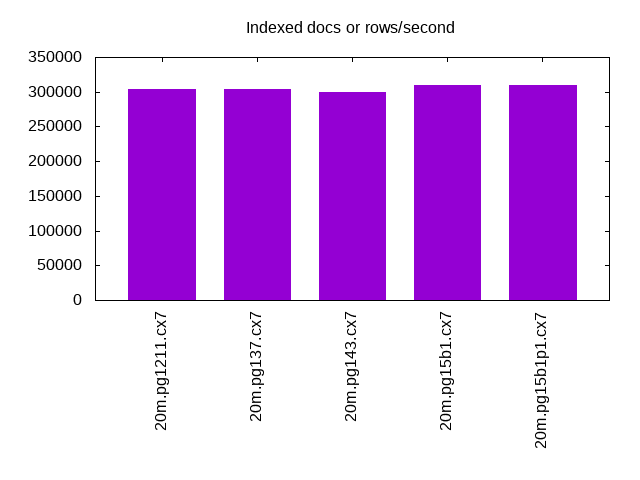
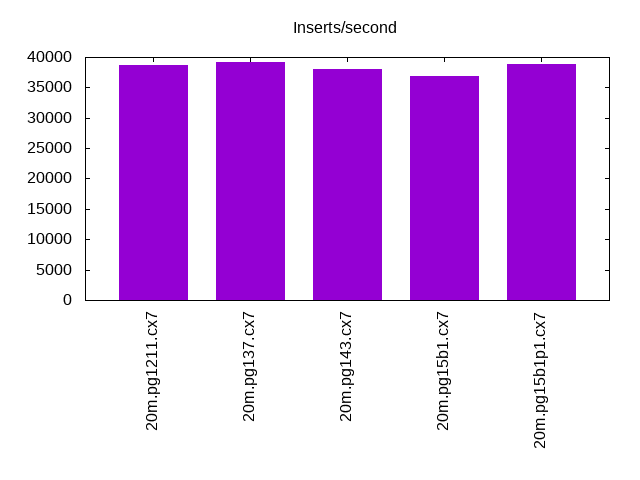
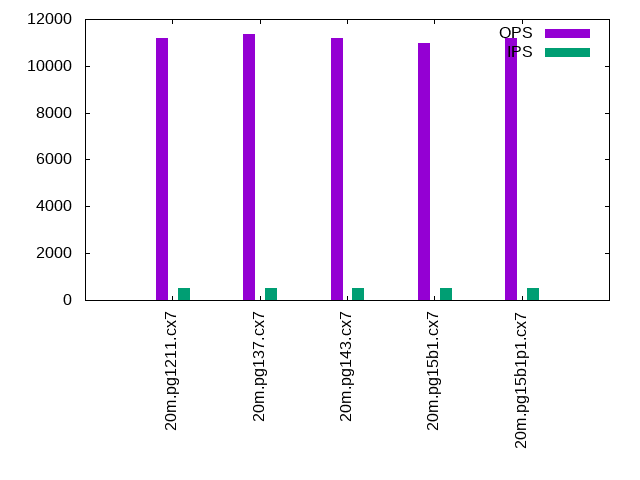
| 20m.pg1211.cx7 | 104167 | 304545 | 38760 | 11285 | 11194 | 11306 |
| 20m.pg137.cx7 | 107527 | 304545 | 39216 | 11411 | 11371 | 11379 |
| 20m.pg143.cx7 | 100502 | 300000 | 37951 | 11328 | 11178 | 11216 |
| 20m.pg15b1.cx7 | 92592 | 309231 | 36832 | 10955 | 10970 | 10839 |
| 20m.pg15b1p1.cx7 | 105820 | 309231 | 38835 | 11213 | 11192 | 11162 |
This lists the average rate of inserts/s for the tests that do inserts concurrent with queries. For such tests the query rate is listed in the table above. The read+write tests are setup so that the insert rate should match the target rate every second. Cells that are not at least 95% of the target have a red background to indicate a failure to satisfy the target.
| dbms | q100.1 | q500.1 | q1000.1 |
|---|---|---|---|
| pg1211.cx7 | 100 | 499 | 999 |
| pg137.cx7 | 100 | 499 | 999 |
| pg143.cx7 | 100 | 500 | 999 |
| pg15b1.cx7 | 100 | 500 | 999 |
| pg15b1p1.cx7 | 100 | 500 | 999 |
| target | 100 | 500 | 1000 |
l.i0
l.i0: load without secondary indexes. Graphs for performance per 1-second interval are here.
Average throughput:
Insert response time histogram: each cell has the percentage of responses that take <= the time in the header and max is the max response time in seconds. For the max column values in the top 25% of the range have a red background and in the bottom 25% of the range have a green background. The red background is not used when the min value is within 80% of the max value.
| dbms | 256us | 1ms | 4ms | 16ms | 64ms | 256ms | 1s | 4s | 16s | gt | max |
|---|---|---|---|---|---|---|---|---|---|---|---|
| pg1211.cx7 | 96.705 | 3.294 | 0.001 | 0.004 | |||||||
| pg137.cx7 | 98.528 | 1.472 | 0.004 | ||||||||
| pg143.cx7 | 77.983 | 22.017 | 0.001 | 0.004 | |||||||
| pg15b1.cx7 | 0.785 | 99.215 | 0.003 | ||||||||
| pg15b1p1.cx7 | 98.209 | 1.791 | 0.001 | 0.005 |
Performance metrics for the DBMS listed above. Some are normalized by throughput, others are not. Legend for results is here.
ips	qps	rps	rmbps	wps	wmbps	rpq	rkbpq	wpi	wkbpi	csps	cpups	cspq	cpupq	dbgb1	dbgb2	rss	maxop	p50	p99	tag
104167	0	0	0.0	66.1	43.2	0.000	0.000	0.001	0.425	12595	43.2	0.121	17	1.9	5.2	0.0	0.004	104328	84984	20m.pg1211.cx7
107527	0	0	0.0	69.2	45.1	0.000	0.000	0.001	0.429	13040	43.8	0.121	16	1.9	5.2	0.0	0.004	108216	86105	20m.pg137.cx7
100502	0	0	0.0	66.1	43.3	0.000	0.000	0.001	0.441	12161	45.0	0.121	18	1.9	5.2	0.0	0.004	100691	79113	20m.pg143.cx7
92592	0	0	0.0	60.7	39.5	0.000	0.000	0.001	0.437	11089	42.6	0.120	18	1.9	5.2	0.0	0.003	92799	73220	20m.pg15b1.cx7
105820	0	0	0.0	67.6	44.2	0.000	0.000	0.001	0.428	12785	44.6	0.121	17	1.9	5.2	0.0	0.005	106184	84510	20m.pg15b1p1.cx7
l.x
l.x: create secondary indexes.
Average throughput:
Performance metrics for the DBMS listed above. Some are normalized by throughput, others are not. Legend for results is here.
ips	qps	rps	rmbps	wps	wmbps	rpq	rkbpq	wpi	wkbpi	csps	cpups	cspq	cpupq	dbgb1	dbgb2	rss	maxop	p50	p99	tag
304545	0	0	0.0	64.9	70.2	0.000	0.000	0.000	0.236	1945	24.7	0.006	3	3.7	8.6	0.0	0.002	NA	NA	20m.pg1211.cx7
304545	0	0	0.0	64.1	65.7	0.000	0.000	0.000	0.221	1963	24.8	0.006	3	3.7	8.6	0.0	0.002	NA	NA	20m.pg137.cx7
300000	0	0	0.0	58.9	62.3	0.000	0.000	0.000	0.212	1907	24.8	0.006	3	3.7	8.6	0.0	0.002	NA	NA	20m.pg143.cx7
309231	0	0	0.0	69.6	73.4	0.000	0.000	0.000	0.243	2014	24.8	0.007	3	3.7	8.6	0.0	0.002	NA	NA	20m.pg15b1.cx7
309231	0	0	0.0	75.2	78.7	0.000	0.000	0.000	0.261	2038	24.6	0.007	3	3.7	8.6	0.0	0.002	NA	NA	20m.pg15b1p1.cx7
l.i1
l.i1: continue load after secondary indexes created. Graphs for performance per 1-second interval are here.
Average throughput:
Insert response time histogram: each cell has the percentage of responses that take <= the time in the header and max is the max response time in seconds. For the max column values in the top 25% of the range have a red background and in the bottom 25% of the range have a green background. The red background is not used when the min value is within 80% of the max value.
| dbms | 256us | 1ms | 4ms | 16ms | 64ms | 256ms | 1s | 4s | 16s | gt | max |
|---|---|---|---|---|---|---|---|---|---|---|---|
| pg1211.cx7 | 99.873 | 0.104 | 0.021 | 0.001 | nonzero | 0.575 | |||||
| pg137.cx7 | 99.861 | 0.116 | 0.023 | 0.001 | 0.168 | ||||||
| pg143.cx7 | 99.869 | 0.110 | 0.020 | 0.001 | nonzero | 0.269 | |||||
| pg15b1.cx7 | 99.883 | 0.094 | 0.022 | nonzero | nonzero | 0.259 | |||||
| pg15b1p1.cx7 | 99.886 | 0.090 | 0.023 | 0.001 | nonzero | 0.423 |
Performance metrics for the DBMS listed above. Some are normalized by throughput, others are not. Legend for results is here.
ips	qps	rps	rmbps	wps	wmbps	rpq	rkbpq	wpi	wkbpi	csps	cpups	cspq	cpupq	dbgb1	dbgb2	rss	maxop	p50	p99	tag
38760	0	0	0.0	198.2	65.9	0.000	0.000	0.005	1.742	9851	35.7	0.254	37	8.2	19.5	1.1	0.575	40156	11486	20m.pg1211.cx7
39216	0	0	0.0	202.3	68.3	0.000	0.000	0.005	1.784	9933	35.8	0.253	37	8.2	19.9	0.0	0.168	40506	9488	20m.pg137.cx7
37951	0	0	0.0	154.8	64.0	0.000	0.000	0.004	1.726	9554	36.1	0.252	38	8.2	20.8	0.0	0.269	39420	16082	20m.pg143.cx7
36832	0	0	0.0	169.7	63.7	0.000	0.000	0.005	1.771	9326	36.1	0.253	39	8.2	21.2	0.0	0.259	38058	16130	20m.pg15b1.cx7
38835	0	0	0.0	150.2	63.3	0.000	0.000	0.004	1.668	9812	36.5	0.253	38	8.2	20.4	0.0	0.423	40257	11138	20m.pg15b1p1.cx7
q100.1
q100.1: range queries with 100 insert/s per client. Graphs for performance per 1-second interval are here.
Average throughput:

Query response time histogram: each cell has the percentage of responses that take <= the time in the header and max is the max response time in seconds. For max values in the top 25% of the range have a red background and in the bottom 25% of the range have a green background. The red background is not used when the min value is within 80% of the max value.
| dbms | 256us | 1ms | 4ms | 16ms | 64ms | 256ms | 1s | 4s | 16s | gt | max |
|---|---|---|---|---|---|---|---|---|---|---|---|
| pg1211.cx7 | 99.997 | 0.002 | 0.001 | nonzero | 0.007 | ||||||
| pg137.cx7 | 99.998 | 0.002 | 0.001 | nonzero | 0.005 | ||||||
| pg143.cx7 | 99.996 | 0.003 | 0.001 | nonzero | 0.007 | ||||||
| pg15b1.cx7 | 99.997 | 0.002 | 0.001 | nonzero | 0.004 | ||||||
| pg15b1p1.cx7 | 99.997 | 0.002 | 0.001 | nonzero | 0.004 |
Insert response time histogram: each cell has the percentage of responses that take <= the time in the header and max is the max response time in seconds. For max values in the top 25% of the range have a red background and in the bottom 25% of the range have a green background. The red background is not used when the min value is within 80% of the max value.
| dbms | 256us | 1ms | 4ms | 16ms | 64ms | 256ms | 1s | 4s | 16s | gt | max |
|---|---|---|---|---|---|---|---|---|---|---|---|
| pg1211.cx7 | 99.993 | 0.007 | 0.005 | ||||||||
| pg137.cx7 | 99.993 | 0.007 | 0.005 | ||||||||
| pg143.cx7 | 99.979 | 0.021 | 0.005 | ||||||||
| pg15b1.cx7 | 99.958 | 0.042 | 0.006 | ||||||||
| pg15b1p1.cx7 | 99.979 | 0.021 | 0.005 |
Performance metrics for the DBMS listed above. Some are normalized by throughput, others are not. Legend for results is here.
ips	qps	rps	rmbps	wps	wmbps	rpq	rkbpq	wpi	wkbpi	csps	cpups	cspq	cpupq	dbgb1	dbgb2	rss	maxop	p50	p99	tag
100	11285	0	0.0	205.6	4.6	0.000	0.000	2.058	47.288	43369	27.9	3.843	99	8.3	10.3	0.0	0.007	11284	11172	20m.pg1211.cx7
100	11411	0	0.0	205.0	4.3	0.000	0.000	2.054	43.949	43863	28.0	3.844	98	8.3	10.2	0.0	0.005	11411	11268	20m.pg137.cx7
100	11328	0	0.0	196.7	4.4	0.000	0.000	1.969	44.644	43479	26.7	3.838	94	8.3	10.8	0.0	0.007	11331	11204	20m.pg143.cx7
100	10955	0	0.0	195.5	4.3	0.000	0.000	1.956	44.560	42026	26.5	3.836	97	8.3	10.8	0.0	0.004	10952	10840	20m.pg15b1.cx7
100	11213	0	0.0	198.8	4.4	0.000	0.000	1.990	44.617	43010	26.6	3.836	95	8.3	10.8	0.0	0.004	11220	11092	20m.pg15b1p1.cx7
q500.1
q500.1: range queries with 500 insert/s per client. Graphs for performance per 1-second interval are here.
Average throughput:
Query response time histogram: each cell has the percentage of responses that take <= the time in the header and max is the max response time in seconds. For max values in the top 25% of the range have a red background and in the bottom 25% of the range have a green background. The red background is not used when the min value is within 80% of the max value.
| dbms | 256us | 1ms | 4ms | 16ms | 64ms | 256ms | 1s | 4s | 16s | gt | max |
|---|---|---|---|---|---|---|---|---|---|---|---|
| pg1211.cx7 | 99.984 | 0.011 | 0.005 | nonzero | 0.006 | ||||||
| pg137.cx7 | 99.984 | 0.011 | 0.005 | nonzero | 0.006 | ||||||
| pg143.cx7 | 99.979 | 0.015 | 0.006 | nonzero | 0.005 | ||||||
| pg15b1.cx7 | 99.980 | 0.014 | 0.006 | nonzero | 0.005 | ||||||
| pg15b1p1.cx7 | 99.981 | 0.014 | 0.005 | nonzero | 0.005 |
Insert response time histogram: each cell has the percentage of responses that take <= the time in the header and max is the max response time in seconds. For max values in the top 25% of the range have a red background and in the bottom 25% of the range have a green background. The red background is not used when the min value is within 80% of the max value.
| dbms | 256us | 1ms | 4ms | 16ms | 64ms | 256ms | 1s | 4s | 16s | gt | max |
|---|---|---|---|---|---|---|---|---|---|---|---|
| pg1211.cx7 | 99.994 | 0.004 | 0.001 | 0.017 | |||||||
| pg137.cx7 | 99.993 | 0.007 | 0.006 | ||||||||
| pg143.cx7 | 99.994 | 0.006 | 0.006 | ||||||||
| pg15b1.cx7 | 99.979 | 0.021 | 0.010 | ||||||||
| pg15b1p1.cx7 | 99.983 | 0.017 | 0.009 |
Performance metrics for the DBMS listed above. Some are normalized by throughput, others are not. Legend for results is here.
ips	qps	rps	rmbps	wps	wmbps	rpq	rkbpq	wpi	wkbpi	csps	cpups	cspq	cpupq	dbgb1	dbgb2	rss	maxop	p50	p99	tag
499	11194	0	0.0	374.2	13.0	0.000	0.000	0.749	26.709	43148	28.5	3.855	102	9.7	12.7	0.0	0.006	11203	11044	20m.pg1211.cx7
499	11371	0	0.0	377.2	13.1	0.000	0.000	0.755	26.786	43819	28.6	3.854	101	9.7	12.7	0.0	0.006	11379	11220	20m.pg137.cx7
500	11178	0	0.0	376.7	12.4	0.000	0.000	0.754	25.402	43026	27.2	3.849	97	9.7	13.3	0.0	0.005	11176	11060	20m.pg143.cx7
500	10970	0	0.0	375.6	12.3	0.000	0.000	0.752	25.311	42203	27.0	3.847	98	9.7	13.3	0.0	0.005	10968	10844	20m.pg15b1.cx7
500	11192	0	0.0	375.7	12.4	0.000	0.000	0.752	25.387	43045	27.0	3.846	96	9.7	13.3	0.0	0.005	11189	11060	20m.pg15b1p1.cx7
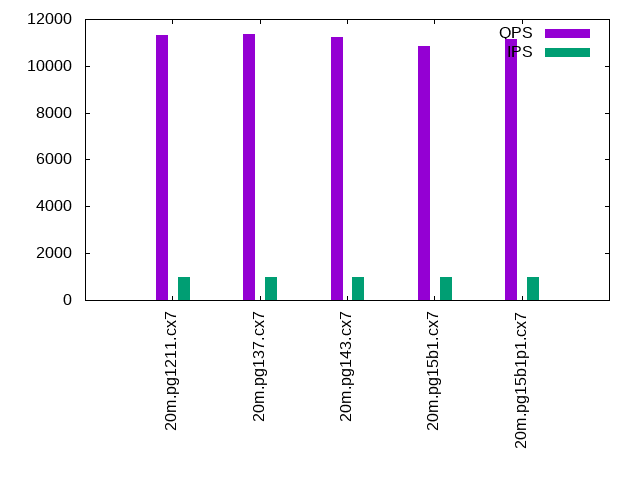
q1000.1
q1000.1: range queries with 1000 insert/s per client. Graphs for performance per 1-second interval are here.
Average throughput:
Query response time histogram: each cell has the percentage of responses that take <= the time in the header and max is the max response time in seconds. For max values in the top 25% of the range have a red background and in the bottom 25% of the range have a green background. The red background is not used when the min value is within 80% of the max value.
| dbms | 256us | 1ms | 4ms | 16ms | 64ms | 256ms | 1s | 4s | 16s | gt | max |
|---|---|---|---|---|---|---|---|---|---|---|---|
| pg1211.cx7 | 99.956 | 0.034 | 0.009 | nonzero | 0.007 | ||||||
| pg137.cx7 | 99.956 | 0.035 | 0.009 | nonzero | 0.008 | ||||||
| pg143.cx7 | 99.952 | 0.038 | 0.010 | nonzero | 0.006 | ||||||
| pg15b1.cx7 | 99.952 | 0.038 | 0.010 | nonzero | 0.009 | ||||||
| pg15b1p1.cx7 | 99.954 | 0.036 | 0.010 | nonzero | 0.006 |
Insert response time histogram: each cell has the percentage of responses that take <= the time in the header and max is the max response time in seconds. For max values in the top 25% of the range have a red background and in the bottom 25% of the range have a green background. The red background is not used when the min value is within 80% of the max value.
| dbms | 256us | 1ms | 4ms | 16ms | 64ms | 256ms | 1s | 4s | 16s | gt | max |
|---|---|---|---|---|---|---|---|---|---|---|---|
| pg1211.cx7 | 98.235 | 1.740 | 0.025 | 0.036 | |||||||
| pg137.cx7 | 98.260 | 1.716 | 0.024 | 0.035 | |||||||
| pg143.cx7 | 98.364 | 1.622 | 0.015 | 0.035 | |||||||
| pg15b1.cx7 | 98.267 | 1.718 | 0.015 | 0.036 | |||||||
| pg15b1p1.cx7 | 98.367 | 1.624 | 0.009 | 0.035 |
Performance metrics for the DBMS listed above. Some are normalized by throughput, others are not. Legend for results is here.
ips	qps	rps	rmbps	wps	wmbps	rpq	rkbpq	wpi	wkbpi	csps	cpups	cspq	cpupq	dbgb1	dbgb2	rss	maxop	p50	p99	tag
999	11306	7	0.1	482.6	18.8	0.001	0.005	0.483	19.279	43701	29.0	3.865	103	12.0	15.8	0.0	0.007	11315	11140	20m.pg1211.cx7
999	11379	6	0.1	481.7	18.8	0.001	0.005	0.482	19.283	43990	29.1	3.866	102	12.0	15.8	0.0	0.008	11380	11191	20m.pg137.cx7
999	11216	6	0.1	512.3	17.5	0.001	0.005	0.513	17.933	43293	27.6	3.860	98	12.0	16.7	0.0	0.006	11220	11060	20m.pg143.cx7
999	10839	8	0.1	510.6	17.5	0.001	0.006	0.511	17.902	41835	27.6	3.860	102	12.0	16.7	0.0	0.009	10837	10708	20m.pg15b1.cx7
999	11162	6	0.1	512.0	17.5	0.001	0.005	0.512	17.936	43056	27.5	3.857	99	12.0	16.7	0.0	0.006	11164	11016	20m.pg15b1p1.cx7
l.i0
l.i0: load without secondary indexes
Performance metrics for all DBMS, not just the ones listed above. Some are normalized by throughput, others are not. Legend for results is here.
ips	qps	rps	rmbps	wps	wmbps	rpq	rkbpq	wpi	wkbpi	csps	cpups	cspq	cpupq	dbgb1	dbgb2	rss	maxop	p50	p99	tag
104167	0	0	0.0	66.1	43.2	0.000	0.000	0.001	0.425	12595	43.2	0.121	17	1.9	5.2	0.0	0.004	104328	84984	20m.pg1211.cx7
107527	0	0	0.0	69.2	45.1	0.000	0.000	0.001	0.429	13040	43.8	0.121	16	1.9	5.2	0.0	0.004	108216	86105	20m.pg137.cx7
100502	0	0	0.0	66.1	43.3	0.000	0.000	0.001	0.441	12161	45.0	0.121	18	1.9	5.2	0.0	0.004	100691	79113	20m.pg143.cx7
92592	0	0	0.0	60.7	39.5	0.000	0.000	0.001	0.437	11089	42.6	0.120	18	1.9	5.2	0.0	0.003	92799	73220	20m.pg15b1.cx7
105820	0	0	0.0	67.6	44.2	0.000	0.000	0.001	0.428	12785	44.6	0.121	17	1.9	5.2	0.0	0.005	106184	84510	20m.pg15b1p1.cx7
l.x
l.x: create secondary indexes
Performance metrics for all DBMS, not just the ones listed above. Some are normalized by throughput, others are not. Legend for results is here.
ips	qps	rps	rmbps	wps	wmbps	rpq	rkbpq	wpi	wkbpi	csps	cpups	cspq	cpupq	dbgb1	dbgb2	rss	maxop	p50	p99	tag
304545	0	0	0.0	64.9	70.2	0.000	0.000	0.000	0.236	1945	24.7	0.006	3	3.7	8.6	0.0	0.002	NA	NA	20m.pg1211.cx7
304545	0	0	0.0	64.1	65.7	0.000	0.000	0.000	0.221	1963	24.8	0.006	3	3.7	8.6	0.0	0.002	NA	NA	20m.pg137.cx7
300000	0	0	0.0	58.9	62.3	0.000	0.000	0.000	0.212	1907	24.8	0.006	3	3.7	8.6	0.0	0.002	NA	NA	20m.pg143.cx7
309231	0	0	0.0	69.6	73.4	0.000	0.000	0.000	0.243	2014	24.8	0.007	3	3.7	8.6	0.0	0.002	NA	NA	20m.pg15b1.cx7
309231	0	0	0.0	75.2	78.7	0.000	0.000	0.000	0.261	2038	24.6	0.007	3	3.7	8.6	0.0	0.002	NA	NA	20m.pg15b1p1.cx7
l.i1
l.i1: continue load after secondary indexes created
Performance metrics for all DBMS, not just the ones listed above. Some are normalized by throughput, others are not. Legend for results is here.
ips	qps	rps	rmbps	wps	wmbps	rpq	rkbpq	wpi	wkbpi	csps	cpups	cspq	cpupq	dbgb1	dbgb2	rss	maxop	p50	p99	tag
38760	0	0	0.0	198.2	65.9	0.000	0.000	0.005	1.742	9851	35.7	0.254	37	8.2	19.5	1.1	0.575	40156	11486	20m.pg1211.cx7
39216	0	0	0.0	202.3	68.3	0.000	0.000	0.005	1.784	9933	35.8	0.253	37	8.2	19.9	0.0	0.168	40506	9488	20m.pg137.cx7
37951	0	0	0.0	154.8	64.0	0.000	0.000	0.004	1.726	9554	36.1	0.252	38	8.2	20.8	0.0	0.269	39420	16082	20m.pg143.cx7
36832	0	0	0.0	169.7	63.7	0.000	0.000	0.005	1.771	9326	36.1	0.253	39	8.2	21.2	0.0	0.259	38058	16130	20m.pg15b1.cx7
38835	0	0	0.0	150.2	63.3	0.000	0.000	0.004	1.668	9812	36.5	0.253	38	8.2	20.4	0.0	0.423	40257	11138	20m.pg15b1p1.cx7
q100.1
q100.1: range queries with 100 insert/s per client
Performance metrics for all DBMS, not just the ones listed above. Some are normalized by throughput, others are not. Legend for results is here.
ips	qps	rps	rmbps	wps	wmbps	rpq	rkbpq	wpi	wkbpi	csps	cpups	cspq	cpupq	dbgb1	dbgb2	rss	maxop	p50	p99	tag
100	11285	0	0.0	205.6	4.6	0.000	0.000	2.058	47.288	43369	27.9	3.843	99	8.3	10.3	0.0	0.007	11284	11172	20m.pg1211.cx7
100	11411	0	0.0	205.0	4.3	0.000	0.000	2.054	43.949	43863	28.0	3.844	98	8.3	10.2	0.0	0.005	11411	11268	20m.pg137.cx7
100	11328	0	0.0	196.7	4.4	0.000	0.000	1.969	44.644	43479	26.7	3.838	94	8.3	10.8	0.0	0.007	11331	11204	20m.pg143.cx7
100	10955	0	0.0	195.5	4.3	0.000	0.000	1.956	44.560	42026	26.5	3.836	97	8.3	10.8	0.0	0.004	10952	10840	20m.pg15b1.cx7
100	11213	0	0.0	198.8	4.4	0.000	0.000	1.990	44.617	43010	26.6	3.836	95	8.3	10.8	0.0	0.004	11220	11092	20m.pg15b1p1.cx7
q500.1
q500.1: range queries with 500 insert/s per client
Performance metrics for all DBMS, not just the ones listed above. Some are normalized by throughput, others are not. Legend for results is here.
ips	qps	rps	rmbps	wps	wmbps	rpq	rkbpq	wpi	wkbpi	csps	cpups	cspq	cpupq	dbgb1	dbgb2	rss	maxop	p50	p99	tag
499	11194	0	0.0	374.2	13.0	0.000	0.000	0.749	26.709	43148	28.5	3.855	102	9.7	12.7	0.0	0.006	11203	11044	20m.pg1211.cx7
499	11371	0	0.0	377.2	13.1	0.000	0.000	0.755	26.786	43819	28.6	3.854	101	9.7	12.7	0.0	0.006	11379	11220	20m.pg137.cx7
500	11178	0	0.0	376.7	12.4	0.000	0.000	0.754	25.402	43026	27.2	3.849	97	9.7	13.3	0.0	0.005	11176	11060	20m.pg143.cx7
500	10970	0	0.0	375.6	12.3	0.000	0.000	0.752	25.311	42203	27.0	3.847	98	9.7	13.3	0.0	0.005	10968	10844	20m.pg15b1.cx7
500	11192	0	0.0	375.7	12.4	0.000	0.000	0.752	25.387	43045	27.0	3.846	96	9.7	13.3	0.0	0.005	11189	11060	20m.pg15b1p1.cx7
q1000.1
q1000.1: range queries with 1000 insert/s per client
Performance metrics for all DBMS, not just the ones listed above. Some are normalized by throughput, others are not. Legend for results is here.
ips	qps	rps	rmbps	wps	wmbps	rpq	rkbpq	wpi	wkbpi	csps	cpups	cspq	cpupq	dbgb1	dbgb2	rss	maxop	p50	p99	tag
999	11306	7	0.1	482.6	18.8	0.001	0.005	0.483	19.279	43701	29.0	3.865	103	12.0	15.8	0.0	0.007	11315	11140	20m.pg1211.cx7
999	11379	6	0.1	481.7	18.8	0.001	0.005	0.482	19.283	43990	29.1	3.866	102	12.0	15.8	0.0	0.008	11380	11191	20m.pg137.cx7
999	11216	6	0.1	512.3	17.5	0.001	0.005	0.513	17.933	43293	27.6	3.860	98	12.0	16.7	0.0	0.006	11220	11060	20m.pg143.cx7
999	10839	8	0.1	510.6	17.5	0.001	0.006	0.511	17.902	41835	27.6	3.860	102	12.0	16.7	0.0	0.009	10837	10708	20m.pg15b1.cx7
999	11162	6	0.1	512.0	17.5	0.001	0.005	0.512	17.936	43056	27.5	3.857	99	12.0	16.7	0.0	0.006	11164	11016	20m.pg15b1p1.cx7
l.i0
- l.i0: load without secondary indexes
- Legend for results is here.
- Each entry lists the percentage of responses that fit in that bucket (slower than max time for previous bucket, faster than min time for next bucket).
Insert response time histogram
256us	1ms	4ms	16ms	64ms	256ms	1s	4s	16s	gt	max	tag
0.000	96.705	3.294	0.001	0.000	0.000	0.000	0.000	0.000	0.000	0.004	pg1211.cx7
0.000	98.528	1.472	0.000	0.000	0.000	0.000	0.000	0.000	0.000	0.004	pg137.cx7
0.000	77.983	22.017	0.001	0.000	0.000	0.000	0.000	0.000	0.000	0.004	pg143.cx7
0.000	0.785	99.215	0.000	0.000	0.000	0.000	0.000	0.000	0.000	0.003	pg15b1.cx7
0.000	98.209	1.791	0.001	0.000	0.000	0.000	0.000	0.000	0.000	0.005	pg15b1p1.cx7
l.x
- l.x: create secondary indexes
- Legend for results is here.
- Each entry lists the percentage of responses that fit in that bucket (slower than max time for previous bucket, faster than min time for next bucket).
TODO - determine whether there is data for create index response time
l.i1
- l.i1: continue load after secondary indexes created
- Legend for results is here.
- Each entry lists the percentage of responses that fit in that bucket (slower than max time for previous bucket, faster than min time for next bucket).
Insert response time histogram
256us	1ms	4ms	16ms	64ms	256ms	1s	4s	16s	gt	max	tag
0.000	0.000	99.873	0.104	0.021	0.001	nonzero	0.000	0.000	0.000	0.575	pg1211.cx7
0.000	0.000	99.861	0.116	0.023	0.001	0.000	0.000	0.000	0.000	0.168	pg137.cx7
0.000	0.000	99.869	0.110	0.020	0.001	nonzero	0.000	0.000	0.000	0.269	pg143.cx7
0.000	0.000	99.883	0.094	0.022	nonzero	nonzero	0.000	0.000	0.000	0.259	pg15b1.cx7
0.000	0.000	99.886	0.090	0.023	0.001	nonzero	0.000	0.000	0.000	0.423	pg15b1p1.cx7
q100.1
- q100.1: range queries with 100 insert/s per client
- Legend for results is here.
- Each entry lists the percentage of responses that fit in that bucket (slower than max time for previous bucket, faster than min time for next bucket).
Query response time histogram
256us	1ms	4ms	16ms	64ms	256ms	1s	4s	16s	gt	max	tag
99.997	0.002	0.001	nonzero	0.000	0.000	0.000	0.000	0.000	0.000	0.007	pg1211.cx7
99.998	0.002	0.001	nonzero	0.000	0.000	0.000	0.000	0.000	0.000	0.005	pg137.cx7
99.996	0.003	0.001	nonzero	0.000	0.000	0.000	0.000	0.000	0.000	0.007	pg143.cx7
99.997	0.002	0.001	nonzero	0.000	0.000	0.000	0.000	0.000	0.000	0.004	pg15b1.cx7
99.997	0.002	0.001	nonzero	0.000	0.000	0.000	0.000	0.000	0.000	0.004	pg15b1p1.cx7
Insert response time histogram
256us	1ms	4ms	16ms	64ms	256ms	1s	4s	16s	gt	max	tag
0.000	0.000	99.993	0.007	0.000	0.000	0.000	0.000	0.000	0.000	0.005	pg1211.cx7
0.000	0.000	99.993	0.007	0.000	0.000	0.000	0.000	0.000	0.000	0.005	pg137.cx7
0.000	0.000	99.979	0.021	0.000	0.000	0.000	0.000	0.000	0.000	0.005	pg143.cx7
0.000	0.000	99.958	0.042	0.000	0.000	0.000	0.000	0.000	0.000	0.006	pg15b1.cx7
0.000	0.000	99.979	0.021	0.000	0.000	0.000	0.000	0.000	0.000	0.005	pg15b1p1.cx7
q500.1
- q500.1: range queries with 500 insert/s per client
- Legend for results is here.
- Each entry lists the percentage of responses that fit in that bucket (slower than max time for previous bucket, faster than min time for next bucket).
Query response time histogram
256us	1ms	4ms	16ms	64ms	256ms	1s	4s	16s	gt	max	tag
99.984	0.011	0.005	nonzero	0.000	0.000	0.000	0.000	0.000	0.000	0.006	pg1211.cx7
99.984	0.011	0.005	nonzero	0.000	0.000	0.000	0.000	0.000	0.000	0.006	pg137.cx7
99.979	0.015	0.006	nonzero	0.000	0.000	0.000	0.000	0.000	0.000	0.005	pg143.cx7
99.980	0.014	0.006	nonzero	0.000	0.000	0.000	0.000	0.000	0.000	0.005	pg15b1.cx7
99.981	0.014	0.005	nonzero	0.000	0.000	0.000	0.000	0.000	0.000	0.005	pg15b1p1.cx7
Insert response time histogram
256us	1ms	4ms	16ms	64ms	256ms	1s	4s	16s	gt	max	tag
0.000	0.000	99.994	0.004	0.001	0.000	0.000	0.000	0.000	0.000	0.017	pg1211.cx7
0.000	0.000	99.993	0.007	0.000	0.000	0.000	0.000	0.000	0.000	0.006	pg137.cx7
0.000	0.000	99.994	0.006	0.000	0.000	0.000	0.000	0.000	0.000	0.006	pg143.cx7
0.000	0.000	99.979	0.021	0.000	0.000	0.000	0.000	0.000	0.000	0.010	pg15b1.cx7
0.000	0.000	99.983	0.017	0.000	0.000	0.000	0.000	0.000	0.000	0.009	pg15b1p1.cx7
q1000.1
- q1000.1: range queries with 1000 insert/s per client
- Legend for results is here.
- Each entry lists the percentage of responses that fit in that bucket (slower than max time for previous bucket, faster than min time for next bucket).
Query response time histogram
256us	1ms	4ms	16ms	64ms	256ms	1s	4s	16s	gt	max	tag
99.956	0.034	0.009	nonzero	0.000	0.000	0.000	0.000	0.000	0.000	0.007	pg1211.cx7
99.956	0.035	0.009	nonzero	0.000	0.000	0.000	0.000	0.000	0.000	0.008	pg137.cx7
99.952	0.038	0.010	nonzero	0.000	0.000	0.000	0.000	0.000	0.000	0.006	pg143.cx7
99.952	0.038	0.010	nonzero	0.000	0.000	0.000	0.000	0.000	0.000	0.009	pg15b1.cx7
99.954	0.036	0.010	nonzero	0.000	0.000	0.000	0.000	0.000	0.000	0.006	pg15b1p1.cx7
Insert response time histogram
256us	1ms	4ms	16ms	64ms	256ms	1s	4s	16s	gt	max	tag
0.000	0.000	98.235	1.740	0.025	0.000	0.000	0.000	0.000	0.000	0.036	pg1211.cx7
0.000	0.000	98.260	1.716	0.024	0.000	0.000	0.000	0.000	0.000	0.035	pg137.cx7
0.000	0.000	98.364	1.622	0.015	0.000	0.000	0.000	0.000	0.000	0.035	pg143.cx7
0.000	0.000	98.267	1.718	0.015	0.000	0.000	0.000	0.000	0.000	0.036	pg15b1.cx7
0.000	0.000	98.367	1.624	0.009	0.000	0.000	0.000	0.000	0.000	0.035	pg15b1p1.cx7