Introduction
This is a report for the insert benchmark with 500M docs and 1 client(s). It is generated by scripts (bash, awk, sed) and Tufte might not be impressed. An overview of the insert benchmark is here and a short update is here. Below, by DBMS, I mean DBMS+version.config. An example is my8020.c10b40 where my means MySQL, 8020 is version 8.0.20 and c10b40 is the name for the configuration file.
The test server is an Intel NUC with 4 cores, 16G RAM and a Samsung 970 EVO. More details are here. Clients and the DBMS share one server. The per-database configs are in the per-database subdirectories here.
The tested DBMS are:
- pg1211.cx5 - Postgres 12.11 and the cx5 config
- pg137.cx5 - Postgres 13.7 and the cx5 config
- pg143.cx5 - Postgres 14.3 and the cx5 config
- pg15b1.cx5 - Postgres 15beta1 and the cx5 config
- pg15b1p1.cx5 - Postgres 15beta1 and the cx5 config with these patches
- pg15b1p1r2.cx5 - Same as pg15b1p1.cx5, just repeated the test
Contents
- Summary
- l.i0: load without secondary indexes
- l.x: create secondary indexes
- l.i1: continue load after secondary indexes created
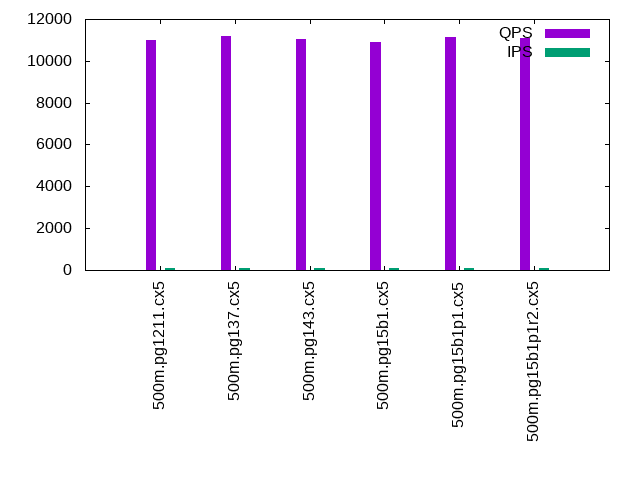
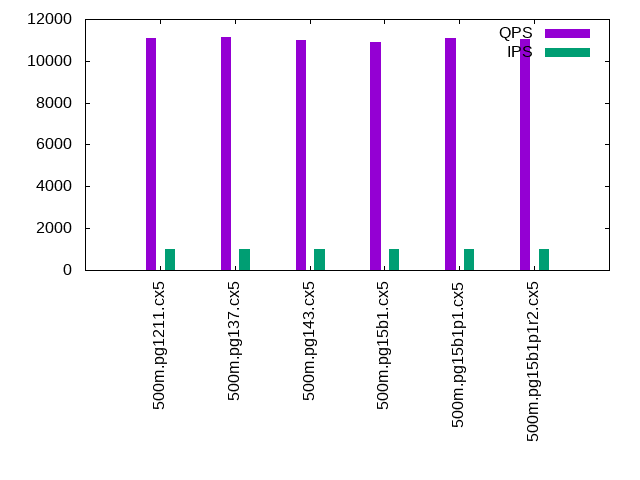
- q100.1: range queries with 100 insert/s per client
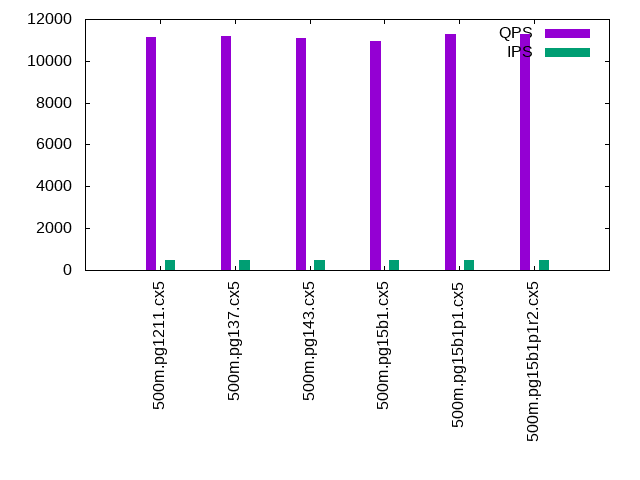
- q500.1: range queries with 500 insert/s per client
- q1000.1: range queries with 1000 insert/s per client
Summary
The numbers are inserts/s for l.i0 and l.i1, indexed docs (or rows) /s for l.x and queries/s for q*.2. The values are the average rate over the entire test for inserts (IPS) and queries (QPS). The range of values for IPS and QPS is split into 3 parts: bottom 25%, middle 50%, top 25%. Values in the bottom 25% have a red background, values in the top 25% have a green background and values in the middle have no color. A gray background is used for values that can be ignored because the DBMS did not sustain the target insert rate. Red backgrounds are not used when the minimum value is within 80% of the max value.
| dbms | l.i0 | l.x | l.i1 | q100.1 | q500.1 | q1000.1 |
|---|---|---|---|---|---|---|
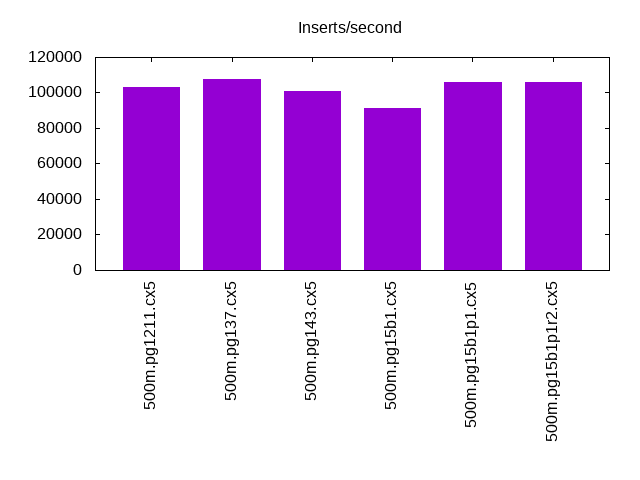
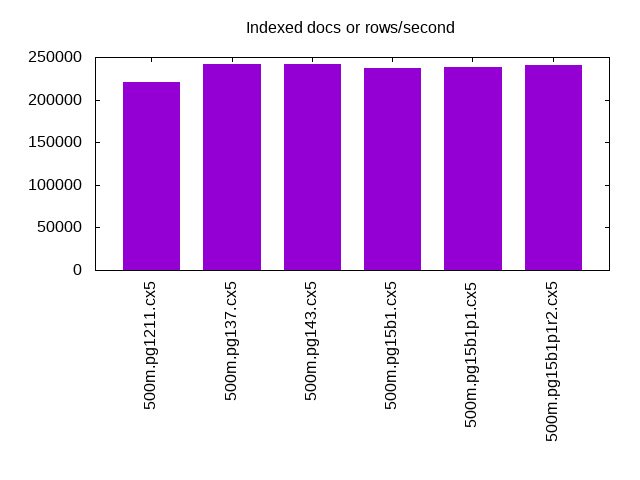
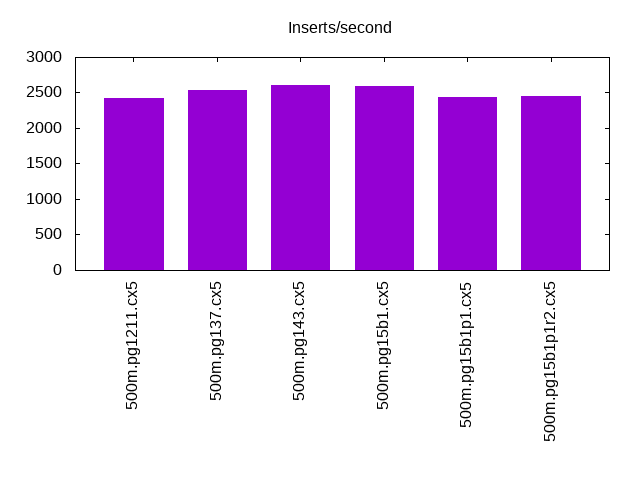
| 500m.pg1211.cx5 | 103199 | 220697 | 2419 | 11007 | 11127 | 11072 |
| 500m.pg137.cx5 | 107619 | 242062 | 2541 | 11188 | 11190 | 11135 |
| 500m.pg143.cx5 | 100867 | 241244 | 2601 | 11059 | 11074 | 10986 |
| 500m.pg15b1.cx5 | 91025 | 236678 | 2586 | 10888 | 10945 | 10911 |
| 500m.pg15b1p1.cx5 | 106090 | 238711 | 2443 | 11138 | 11276 | 11072 |
| 500m.pg15b1p1r2.cx5 | 106157 | 240896 | 2444 | 11115 | 11301 | 11044 |
This lists the average rate of inserts/s for the tests that do inserts concurrent with queries. For such tests the query rate is listed in the table above. The read+write tests are setup so that the insert rate should match the target rate every second. Cells that are not at least 95% of the target have a red background to indicate a failure to satisfy the target.
| dbms | q100.1 | q500.1 | q1000.1 |
|---|---|---|---|
| pg1211.cx5 | 100 | 499 | 999 |
| pg137.cx5 | 100 | 499 | 999 |
| pg143.cx5 | 100 | 500 | 999 |
| pg15b1.cx5 | 100 | 500 | 999 |
| pg15b1p1.cx5 | 100 | 500 | 999 |
| pg15b1p1r2.cx5 | 100 | 500 | 999 |
| target | 100 | 500 | 1000 |
l.i0
l.i0: load without secondary indexes. Graphs for performance per 1-second interval are here.
Average throughput:
Insert response time histogram: each cell has the percentage of responses that take <= the time in the header and max is the max response time in seconds. For the max column values in the top 25% of the range have a red background and in the bottom 25% of the range have a green background. The red background is not used when the min value is within 80% of the max value.
| dbms | 256us | 1ms | 4ms | 16ms | 64ms | 256ms | 1s | 4s | 16s | gt | max |
|---|---|---|---|---|---|---|---|---|---|---|---|
| pg1211.cx5 | 93.778 | 6.218 | 0.003 | 0.001 | nonzero | 0.161 | |||||
| pg137.cx5 | 97.090 | 2.902 | 0.007 | nonzero | nonzero | 0.182 | |||||
| pg143.cx5 | 82.939 | 17.055 | 0.005 | 0.001 | nonzero | 0.236 | |||||
| pg15b1.cx5 | 0.191 | 99.804 | 0.004 | 0.001 | nonzero | 0.159 | |||||
| pg15b1p1.cx5 | 96.815 | 3.178 | 0.006 | nonzero | nonzero | 0.230 | |||||
| pg15b1p1r2.cx5 | 96.776 | 3.220 | 0.004 | nonzero | nonzero | 0.198 |
Performance metrics for the DBMS listed above. Some are normalized by throughput, others are not. Legend for results is here.
ips	qps	rps	rmbps	wps	wmbps	rpq	rkbpq	wpi	wkbpi	csps	cpups	cspq	cpupq	dbgb1	dbgb2	rss	maxop	p50	p99	tag
103199	0	44	0.4	197.1	39.7	0.000	0.003	0.002	0.394	12310	42.4	0.119	16	47.8	55.8	0.0	0.161	103322	98792	500m.pg1211.cx5
107619	0	38	0.3	162.5	51.5	0.000	0.003	0.002	0.490	12936	43.7	0.120	16	47.8	63.0	0.0	0.182	108182	99790	500m.pg137.cx5
100867	0	41	0.3	144.2	47.2	0.000	0.003	0.001	0.479	12112	43.4	0.120	17	47.8	63.0	0.0	0.236	101221	96610	500m.pg143.cx5
91025	0	37	0.3	130.9	43.0	0.000	0.003	0.001	0.483	10963	42.5	0.120	19	47.8	63.7	0.0	0.159	91201	87871	500m.pg15b1.cx5
106090	0	42	0.4	144.3	48.1	0.000	0.004	0.001	0.464	12664	44.5	0.119	17	47.8	63.1	0.6	0.230	106583	101292	500m.pg15b1p1.cx5
106157	0	41	0.4	143.0	48.1	0.000	0.004	0.001	0.464	12669	44.3	0.119	17	47.8	63.0	0.5	0.198	106487	101389	500m.pg15b1p1r2.cx5
l.x
l.x: create secondary indexes.
Average throughput:
Performance metrics for the DBMS listed above. Some are normalized by throughput, others are not. Legend for results is here.
ips	qps	rps	rmbps	wps	wmbps	rpq	rkbpq	wpi	wkbpi	csps	cpups	cspq	cpupq	dbgb1	dbgb2	rss	maxop	p50	p99	tag
220697	0	568	69.0	472.2	102.1	0.003	0.320	0.002	0.474	926	22.7	0.004	4	91.9	111.5	0.0	0.003	NA	NA	500m.pg1211.cx5
242062	0	592	73.6	195.9	76.1	0.002	0.311	0.001	0.322	537	23.2	0.002	4	91.9	107.0	0.0	0.003	NA	NA	500m.pg137.cx5
241244	0	591	73.2	194.0	75.4	0.002	0.311	0.001	0.320	533	23.1	0.002	4	91.9	108.3	0.0	0.003	NA	NA	500m.pg143.cx5
236678	0	653	81.1	213.0	84.2	0.003	0.351	0.001	0.364	582	22.9	0.002	4	91.9	107.8	0.0	0.003	NA	NA	500m.pg15b1.cx5
238711	0	658	81.7	219.2	86.4	0.003	0.350	0.001	0.370	585	23.3	0.002	4	91.9	107.3	0.0	0.092	NA	NA	500m.pg15b1p1.cx5
240896	0	664	82.4	220.9	87.5	0.003	0.350	0.001	0.372	609	23.2	0.003	4	91.9	107.5	0.0	0.003	NA	NA	500m.pg15b1p1r2.cx5
l.i1
l.i1: continue load after secondary indexes created. Graphs for performance per 1-second interval are here.
Average throughput:
Insert response time histogram: each cell has the percentage of responses that take <= the time in the header and max is the max response time in seconds. For the max column values in the top 25% of the range have a red background and in the bottom 25% of the range have a green background. The red background is not used when the min value is within 80% of the max value.
| dbms | 256us | 1ms | 4ms | 16ms | 64ms | 256ms | 1s | 4s | 16s | gt | max |
|---|---|---|---|---|---|---|---|---|---|---|---|
| pg1211.cx5 | 26.919 | 73.059 | 0.023 | 0.150 | |||||||
| pg137.cx5 | 32.599 | 67.334 | 0.067 | 0.148 | |||||||
| pg143.cx5 | 34.360 | 65.534 | 0.106 | 0.249 | |||||||
| pg15b1.cx5 | 35.285 | 64.651 | 0.064 | 0.122 | |||||||
| pg15b1p1.cx5 | 29.471 | 70.407 | 0.107 | 0.014 | 0.588 | ||||||
| pg15b1p1r2.cx5 | 29.325 | 70.573 | 0.087 | 0.015 | 0.659 |
Performance metrics for the DBMS listed above. Some are normalized by throughput, others are not. Legend for results is here.
ips	qps	rps	rmbps	wps	wmbps	rpq	rkbpq	wpi	wkbpi	csps	cpups	cspq	cpupq	dbgb1	dbgb2	rss	maxop	p50	p99	tag
2419	0	3234	25.9	4107.0	65.3	1.337	10.959	1.698	27.627	7498	22.2	3.100	367	93.6	110.6	0.0	0.150	2447	1548	500m.pg1211.cx5
2541	0	3427	27.4	4312.6	68.5	1.349	11.056	1.697	27.622	7974	22.5	3.138	354	93.6	111.0	0.0	0.148	2547	1448	500m.pg137.cx5
2601	0	3496	28.0	4382.9	68.8	1.344	11.022	1.685	27.085	8019	21.0	3.083	323	93.6	113.2	0.0	0.249	2647	1298	500m.pg143.cx5
2586	0	3489	27.9	4373.3	68.6	1.349	11.067	1.691	27.178	7942	20.5	3.071	317	93.6	112.7	0.0	0.122	2647	1348	500m.pg15b1.cx5
2443	0	3309	28.3	4143.9	69.7	1.355	11.859	1.696	29.220	7603	21.6	3.112	354	93.6	113.7	0.0	0.588	2497	1149	500m.pg15b1p1.cx5
2444	0	3312	28.3	4138.7	69.7	1.355	11.871	1.694	29.197	7608	21.7	3.113	355	93.6	113.7	0.0	0.659	2497	1149	500m.pg15b1p1r2.cx5
q100.1
q100.1: range queries with 100 insert/s per client. Graphs for performance per 1-second interval are here.
Average throughput:
Query response time histogram: each cell has the percentage of responses that take <= the time in the header and max is the max response time in seconds. For max values in the top 25% of the range have a red background and in the bottom 25% of the range have a green background. The red background is not used when the min value is within 80% of the max value.
| dbms | 256us | 1ms | 4ms | 16ms | 64ms | 256ms | 1s | 4s | 16s | gt | max |
|---|---|---|---|---|---|---|---|---|---|---|---|
| pg1211.cx5 | 99.762 | 0.238 | 0.001 | nonzero | 0.015 | ||||||
| pg137.cx5 | 99.768 | 0.230 | 0.002 | nonzero | nonzero | 0.052 | |||||
| pg143.cx5 | 99.820 | 0.177 | 0.003 | nonzero | nonzero | 0.046 | |||||
| pg15b1.cx5 | 99.807 | 0.186 | 0.005 | 0.001 | nonzero | 0.051 | |||||
| pg15b1p1.cx5 | 99.783 | 0.211 | 0.005 | 0.001 | nonzero | 0.045 | |||||
| pg15b1p1r2.cx5 | 99.728 | 0.265 | 0.006 | 0.001 | nonzero | nonzero | 0.080 |
Insert response time histogram: each cell has the percentage of responses that take <= the time in the header and max is the max response time in seconds. For max values in the top 25% of the range have a red background and in the bottom 25% of the range have a green background. The red background is not used when the min value is within 80% of the max value.
| dbms | 256us | 1ms | 4ms | 16ms | 64ms | 256ms | 1s | 4s | 16s | gt | max |
|---|---|---|---|---|---|---|---|---|---|---|---|
| pg1211.cx5 | 85.007 | 14.993 | 0.027 | ||||||||
| pg137.cx5 | 85.292 | 14.708 | 0.037 | ||||||||
| pg143.cx5 | 96.708 | 3.292 | 0.042 | ||||||||
| pg15b1.cx5 | 96.333 | 3.667 | 0.058 | ||||||||
| pg15b1p1.cx5 | 96.257 | 3.743 | 0.062 | ||||||||
| pg15b1p1r2.cx5 | 95.986 | 4.014 | 0.054 |
Performance metrics for the DBMS listed above. Some are normalized by throughput, others are not. Legend for results is here.
ips	qps	rps	rmbps	wps	wmbps	rpq	rkbpq	wpi	wkbpi	csps	cpups	cspq	cpupq	dbgb1	dbgb2	rss	maxop	p50	p99	tag
100	11007	137	1.1	273.3	4.2	0.012	0.102	2.739	43.307	42594	28.1	3.870	102	93.7	96.0	0.0	0.015	11124	3324	500m.pg1211.cx5
100	11188	139	1.1	273.8	4.2	0.012	0.103	2.744	43.382	43289	28.2	3.869	101	93.7	96.2	0.0	0.052	11315	3279	500m.pg137.cx5
100	11059	139	1.1	325.4	4.7	0.013	0.104	3.257	48.257	42722	26.7	3.863	97	93.7	99.6	0.0	0.046	11172	4907	500m.pg143.cx5
100	10888	139	1.1	300.4	4.5	0.013	0.105	3.007	46.125	42036	26.6	3.861	98	93.7	99.6	0.0	0.051	11012	4043	500m.pg15b1.cx5
100	11138	140	1.1	341.4	4.8	0.013	0.103	3.417	49.621	42991	26.6	3.860	96	93.7	99.9	0.0	0.045	11283	3980	500m.pg15b1p1.cx5
100	11115	140	1.1	344.8	4.9	0.013	0.104	3.451	50.079	42906	26.7	3.860	96	93.7	100.6	0.0	0.080	11284	3102	500m.pg15b1p1r2.cx5
q500.1
q500.1: range queries with 500 insert/s per client. Graphs for performance per 1-second interval are here.
Average throughput:
Query response time histogram: each cell has the percentage of responses that take <= the time in the header and max is the max response time in seconds. For max values in the top 25% of the range have a red background and in the bottom 25% of the range have a green background. The red background is not used when the min value is within 80% of the max value.
| dbms | 256us | 1ms | 4ms | 16ms | 64ms | 256ms | 1s | 4s | 16s | gt | max |
|---|---|---|---|---|---|---|---|---|---|---|---|
| pg1211.cx5 | 99.978 | 0.021 | 0.001 | nonzero | 0.008 | ||||||
| pg137.cx5 | 99.978 | 0.021 | 0.001 | nonzero | 0.008 | ||||||
| pg143.cx5 | 99.974 | 0.024 | 0.001 | nonzero | 0.006 | ||||||
| pg15b1.cx5 | 99.975 | 0.024 | 0.001 | nonzero | 0.006 | ||||||
| pg15b1p1.cx5 | 99.976 | 0.022 | 0.001 | nonzero | 0.016 | ||||||
| pg15b1p1r2.cx5 | 99.976 | 0.023 | 0.001 | nonzero | 0.005 |
Insert response time histogram: each cell has the percentage of responses that take <= the time in the header and max is the max response time in seconds. For max values in the top 25% of the range have a red background and in the bottom 25% of the range have a green background. The red background is not used when the min value is within 80% of the max value.
| dbms | 256us | 1ms | 4ms | 16ms | 64ms | 256ms | 1s | 4s | 16s | gt | max |
|---|---|---|---|---|---|---|---|---|---|---|---|
| pg1211.cx5 | 96.850 | 3.150 | 0.063 | ||||||||
| pg137.cx5 | 96.946 | 3.053 | 0.001 | 0.069 | |||||||
| pg143.cx5 | 97.235 | 2.764 | 0.001 | 0.068 | |||||||
| pg15b1.cx5 | 96.426 | 3.569 | 0.004 | 0.080 | |||||||
| pg15b1p1.cx5 | 95.683 | 4.311 | 0.006 | 0.081 | |||||||
| pg15b1p1r2.cx5 | 95.521 | 4.475 | 0.004 | 0.069 |
Performance metrics for the DBMS listed above. Some are normalized by throughput, others are not. Legend for results is here.
ips	qps	rps	rmbps	wps	wmbps	rpq	rkbpq	wpi	wkbpi	csps	cpups	cspq	cpupq	dbgb1	dbgb2	rss	maxop	p50	p99	tag
499	11127	657	5.2	1063.1	18.5	0.059	0.479	2.129	38.034	44177	28.7	3.970	103	94.6	98.8	0.0	0.008	11133	10980	500m.pg1211.cx5
499	11190	658	5.2	1064.7	18.5	0.059	0.477	2.132	37.931	44415	28.8	3.969	103	94.6	98.7	0.0	0.008	11193	11028	500m.pg137.cx5
500	11074	658	5.2	1018.8	17.7	0.059	0.483	2.040	36.347	43909	27.7	3.965	100	94.6	99.7	0.0	0.006	11076	10932	500m.pg143.cx5
500	10945	658	5.2	1019.7	17.9	0.060	0.489	2.042	36.612	43392	27.7	3.965	101	94.6	99.7	0.0	0.006	10948	10820	500m.pg15b1.cx5
500	11276	658	5.2	1015.5	17.6	0.058	0.475	2.033	36.129	44649	27.7	3.960	98	94.6	100.1	0.0	0.016	11284	11140	500m.pg15b1p1.cx5
500	11301	658	5.2	1018.2	17.7	0.058	0.473	2.038	36.186	44742	27.7	3.959	98	94.6	100.0	0.0	0.005	11300	11160	500m.pg15b1p1r2.cx5
q1000.1
q1000.1: range queries with 1000 insert/s per client. Graphs for performance per 1-second interval are here.
Average throughput:
Query response time histogram: each cell has the percentage of responses that take <= the time in the header and max is the max response time in seconds. For max values in the top 25% of the range have a red background and in the bottom 25% of the range have a green background. The red background is not used when the min value is within 80% of the max value.
| dbms | 256us | 1ms | 4ms | 16ms | 64ms | 256ms | 1s | 4s | 16s | gt | max |
|---|---|---|---|---|---|---|---|---|---|---|---|
| pg1211.cx5 | 99.936 | 0.062 | 0.001 | 0.001 | 0.014 | ||||||
| pg137.cx5 | 99.937 | 0.061 | 0.001 | 0.001 | 0.014 | ||||||
| pg143.cx5 | 99.929 | 0.069 | 0.002 | 0.001 | 0.007 | ||||||
| pg15b1.cx5 | 99.929 | 0.069 | 0.002 | 0.001 | 0.008 | ||||||
| pg15b1p1.cx5 | 99.932 | 0.066 | 0.002 | 0.001 | 0.007 | ||||||
| pg15b1p1r2.cx5 | 99.928 | 0.070 | 0.002 | 0.001 | 0.007 |
Insert response time histogram: each cell has the percentage of responses that take <= the time in the header and max is the max response time in seconds. For max values in the top 25% of the range have a red background and in the bottom 25% of the range have a green background. The red background is not used when the min value is within 80% of the max value.
| dbms | 256us | 1ms | 4ms | 16ms | 64ms | 256ms | 1s | 4s | 16s | gt | max |
|---|---|---|---|---|---|---|---|---|---|---|---|
| pg1211.cx5 | 92.923 | 7.070 | 0.007 | 0.075 | |||||||
| pg137.cx5 | 92.585 | 7.401 | 0.015 | 0.095 | |||||||
| pg143.cx5 | 92.343 | 7.646 | 0.011 | 0.107 | |||||||
| pg15b1.cx5 | 88.433 | 11.551 | 0.017 | 0.089 | |||||||
| pg15b1p1.cx5 | 89.035 | 10.949 | 0.017 | 0.084 | |||||||
| pg15b1p1r2.cx5 | 88.795 | 11.187 | 0.018 | 0.089 |
Performance metrics for the DBMS listed above. Some are normalized by throughput, others are not. Legend for results is here.
ips	qps	rps	rmbps	wps	wmbps	rpq	rkbpq	wpi	wkbpi	csps	cpups	cspq	cpupq	dbgb1	dbgb2	rss	maxop	p50	p99	tag
999	11072	1291	10.3	1696.4	32.3	0.117	0.952	1.698	33.103	45364	29.6	4.097	107	95.5	102.8	0.0	0.014	11076	10900	500m.pg1211.cx5
999	11135	1294	10.3	1697.4	32.3	0.116	0.948	1.699	33.104	45624	29.7	4.097	107	95.5	102.8	0.0	0.014	11140	10932	500m.pg137.cx5
999	10986	1293	10.3	1743.1	31.6	0.118	0.963	1.745	32.426	45001	28.7	4.096	104	95.5	104.5	0.0	0.007	10996	10836	500m.pg143.cx5
999	10911	1298	10.4	1741.3	31.6	0.119	0.974	1.743	32.362	44688	28.8	4.096	106	95.5	104.5	0.0	0.008	10916	10743	500m.pg15b1.cx5
999	11072	1294	10.3	1732.2	31.5	0.117	0.957	1.734	32.297	45301	28.9	4.092	104	95.5	104.5	0.0	0.007	11076	10903	500m.pg15b1p1.cx5
999	11044	1294	10.3	1733.0	31.5	0.117	0.959	1.735	32.305	45206	28.8	4.093	104	95.5	104.5	0.0	0.007	11060	10884	500m.pg15b1p1r2.cx5
l.i0
l.i0: load without secondary indexes
Performance metrics for all DBMS, not just the ones listed above. Some are normalized by throughput, others are not. Legend for results is here.
ips	qps	rps	rmbps	wps	wmbps	rpq	rkbpq	wpi	wkbpi	csps	cpups	cspq	cpupq	dbgb1	dbgb2	rss	maxop	p50	p99	tag
103199	0	44	0.4	197.1	39.7	0.000	0.003	0.002	0.394	12310	42.4	0.119	16	47.8	55.8	0.0	0.161	103322	98792	500m.pg1211.cx5
107619	0	38	0.3	162.5	51.5	0.000	0.003	0.002	0.490	12936	43.7	0.120	16	47.8	63.0	0.0	0.182	108182	99790	500m.pg137.cx5
100867	0	41	0.3	144.2	47.2	0.000	0.003	0.001	0.479	12112	43.4	0.120	17	47.8	63.0	0.0	0.236	101221	96610	500m.pg143.cx5
91025	0	37	0.3	130.9	43.0	0.000	0.003	0.001	0.483	10963	42.5	0.120	19	47.8	63.7	0.0	0.159	91201	87871	500m.pg15b1.cx5
106090	0	42	0.4	144.3	48.1	0.000	0.004	0.001	0.464	12664	44.5	0.119	17	47.8	63.1	0.6	0.230	106583	101292	500m.pg15b1p1.cx5
106157	0	41	0.4	143.0	48.1	0.000	0.004	0.001	0.464	12669	44.3	0.119	17	47.8	63.0	0.5	0.198	106487	101389	500m.pg15b1p1r2.cx5
l.x
l.x: create secondary indexes
Performance metrics for all DBMS, not just the ones listed above. Some are normalized by throughput, others are not. Legend for results is here.
ips	qps	rps	rmbps	wps	wmbps	rpq	rkbpq	wpi	wkbpi	csps	cpups	cspq	cpupq	dbgb1	dbgb2	rss	maxop	p50	p99	tag
220697	0	568	69.0	472.2	102.1	0.003	0.320	0.002	0.474	926	22.7	0.004	4	91.9	111.5	0.0	0.003	NA	NA	500m.pg1211.cx5
242062	0	592	73.6	195.9	76.1	0.002	0.311	0.001	0.322	537	23.2	0.002	4	91.9	107.0	0.0	0.003	NA	NA	500m.pg137.cx5
241244	0	591	73.2	194.0	75.4	0.002	0.311	0.001	0.320	533	23.1	0.002	4	91.9	108.3	0.0	0.003	NA	NA	500m.pg143.cx5
236678	0	653	81.1	213.0	84.2	0.003	0.351	0.001	0.364	582	22.9	0.002	4	91.9	107.8	0.0	0.003	NA	NA	500m.pg15b1.cx5
238711	0	658	81.7	219.2	86.4	0.003	0.350	0.001	0.370	585	23.3	0.002	4	91.9	107.3	0.0	0.092	NA	NA	500m.pg15b1p1.cx5
240896	0	664	82.4	220.9	87.5	0.003	0.350	0.001	0.372	609	23.2	0.003	4	91.9	107.5	0.0	0.003	NA	NA	500m.pg15b1p1r2.cx5
l.i1
l.i1: continue load after secondary indexes created
Performance metrics for all DBMS, not just the ones listed above. Some are normalized by throughput, others are not. Legend for results is here.
ips	qps	rps	rmbps	wps	wmbps	rpq	rkbpq	wpi	wkbpi	csps	cpups	cspq	cpupq	dbgb1	dbgb2	rss	maxop	p50	p99	tag
2419	0	3234	25.9	4107.0	65.3	1.337	10.959	1.698	27.627	7498	22.2	3.100	367	93.6	110.6	0.0	0.150	2447	1548	500m.pg1211.cx5
2541	0	3427	27.4	4312.6	68.5	1.349	11.056	1.697	27.622	7974	22.5	3.138	354	93.6	111.0	0.0	0.148	2547	1448	500m.pg137.cx5
2601	0	3496	28.0	4382.9	68.8	1.344	11.022	1.685	27.085	8019	21.0	3.083	323	93.6	113.2	0.0	0.249	2647	1298	500m.pg143.cx5
2586	0	3489	27.9	4373.3	68.6	1.349	11.067	1.691	27.178	7942	20.5	3.071	317	93.6	112.7	0.0	0.122	2647	1348	500m.pg15b1.cx5
2443	0	3309	28.3	4143.9	69.7	1.355	11.859	1.696	29.220	7603	21.6	3.112	354	93.6	113.7	0.0	0.588	2497	1149	500m.pg15b1p1.cx5
2444	0	3312	28.3	4138.7	69.7	1.355	11.871	1.694	29.197	7608	21.7	3.113	355	93.6	113.7	0.0	0.659	2497	1149	500m.pg15b1p1r2.cx5
q100.1
q100.1: range queries with 100 insert/s per client
Performance metrics for all DBMS, not just the ones listed above. Some are normalized by throughput, others are not. Legend for results is here.
ips	qps	rps	rmbps	wps	wmbps	rpq	rkbpq	wpi	wkbpi	csps	cpups	cspq	cpupq	dbgb1	dbgb2	rss	maxop	p50	p99	tag
100	11007	137	1.1	273.3	4.2	0.012	0.102	2.739	43.307	42594	28.1	3.870	102	93.7	96.0	0.0	0.015	11124	3324	500m.pg1211.cx5
100	11188	139	1.1	273.8	4.2	0.012	0.103	2.744	43.382	43289	28.2	3.869	101	93.7	96.2	0.0	0.052	11315	3279	500m.pg137.cx5
100	11059	139	1.1	325.4	4.7	0.013	0.104	3.257	48.257	42722	26.7	3.863	97	93.7	99.6	0.0	0.046	11172	4907	500m.pg143.cx5
100	10888	139	1.1	300.4	4.5	0.013	0.105	3.007	46.125	42036	26.6	3.861	98	93.7	99.6	0.0	0.051	11012	4043	500m.pg15b1.cx5
100	11138	140	1.1	341.4	4.8	0.013	0.103	3.417	49.621	42991	26.6	3.860	96	93.7	99.9	0.0	0.045	11283	3980	500m.pg15b1p1.cx5
100	11115	140	1.1	344.8	4.9	0.013	0.104	3.451	50.079	42906	26.7	3.860	96	93.7	100.6	0.0	0.080	11284	3102	500m.pg15b1p1r2.cx5
q500.1
q500.1: range queries with 500 insert/s per client
Performance metrics for all DBMS, not just the ones listed above. Some are normalized by throughput, others are not. Legend for results is here.
ips	qps	rps	rmbps	wps	wmbps	rpq	rkbpq	wpi	wkbpi	csps	cpups	cspq	cpupq	dbgb1	dbgb2	rss	maxop	p50	p99	tag
499	11127	657	5.2	1063.1	18.5	0.059	0.479	2.129	38.034	44177	28.7	3.970	103	94.6	98.8	0.0	0.008	11133	10980	500m.pg1211.cx5
499	11190	658	5.2	1064.7	18.5	0.059	0.477	2.132	37.931	44415	28.8	3.969	103	94.6	98.7	0.0	0.008	11193	11028	500m.pg137.cx5
500	11074	658	5.2	1018.8	17.7	0.059	0.483	2.040	36.347	43909	27.7	3.965	100	94.6	99.7	0.0	0.006	11076	10932	500m.pg143.cx5
500	10945	658	5.2	1019.7	17.9	0.060	0.489	2.042	36.612	43392	27.7	3.965	101	94.6	99.7	0.0	0.006	10948	10820	500m.pg15b1.cx5
500	11276	658	5.2	1015.5	17.6	0.058	0.475	2.033	36.129	44649	27.7	3.960	98	94.6	100.1	0.0	0.016	11284	11140	500m.pg15b1p1.cx5
500	11301	658	5.2	1018.2	17.7	0.058	0.473	2.038	36.186	44742	27.7	3.959	98	94.6	100.0	0.0	0.005	11300	11160	500m.pg15b1p1r2.cx5
q1000.1
q1000.1: range queries with 1000 insert/s per client
Performance metrics for all DBMS, not just the ones listed above. Some are normalized by throughput, others are not. Legend for results is here.
ips	qps	rps	rmbps	wps	wmbps	rpq	rkbpq	wpi	wkbpi	csps	cpups	cspq	cpupq	dbgb1	dbgb2	rss	maxop	p50	p99	tag
999	11072	1291	10.3	1696.4	32.3	0.117	0.952	1.698	33.103	45364	29.6	4.097	107	95.5	102.8	0.0	0.014	11076	10900	500m.pg1211.cx5
999	11135	1294	10.3	1697.4	32.3	0.116	0.948	1.699	33.104	45624	29.7	4.097	107	95.5	102.8	0.0	0.014	11140	10932	500m.pg137.cx5
999	10986	1293	10.3	1743.1	31.6	0.118	0.963	1.745	32.426	45001	28.7	4.096	104	95.5	104.5	0.0	0.007	10996	10836	500m.pg143.cx5
999	10911	1298	10.4	1741.3	31.6	0.119	0.974	1.743	32.362	44688	28.8	4.096	106	95.5	104.5	0.0	0.008	10916	10743	500m.pg15b1.cx5
999	11072	1294	10.3	1732.2	31.5	0.117	0.957	1.734	32.297	45301	28.9	4.092	104	95.5	104.5	0.0	0.007	11076	10903	500m.pg15b1p1.cx5
999	11044	1294	10.3	1733.0	31.5	0.117	0.959	1.735	32.305	45206	28.8	4.093	104	95.5	104.5	0.0	0.007	11060	10884	500m.pg15b1p1r2.cx5
l.i0
- l.i0: load without secondary indexes
- Legend for results is here.
- Each entry lists the percentage of responses that fit in that bucket (slower than max time for previous bucket, faster than min time for next bucket).
Insert response time histogram
256us	1ms	4ms	16ms	64ms	256ms	1s	4s	16s	gt	max	tag
0.000	93.778	6.218	0.003	0.001	nonzero	0.000	0.000	0.000	0.000	0.161	pg1211.cx5
0.000	97.090	2.902	0.007	nonzero	nonzero	0.000	0.000	0.000	0.000	0.182	pg137.cx5
0.000	82.939	17.055	0.005	0.001	nonzero	0.000	0.000	0.000	0.000	0.236	pg143.cx5
0.000	0.191	99.804	0.004	0.001	nonzero	0.000	0.000	0.000	0.000	0.159	pg15b1.cx5
0.000	96.815	3.178	0.006	nonzero	nonzero	0.000	0.000	0.000	0.000	0.230	pg15b1p1.cx5
0.000	96.776	3.220	0.004	nonzero	nonzero	0.000	0.000	0.000	0.000	0.198	pg15b1p1r2.cx5
l.x
- l.x: create secondary indexes
- Legend for results is here.
- Each entry lists the percentage of responses that fit in that bucket (slower than max time for previous bucket, faster than min time for next bucket).
TODO - determine whether there is data for create index response time
l.i1
- l.i1: continue load after secondary indexes created
- Legend for results is here.
- Each entry lists the percentage of responses that fit in that bucket (slower than max time for previous bucket, faster than min time for next bucket).
Insert response time histogram
256us	1ms	4ms	16ms	64ms	256ms	1s	4s	16s	gt	max	tag
0.000	0.000	0.000	26.919	73.059	0.023	0.000	0.000	0.000	0.000	0.150	pg1211.cx5
0.000	0.000	0.000	32.599	67.334	0.067	0.000	0.000	0.000	0.000	0.148	pg137.cx5
0.000	0.000	0.000	34.360	65.534	0.106	0.000	0.000	0.000	0.000	0.249	pg143.cx5
0.000	0.000	0.000	35.285	64.651	0.064	0.000	0.000	0.000	0.000	0.122	pg15b1.cx5
0.000	0.000	0.000	29.471	70.407	0.107	0.014	0.000	0.000	0.000	0.588	pg15b1p1.cx5
0.000	0.000	0.000	29.325	70.573	0.087	0.015	0.000	0.000	0.000	0.659	pg15b1p1r2.cx5
q100.1
- q100.1: range queries with 100 insert/s per client
- Legend for results is here.
- Each entry lists the percentage of responses that fit in that bucket (slower than max time for previous bucket, faster than min time for next bucket).
Query response time histogram
256us	1ms	4ms	16ms	64ms	256ms	1s	4s	16s	gt	max	tag
99.762	0.238	0.001	nonzero	0.000	0.000	0.000	0.000	0.000	0.000	0.015	pg1211.cx5
99.768	0.230	0.002	nonzero	nonzero	0.000	0.000	0.000	0.000	0.000	0.052	pg137.cx5
99.820	0.177	0.003	nonzero	nonzero	0.000	0.000	0.000	0.000	0.000	0.046	pg143.cx5
99.807	0.186	0.005	0.001	nonzero	0.000	0.000	0.000	0.000	0.000	0.051	pg15b1.cx5
99.783	0.211	0.005	0.001	nonzero	0.000	0.000	0.000	0.000	0.000	0.045	pg15b1p1.cx5
99.728	0.265	0.006	0.001	nonzero	nonzero	0.000	0.000	0.000	0.000	0.080	pg15b1p1r2.cx5
Insert response time histogram
256us	1ms	4ms	16ms	64ms	256ms	1s	4s	16s	gt	max	tag
0.000	0.000	0.000	85.007	14.993	0.000	0.000	0.000	0.000	0.000	0.027	pg1211.cx5
0.000	0.000	0.000	85.292	14.708	0.000	0.000	0.000	0.000	0.000	0.037	pg137.cx5
0.000	0.000	0.000	96.708	3.292	0.000	0.000	0.000	0.000	0.000	0.042	pg143.cx5
0.000	0.000	0.000	96.333	3.667	0.000	0.000	0.000	0.000	0.000	0.058	pg15b1.cx5
0.000	0.000	0.000	96.257	3.743	0.000	0.000	0.000	0.000	0.000	0.062	pg15b1p1.cx5
0.000	0.000	0.000	95.986	4.014	0.000	0.000	0.000	0.000	0.000	0.054	pg15b1p1r2.cx5
q500.1
- q500.1: range queries with 500 insert/s per client
- Legend for results is here.
- Each entry lists the percentage of responses that fit in that bucket (slower than max time for previous bucket, faster than min time for next bucket).
Query response time histogram
256us	1ms	4ms	16ms	64ms	256ms	1s	4s	16s	gt	max	tag
99.978	0.021	0.001	nonzero	0.000	0.000	0.000	0.000	0.000	0.000	0.008	pg1211.cx5
99.978	0.021	0.001	nonzero	0.000	0.000	0.000	0.000	0.000	0.000	0.008	pg137.cx5
99.974	0.024	0.001	nonzero	0.000	0.000	0.000	0.000	0.000	0.000	0.006	pg143.cx5
99.975	0.024	0.001	nonzero	0.000	0.000	0.000	0.000	0.000	0.000	0.006	pg15b1.cx5
99.976	0.022	0.001	nonzero	0.000	0.000	0.000	0.000	0.000	0.000	0.016	pg15b1p1.cx5
99.976	0.023	0.001	nonzero	0.000	0.000	0.000	0.000	0.000	0.000	0.005	pg15b1p1r2.cx5
Insert response time histogram
256us	1ms	4ms	16ms	64ms	256ms	1s	4s	16s	gt	max	tag
0.000	0.000	0.000	96.850	3.150	0.000	0.000	0.000	0.000	0.000	0.063	pg1211.cx5
0.000	0.000	0.000	96.946	3.053	0.001	0.000	0.000	0.000	0.000	0.069	pg137.cx5
0.000	0.000	0.000	97.235	2.764	0.001	0.000	0.000	0.000	0.000	0.068	pg143.cx5
0.000	0.000	0.000	96.426	3.569	0.004	0.000	0.000	0.000	0.000	0.080	pg15b1.cx5
0.000	0.000	0.000	95.683	4.311	0.006	0.000	0.000	0.000	0.000	0.081	pg15b1p1.cx5
0.000	0.000	0.000	95.521	4.475	0.004	0.000	0.000	0.000	0.000	0.069	pg15b1p1r2.cx5
q1000.1
- q1000.1: range queries with 1000 insert/s per client
- Legend for results is here.
- Each entry lists the percentage of responses that fit in that bucket (slower than max time for previous bucket, faster than min time for next bucket).
Query response time histogram
256us	1ms	4ms	16ms	64ms	256ms	1s	4s	16s	gt	max	tag
99.936	0.062	0.001	0.001	0.000	0.000	0.000	0.000	0.000	0.000	0.014	pg1211.cx5
99.937	0.061	0.001	0.001	0.000	0.000	0.000	0.000	0.000	0.000	0.014	pg137.cx5
99.929	0.069	0.002	0.001	0.000	0.000	0.000	0.000	0.000	0.000	0.007	pg143.cx5
99.929	0.069	0.002	0.001	0.000	0.000	0.000	0.000	0.000	0.000	0.008	pg15b1.cx5
99.932	0.066	0.002	0.001	0.000	0.000	0.000	0.000	0.000	0.000	0.007	pg15b1p1.cx5
99.928	0.070	0.002	0.001	0.000	0.000	0.000	0.000	0.000	0.000	0.007	pg15b1p1r2.cx5
Insert response time histogram
256us	1ms	4ms	16ms	64ms	256ms	1s	4s	16s	gt	max	tag
0.000	0.000	0.000	92.923	7.070	0.007	0.000	0.000	0.000	0.000	0.075	pg1211.cx5
0.000	0.000	0.000	92.585	7.401	0.015	0.000	0.000	0.000	0.000	0.095	pg137.cx5
0.000	0.000	0.000	92.343	7.646	0.011	0.000	0.000	0.000	0.000	0.107	pg143.cx5
0.000	0.000	0.000	88.433	11.551	0.017	0.000	0.000	0.000	0.000	0.089	pg15b1.cx5
0.000	0.000	0.000	89.035	10.949	0.017	0.000	0.000	0.000	0.000	0.084	pg15b1p1.cx5
0.000	0.000	0.000	88.795	11.187	0.018	0.000	0.000	0.000	0.000	0.089	pg15b1p1r2.cx5